Pressure and temperature dependence of growth and morphology of Escherichia coli: Experiments and Stochastic Model
Abstract
We have investigated the growth of Escherichia coli E.coli, a mesophilic bacterium, as a function of pressure and temperature . E.coli can grow and divide in a wide range of pressure (atm) and temperature (C). For C, the division time of E.coli increases exponentially with pressure and exhibit a departure from exponential behavior at pressures between atm for all the temperatures studied in our experiments. For C, the division time shows an anomalous dependence on pressure – first decreases with increasing pressure and then increases upon further increase of pressure. The sharp change in division time is followed by a sharp change in phenotypic transition of E. Coli at high pressures where bacterial cells switch to an elongating cell type. We propose a model that this phenotypic changes in bacteria at high pressures is an irreversible stochastic process whereas the switching probability to elongating cell type increases with increasing pressure. The model fits well the experimental data. We discuss our experimental results in the light of structural and thus functional changes in proteins and membranes.
Center for Studies in Physics and Biology, The Rockefeller University, 1230 York Avenue, New York, NY 10021 USA.
Institue for Advanced Study, Einstein Drive, Princeton, New Jersey 08540 USA.
Introduction
A vast majority of bacteria and archaea can grow in diverse environmental conditions. The range of those conditions include high pressures [1, 2], high temperature [3], low temperature [4], high salinity, low [5] and high pH [6, 7] etc. Since these conditions are not hospitable for other life forms hence these organisms are named extremophiles [3, 8, 1, 9, 10, 11, 12]. One of the first isolated extremophile Thermus aquaticus, a thermophilic bacteria can survive at near-boiling temperatures [3]. Adaptation of these organisms to such harsh conditions raises many interesting questions–how do they adapt to these conditions ? Does the adaptation occur at single component level such as mutations in proteins leading to their barostability and thermostability, or the adaptation to these conditions has a collective nature –whereas more than one cellular components act in compliance to preserve the functionality of each other.
Recent studies on various aspects - such as taxonomy, ecology, enzymology of these microorganisms have provided insights on the adaptation of these organism to their environmental conditions [9, 13, 14]. For example, the bacterial cytoplasmic membrane must maintain its liquid-crystalline structure and semipermeability with changing conditions [15]. It was shown that bacterial membrane adapt to the temperature changes by changing their lipid composition [16]. Adaptation of a protein to non-ambient conditions requires that it maintains its catalytic activity as well as its structure [17, 18]. Most globular proteins denature both at high as well as low temperatures. Moreover, even if a protein does not denature at low temperature, small thermal fluctuations will lead to decreased catalytic activity at low temperatures. Indeed in few studies on proteins from psychrophilic organisms, it was found that proteins are more flexible [19]. However, increase of flexibility also leads to high propensity of unfolding of the protein. Hence a fine balance between the structural flexibility and stability is required [20]. Recent comparative study of an essential recombination protein RecA from mesophilic and thermophilic bacteria suggests that its function of binding to single stranded DNA is adapted to the conditions in which organisms grow [21]. A study of SSB, a single-stranded DNA binding protein, from mesophilic and piezophilic bacteria show similar adaptation [22].
While there is a large body of work on the stability and kinetics of proteins and adaptation of different components of prokaryotes obtained from extremophiles, the growth of bacteria is only approached using conventional methods such as plate counting. Such studies have provided killing curves of saturated bacterial solutions upon increasing pressures and hence a pressure-temperature phase diagram of the bacterial survival is obtained [23].
In order to understand the adaptation of bacterial cells to extreme pressure and temperature, an understanding of growth bottlenecks and physical changes of bacterial growing at ambient conditions induced by different thermodynamic conditions is important. In this paper, we study the pressure-temperature dependence of growth and phenotypic changes of a mesophilic bacterium, E. coli, using an optical method which allows us to measure the growth of bacterial in real time at different pressures and temperatures. We have investigated the growth and morphological changes in a wide range of pressure and temperature. In “Methods”, we describe our experimental setup and protocol to measure growth of bacteria. In “Results”, we summarize the results of the pressure-temperature dependence of growth followed by a stochastic model to account for the morphological changes induced by high pressure. Finally, we summarize and discuss our results in “Summary and Discussions”.
Experimental Setup
Measurement of growth at normal conditions is rather easy as there are many commercial photometers available. High pressure and temperature require that a photometer optics is built around a high pressure cell in order to obtain the growth curve. Below we describe our experimental setup to measure the growth.
Bacteria absorb and scatter light with intensity which depends on the scattering angle and absorption coefficient [24]. The most common method of measuring bacterial concentration in a solution is turbidity method where the extinction of the light is measured at a fixed angle, usually in forward direction. The method relies on many assumptions including (i) each bacterial cell is an independent scatterer (ii) the shape of bacterial cell is uniform (iii) multiple scattering is negligible. The extinction cross section is a sum of cross section due to scattering and due to absorption , and can be written as
| (1) |
Then the coefficient of extinction is
| (2) |
where is the number density of bacterial cells. The intensity detected by a light detector after the incident light traverses a distance in the scattering medium is given by
| (3) |
where is the intensity of the light incident on the medium. Hence the difference of the logarithm of the intensities of incident and the transmitted light is proportional to the concentration of scatterers in the medium. The optical density (OD) of the medium is thus defined as
| (4) |
A schematic of our experimental setup to measure pressure temperature dependence of growth is shown in Fig. 1.
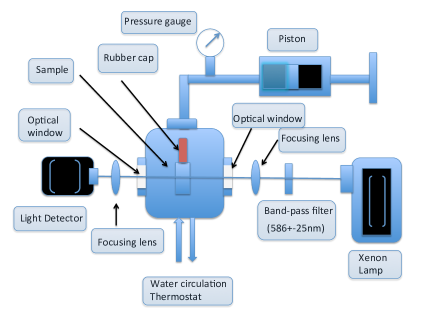
A sample of bacteria with LB medium is contained in a rectangular cuvette (Spectrocell; volume: 400) made up of fused silica and having a square cross-section (6mmx6mm). The cuvette with a flexible movable teflon cap is loaded into the high pressure cell (ISS, Illinois, USA). A piston is used to pressurize the water inside the pressure cell, and the pressure is measured by a pressure gauge. The growth of the bacteria is measured in real time by shining a white light (xenon lamp) which passes through an excitation bandpass filter (Semrock, FF01-586/15-25) and is focused onto the cuvette holding the sample. We chose light with nm wavelength to keep our measurements consistent with measurements done with most of the commercially available photometers. The transmitted light is focused on a light detector on the other side of the cuvette which measures the intensity of the transmitted light. The light detector is built around photo sensor chip TSL230R (TAOS). TSL230R photo sensor consists of a silicon photodiode with a current to frequency converter built into it. The nonlinearity error is typically 0.2% at 100kHZ. The frequency of the TTL signal from the detector proportional to the incident light intensity is measured using MIO16 frequency counter chip interfaced to Labview software (National Instruments). We maintain the intensity of the light source such that all our experiments fall into the linear regime of the sensor. The distance between the light sensor and the cuvette was cm. Distance between the detector and the sample dictatates the angular integration of the scattered light incident on the sensor. The temperature of the high pressure cell is regulated using a circular water bath thermostat. The time for growth measurement ranged between and mins, depending on the pressure-temperature dependent growth rate of bacteria. The entirely closed structure of our experimental setup imposes a major limitation on the regulation of oxygen in our experiments. The growth measurements were done in oxygen limited conditions. The partial pressure of oxygen in LB medium was kPa.
Cell culture and growth medium
0.1 Bacteria and Media.
For all the experiments reported here, DH strain of E. coli was used. While other wild type strains of E. Coli such as MG1655 (K-12) or MC1000 are common for studying the physiology of bacterial cells due to least amount of genetic mutations, DH5 offers certain advantages for our studies. Earlier studies have shown that a major effect of the pressure on the morphology is elongation of cells. Due to cell elongation, SOS system is implicated in the change of morphology at high pressures. The recA1 mutation in DH5 causes the elimination of the homologous recombination, an initiatiator process for SOS pathway upon UV irradiation [25]. Lack of RecA mediated recombination in DH removes the effect of pressure on the SOS pathway. Hence our experimental results would be able to distinguish the high pressure effects where recombination system is not involved (discussed in the Summary and Dicussion section). The drawback of using DH is that since it lacks the homologous recombination system, the cell are sickly and the growth is slower compared to other wild type strains. Due to its slow growth, cells were grown in standard Luria Broth (LB) medium [26], which is a rich medium for bacterial growth. The pH of the growth medium was kept to by adding NaOH to the solution. For the consistency of the experiments, cells were first grown on a LB plate for about 10 hours and then subsequently used for experiments as described below.
Growth conditions and measurements. Bacterial cells picked from LB plate were first grown in LB medium at atmospheric pressure and C in an incubator until the optical density (OD) of the solution is about . A small amount of freshly grown bacterial cells was then added to a cuvette containing L of medium to bring the initial OD to and was used as the starting point for all the pressure temperature measurements. The final bacterial solution with LB medium was then transfered to a high pressure cuvette at room temperature and pressure and was closed with a teflon cap. The cuvette with the bacterial solution was then put into the high pressure chamber (see the experimental setup) equilibrated at the temperature of interest and the piston of the high pressure setup was slowly increased until the pressure gauge reading reaches the desired value of the pressure. The growth of the bacterial cells then was assessed by measuring extinction of light as described in our experimental setup. Growth measurements were done in a sealed high pressure cell. Images were taken using Sensicam cooled CCD camera connected to Zeiss Axiovert 35 microscope with a 40X Olympus objective. Image analysis of bacterial cells was done using ImageJ software [27].
Results
Exponential dependence of division time with pressure
In Fig. 2, we show growth curve obtained in our experiments at atm and C.
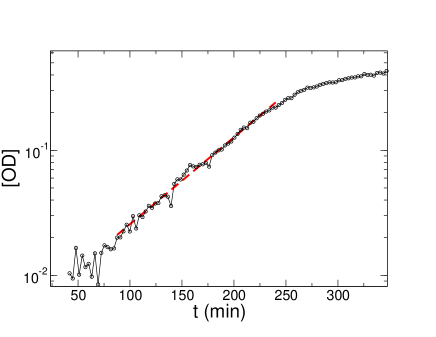
The growth curve shows a typical lag growth regime at small times followed by an exponential growth phase and finally a saturation regime. The value of the saturation OD is smaller compared to the saturation OD (typically 1.0) reached when oxygen is not a growth limiting agent. In the oxygen limited environment both the division time and saturation OD are affected.
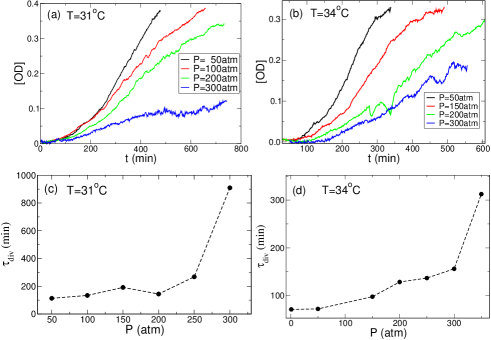
In Figs. 3 (a) and (b), we show the growth curve of E. coli for various pressures at C and C respectively. We find that where the saturation is reached within the time scale of our experiments, the time profile of the growth curves show the typical characteristics of growth at atm and C. The number of bacterial cells at time in the exponential regime can be written as:
| (5) |
where is the number of bacterial cell at the beginning of the exponential phase and is the division time. corresponds to the number of generation in a given time . In Fig. 3 (c) and (d), we show extracted from Figs. 3 (a) and (b) for various pressures at C and C respectively. We find that increases, and hence the rate of growth decreases, upon increasing pressure. We further find that the corresponding to the saturation regime decreases upon increasing pressure. Earlier studies on the effect of pressure on the total biomass production of different bacteria have found a similar decrease in total mass as a function of pressure [28].
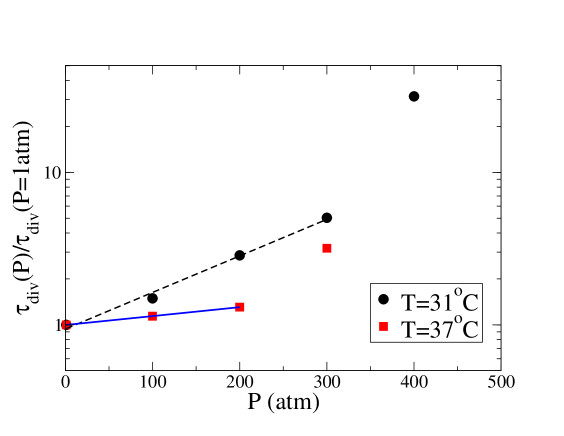
The division time at a given temperature increases with pressure but shows a discontinous jump at high pressures. We find that the discontinuous jumps in ocurrs between atm for all the temperatures studied in our experiments. To further characterize the low pressure regime of , in Fig. 4, we show the division time as a function of pressure for two different temperature on a linear-log plot. We find that the low pressure regime of increase of division time with pressure can be fit by an exponential function where the exponent increases with decreasing temperature. The discontinuous change in coincides with departure from exponential behavior.
Pressure and temperature do not only affect the structural stability of biomolecules but can also affect the thermodynamic force driving different biochemical processes inside the cell. In general, the time scale of a given chemical reaction is proportional to , where is the Boltzmann constant and is the volume change across the chemical reaction. It is easy to see that any chemical reaction accompanied by a positive volume change will exponentially slowdown with pressure. In this context, the exponential dependence of with pressure (Fig.4) is not a surprise. Note that it is a very simple consideration as most of the biochemical processes are not invidividual but usually involve a cascade of chemical reacations corresponding to any cellular module. Nonetheless, the exponential dependence of the division time with pressure does suggest an overall positive volume change. Furthermore, itself is a function of pressure and temperature. At moderate pressures and temperature one may assume it to be a constant. It is hard to speculate the mechanisms responsible for slow growth and further experiments must be carried out to precisely figure out the decrease of growth rate at high pressure.
The other remarkable feature of the pressure dependence of division time is the abrupt increase of in the range of pressures 200-400 atm for all the temperatures studied here. Where does this discontinuity in the pressure dependence of growth come from ? Discontinuity in the growth as a function of pressure suggest that something abrupt must happen in these range of pressure. The range of pressures where we see a discontinous jump in the division time can not be attributed to protein denaturation as the pressure is not high enough to denature the proteins. While the proteins stability is rather unaffected, the functionality of proteins may show a large variability in this range of pressures [21]. We hypothesize that the discontinuous jump in the division time stem from functional changes in biomolecules.
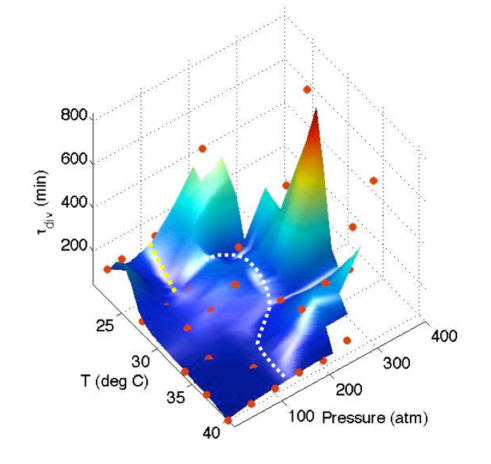
Pressure-temperature phase diagram of the division time of E. coli
In Fig. 5, we show the surface plot of pressure-temperature dependence of . It shows smooth change as a function of pressure and temperature but high pressures as well as low temperatures growth are marked by sharp change in . We further find that the slope of the locus of the points in the (P,T) plane where shows sharp transition with respect to pressure resembles the functional phase diagram of a typical protein (shown as dotted white curve in Fig. 5) [21, 22]. A careful observation of the data reveals that at low , there is a region where exhibits a non-monotonic behavior with pressure. In this narrow region of pressure and temperature, first decreases and then increases further upon increasing pressure. The yellow dotted line with marks the boundary between this anomalous behavior and normal behavior of increasing division time with increasing pressure. We hypothesize that this anomalous behavior of division time as a function pressure results from structural transition in the phospholipids present in the cell membrane at low temperatures [29].
Bacterial cell elongation, length distribution and heterogeneities:
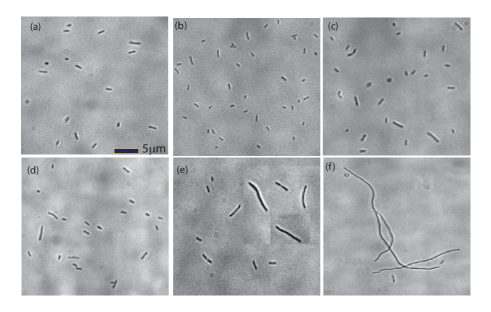
Besides the slow growth of the population of bacterial cells at high pressures, the other interesting features of the response to high pressure is found in the morphological changes in bacterial cells [30, 31]. We find that average bacterial cell length of E. Coli increases as a function of pressure (see Fig. 6).
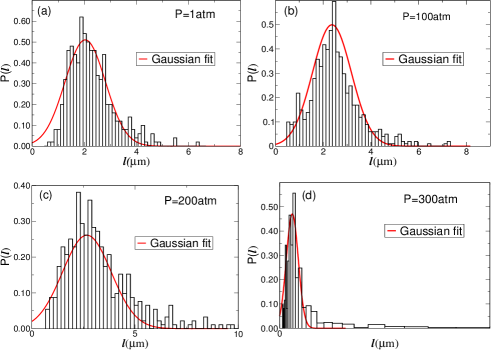
To further characterize the bacterial elongation, we looked at the distribution of bacterial cell length at various pressures at a given temperature. In Fig. 7, we show the distribution of bacterial cell length at the end of our experiments for pressures atm respectively for C. The distribution of at atm follows a Gaussian distribution. As the pressure is increased, starts developing a non-Gaussian tail suggesting a growing bacterial cell length heterogeneities. A major fraction of the cells still retain the same morphology as atm, but there is an increase in the population of elongated cells upon increasing pressure.
The average value of the cell length increases upon increasing pressure and shows a sharp increase at the same pressure where the division time also shows a sharp increase (see Fig. 8). While the bacterial cell elongation at high pressure is known, the sharp transition at high pressure is new. Furthermore, we find that the pressure and temperature where the growth is marked by a sharp increase in division time correlates well with sharp changes in bacterial cell length. The exponential increase of division time with pressure as we saw in the earlier section can be interpreted as exponential decrease of overall kinetics leading to slow growth due to cell elongation at high pressure. While the increased cell length upon increasing pressure would explain the decreased rate of growth, it is not clear if the elongated cells would grow slower than the cells with normal morphology. For example, if the elongated cells just lack the ability of cell division but replicate their genome normally then one would expect the growth rate per unit cell size not to change unless other kinetic processes also get affected by the increase of pressure.

The elongation of bacterial cells at high pressure has been a subject of intense research and to our knowledge no consensus on the molecular mechanism responsible for it is reached [31]. To account for the bacterial cell length heterogeneities and elongation upon increased pressure, we propose a stochastic model in the next section.
A stochastic irreversible switch model for the morphological changes at high pressures
A quick overview of Figs. 6 and 7 suggests that while the average length of the bacterial cells undergoes a sharp transition at high pressures, a major fraction of bacterial still retain the morphology of a normal cell.
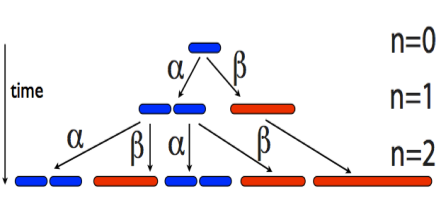
The change of morphology can be thought of as an irreversible switch of bacterial morphology during the course of growth of the bacterial cell where the rate of switching will depend on the pressure. Let us assume that we start with cells at time . Let’s further assume that the cells either decide to divide into two identical cells with probability or grow irreversibly to a filamenting bacteria with probability . Let’s further assume that the internal growth rate of both the normal cells and the filamenting cells is the same and hence whenever bacterial do not divide from one generation to a generation , the cell length just doubles (see Fig. 9). Hence at the end of the generations of division, the system will have different distribution of bacterial cell length . We can assume the initial distribution of bacterial length, as suggested by our experimental data, to be a Gaussian given by:
| (6) |
It can be shown easily that the above scheme of irreversible stochastic switching leads to number of various lengths of bacterial cells at the end of generations given by:
Hence in the extreme cases (i) no switching or will lead to no changes in the bacterial length (ii) , all the cells will elongate to the maximum limited by growth and number of divisions. In general, the number of bacterial cells of length is given by:
| (7) |
The total number of bacterial cells at the end of generation can be given by:
| (8) |
Now the probability of a bacterial cell with length is given by:
| (9) |
which in terms of the switching probability can be written as:
| (10) |
Hence the expectation value of length at the end of generation is given by:
Since the distribution of at is a Gaussian, the distribution of length at the end of generations can be written as:
| (11) | |||||
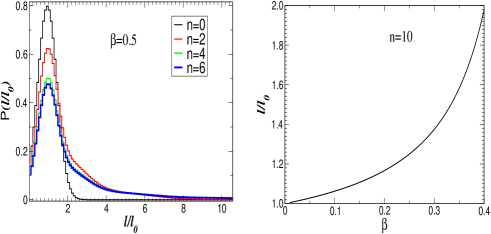
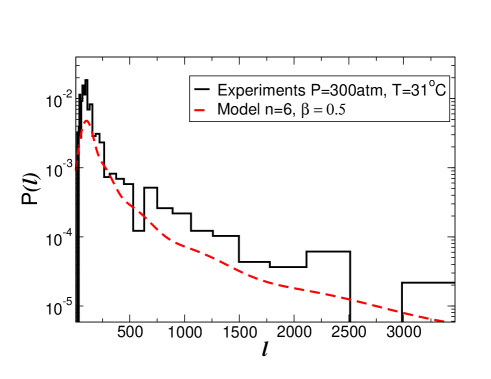
In Fig. 10(a), we show the evolution of the distribution of for a fixed value of . As the time progresses the distribution develops a long tail. Note that for , the system would undergo an irreversible fate where after few generations the population will be dominated by elongated cells and cells with normal length will vanish from the population in the limit of long time. We further show the expectation value of length in Fig. 10 (b) as a function of for a fixed number of generations. increases slowly for small values and growth sharply with increasing . To further test our model, we compare the data of at atm with our model in Fig. 11. We find that the model can reasonably reproduce the length distribution.
To further characterize the heterogeneities in the population of bacterial cell length, we calculate a non-Gaussian measure [32] of the distribution defined by:
| (12) |
where and are the second and fourth central moments of the distribution respectively. corresponds to a Gaussian distribution, while a deviation of from zero corresponds to the degree of deviation from a Gaussian distribution.
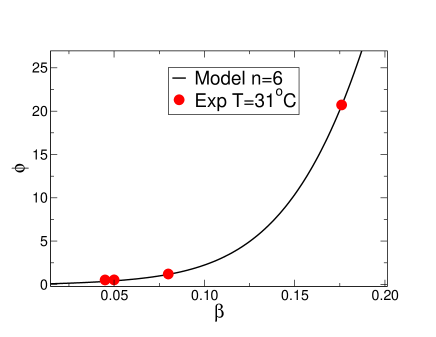
In Fig. 12, we show the dependence of on switching probability for . We find that grows slowly first but increases sharply with . In Fig. 12, we also show the non-Gaussianity parameter measured from the experimental distribution of cell lengths at pressures and atm and temperature C as solid red circles. Note that model assumes a transition but is not able to say much about the physical origin of such phenotypic transition. What are the biophysical mechanisms responsible for the cell elongation ? Where does the stochasticity come from ? The clue to the latter comes from the measured transition in the cell length observed here and the polymerization of one of the cytoskeletal proteins responsible for cell division, FtsZ. Recent experiments on FtsZ in vivo and in vitro suggests that FtsZ protein depolymerizes at high pressures leading to delocalization of FtsZ in the cell [31]. Furthermore, it was shown that FtsZ is not able to form the Z-ring which is considered responsible for the mechanical forces required for the cell division. Could FtsZ be responsible for the sharp transition in the growth and the cell division observed in our experiments ? Or a set of other processes, including the formation of Z-ring by FtsZ, lead to the observed transition ? Is the cell elongation phenomenon due to only the depolymerization of FtsZ at high pressures or more than one cellular processes are responsible for it ? The answers to all these questions can only come from further experiments that we are performing.
Summary and Discussion
We have investigated the growth of E. coli in real time as a function of pressure and temperature. We find that E. coli can grow and divide in a wide range of pressures ( atm) and temperatures . The division time of bacteria increases upon increasing pressure at a given temperature. Furthermore, division time at a constant temperature exhibits an exponential dependence on pressure for moderate values of pressure. Moreover, we find that for all the temperatures studied, division time shows an abrupt increase at pressures between atm. While at high this sharp increase in division time with pressure is very large where can be larger than min, at low , increases by few folds. Furthermore, we find that the division time shows an anomalous decrease and then increase with pressure at low temperature. We hypothesize that this anomalous behavior of division time is a manifestation of the structural changes in phospholipids in the membrane. Further experiments on a veriety of cell types where the lipid composition is known would be required to answer this question.
We next looked at the bacterial cell morphology after application of pressure till the time of saturation in the cases where we could reach the saturation or few generation times where the saturation was hard to reach over the time scale of our experiments. We find that average bacterial length increases upon pressure. While the bacterial elongation at high pressures [30, 31] is known, we find that E.Coli. shows a behavior of morphology very similar to growth rate or division time, whereas the average cell length also displays a sharp increase at pressures between and atm. Moreover, the heterogeneities in the cell length of bacteria increases upon increasing pressure. To explain the heterogeneities in the cell length with pressure, we propose a simple stochastic irreversible switch model of bacterial phenotypes (normal and filamenting). We find that the model fits well the experimental data of distribution of bacterial cell length at different pressure. Moreover, the model allows us to extract the switching probability of E. Coli. bacteria to filamenting phenotype, which increases upon increasing pressure. While the model captures the cell elongation phenomenon and explains the cell length distribution, it leaves us with many questions such as – what biophysical processes give rise to the stochasticity in the phenotypic transitions as a function of pressure ? A clue to this comes from the measured transition in the cell elongation observed here and depolymerization of FtsZ protein responsible for cell division. Note that since the bacterial strain used in our experiments (DH) lacks the homologous recombination system, the cell elongation can no be interpreted as the conventional SOS response of the system. Hence FtsZ depolymerization and delocalization leading to non-formation of a Z-ring is a potential biophysical process that may lead to phenotypic transitions proposed here. Further experiments are required where the polymerization of cytoskeletal proteins such as MreB and FtsZ can be visualized along with cell division at various pressures and temperatures.
Since growth is coupled to various other processes the bottlenecks could be either the structural integrity (such as protein denaturation or membrane structural changes) or the time integrity of various processes. There is a large body of literature on the behavior of different biomolecules at varied physical conditions. These studies indicate that at high pressures and temperatures the essential components that make up a cell may become unstable. Proteins can unfold and membranes can undergo structural transitions at high pressures leading to death of a cell [17, 18]. The other issue which has been rather overlooked in past is the variation in the time scales of various processes. Since pressure and temperature not only change the stability but they also modify the thermodynamic driving force of a chemical reaction and hence lead to changes in time scales of various processes. How the time integrity of various processes is maintained by a cell is an interesting question. A better understanding can only come from a systematic study of the mutations in the protein/enzymes or regulatory circuits involved in various processes.
References
- [1] Yayanos, A. A., Dietz, S., & van Boxtel, R., Obligate barophilic bacterium from the Mariana Trench. Proc. Nat. Acad. Sci. 78, 5212-5215 (1981).
- [2] Kato, C., Li L., Nogi, Y., Nakamura, Y, Tamaoka, J., and Horikoshi, K., Extremely barophilic bacteria isolated from the Mariana Trench, Challenger Deep, at a depth of 11,000 meters.Applied Environmental Microbiology 64, 1510-1513 (1998).
- [3] Brock, T. D., and Freeze, H., Thermus aquaticus gen. n. and sp. n. a non-sporulating extreme thermophile. J. Bacteriol. 98, 289-297 (1969).
- [4] Bakermans, C., Tsapin, A.I., Souza-Egipsy, V., Gilichinsky, D.A., and Nealson, K.H., Reproduction and metabolism at C of bacteria isolated from Siberian permafrost. Environ. Microbiol. 5, 321-326 (2003).
- [5] Schleper, C., Puhler, G., Kuhlmorgen, B., and Zillig, W., Life at extremely low pH. Science 375, 741-742 (1995).
- [6] Horikoshi, K., & Akiba, T., Alkalophilic Microorganisms: A New Microbial World. Heidelberg: Springer. (1982).
- [7] Horikoshi, K., Alkaliphiles. eLS (2008).
- [8] Oshima, T., & Imahori, K., Description of Thermus thermophilus (Yoshida and Oshima) comb. nov., a nonsporulating thermophilic bacterium from a Japanese thermal spa.Int J Syst Bacteriol 24, 102-112 (1974).
- [9] Hebraud M. and Potlier P., Cold shock response and low temperature adaptation in psychrotrophic bacteria. J. Mol. Microbiol. Biotechnol. 1, 211-219 (1999).
- [10] Sharma A. et. al., Microbial activity at gigapascal pressures. Science 295, 1514 (2002).
- [11] Deguchi, S. et al., Microbial growth at hyperaccelerations up to .PNAS 19 7997-8002 (2011).
- [12] Sakiyama T. and Ohwada K., Effect of hydrostatic pressure on the growth of deep-sea bacterial communities. Proc. NIPR Symp. Polar Biol. 11, 1-7 (1998).
- [13] Sterner, R., & Liebl, W., Thermophilic adaptation of proteins. Crit. Rev. Biochem. Mol. Bio. 36, 39-106 (2001).
- [14] Charlier, D., & Droogmas L., Microbial life at high temperature, the challenges, the strategies. Cell. Mol. Life Sci. 62, 2974-2984 (2005).
- [15] Kaneshiro M. S. and Clark D. S., Pressure effects on the composition and thermal behavior of lipids from the deep-sea thermophile Methanococcus jannaschii. J. Bacteriol. 177, 3668-3672 (1995).
- [16] Russell, N.J., and Fukunaga, N., A comparison of thermal adaptation of membrane lipids in psychrophilic and thermophilic bacteria. FEMS Microbiol. Rev. 75, 171-182 (1983).
- [17] Jaenicke, R. and Bohm, G., The stability of proteins in extreme environments.Opin. Struct. Biol. 8, 738-748 (1998).
- [18] Razvi, A. & Scholtz, J.M., Lessons in stability from thermophilic proteins. Protein Sci. 15, 1569-1578 (2006).
- [19] Peterson, M.E., Daniel, R.M., Danson, M.J., & Eisenthal, R., The dependence of enzyme activity on temperature: determination and validation of parameters. Biochem. J. 402, 331-337 (2007).
- [20] Feller, G., Gerday, C., Psychrophilic enzymes: hot topics in cold adaptation. Nat. Rev. Microbiol. 1, 200-208 (2003).
- [21] Merrin, J., Kumar, P., & Libchaber A.J., Effect of pressure and temperature on the binding of RecA to ssDNA. Proc. Nat. Acad. Sci. (2001).
- [22] Chilukuri, L.N., Bartlett, D.H. & Fortes, P.A., Comparison of high pressure induced dissociation of single-stranded DNA-binding protein (SSB) from high pressure-sensitive and high pressure-adapted marine Shewanella specis. Extremophiles 6 377-383 (2002).
- [23] Ludwig, H.B., Hallbauer, C., & Scigalls, W., Inactivation microorganisms by hydrostatic pressure. In High pressure and Biotechnology, ed. Baleney C. et. al. London, John Libby, pp. 25-32 (1992).
- [24] Bohren C.F., & Huffman D.R., Absorption and scattering of light by small particles, Wiley Science USA (1998).
- [25] Michel, B., After 30 years of study, the bacterial SOS response still surprises us. PLoS Biology 3, 255 (2005).
- [26] Bertani, G., Studies on Lysogenesis. I. The mode of phage liberation by lysogenic Escherichia coli. J. Bacteriol. 62, 293-300 (1952).
- [27] Rasband, W.S., ImageJ, U. S. National Institutes of Health, Bethesda, Maryland, USA, http://imagej.nih.gov/ij/, 1997-2011.
- [28] Matsumura P., Keller M.K., & Marquis R. E., Restricted pH ranges and reduced yields for bacterial growth under pressure. Microbial Ecology 1, 176-189 (1974).
- [29] Winter R. & Dzwolak, W., Exploring the temperature-pressure configurational landscape of biomolecules: from lipid membranes proteins. Phil. Trans. R. Soc. A 363, 537–563 (2005).
- [30] Zobell, C. E. & Cobet, A. B., Filament formation by Escherichia coli at increased hydrostatic pressures. J Bacteriol 87, 710–719 (1964).
- [31] Ishii, A., Sato, T., Wachi, M., Nagai, K., & Kato, C. , Effects of high hydrostatic pressure on bacterial cytoskeleton FtsZ polymers in vivo and in vitro. Microbiology 150, 1965-1972 (2004).
- [32] Rahman, A., Correlations in the Motion of Atoms in Liquid Argon. Phys. Rev. 136, A405 (1964).
We thank A. Buguin, Y. T. Maeda and J. Merrin, and H. E. Stanley for helpful discussions. AL acknowledges Florence Gould fellowship from the Institute for Advanced Study, Princeton, NJ USA and NSF grant No. PHY-0848815 for support.
The authors declare that they have no competing financial interests.
Correspondence and requests for materials should be addressed to Pradeep Kumar (email: pradeep.kumar@rockefeller.edu).