Structure and stability of online chat networks built on emotion-carrying links
Abstract
High-resolution data of online chats are studied as a physical system in laboratory in order to quantify collective behavior of users. Our analysis reveals strong regularities characteristic to natural systems with additional features. In particular, we find self-organized dynamics with long-range correlations in user actions and persistent associations among users that have the properties of a social network. Furthermore, the evolution of the graph and its architecture with specific k-core structure are shown to be related with the type and the emotion arousal of exchanged messages. Partitioning of the graph by deletion of the links which carry high arousal messages exhibits critical fluctuations at the percolation threshold.
pacs:
89.75.Fb 89.75.Hc 89.20.-aI Introduction
Quantitative analysis of human collective dynamics has recently become available based on the high-resolution empirical data from online communication systems, which can be studied as complex dynamical systems in physics laboratory. The self-organized dynamics, common to the online interactions, is crucial for the emergence of collective behaviors of users castellano2009 ; kleinberg2008 ; mitrovic2010c . The kind of social structures built in the dynamics, however, may depend on the technology features of the communication platform and other details such as visibility of user-to-user messages. Such details may affect actions of individual users and thus influence the course of events. For instance, the dynamics of message exchange along “friendship” links in the social network MySpace has been shown we-MySpace11 to yield structures much different from the conventional social networks newman2002 ; boccaletti2006 ; facebook2011 . Apart from the online social networks, the online games szell2010 ; ST12 , blogs, diggs, forums mitrovic2011 ; mitrovic2010c ; warsaw2011 etc, can also lead to recognizable user associations. In the online games szell2010 ; ST12 , for example, the users can mark friend/enemy relationship or undertake collective actions towards other users. On the other hand, indirect interactions on blogs provide hidden mechanisms in which the subjects of the posts and negative emotion (critique) dominate, leading to user communities centered around certain popular posts mitrovic2011 ; mitrovic2010c . Furthermore, frequency of interactions, subject of the communication, and amount of emotion conveyed in these messages may become critical for collective dynamics and for building specific associations among users over time. These aspects of the online communication dynamics represent a major challenge for quantitative analysis and theoretical modeling. Ideal empirical systems where this can be studied are the IRC (Internet-Relay-Chat) channels, where no a priori relationship among users exists.
In this paper we combine statistical physics with computer science methods of text analysis to perform a quantitative analysis of human collective behavior in online chats. A large dataset from IRC Ubuntu channel is analysed considering user-to-user communications with full text of messages and assessing emotion contents in the text. In addition to humans, the data contains a Web robot (bot), which serves predefined text messages upon users’ request. By mapping the data onto directed weighted network, and analyzing its topology in connection with temporal patterns of user actions, we find that a new type of techno-social structure emerges, which persists for a long time. We further analyze its architecture by testing the validity of the “social” hypothesis and study the percolation transition that is connected with the amount of emotional arousal on the links. Both the graph architecture and its social ties suggest that a specific type of online social network is assembled based on the emotion-carrying communications.
Data structure. We consider data from the publicly accessible IRC channel related to the development of the Ubuntu operating system http . The data contain both humans and a bot. Users, identified by IDs, typically exchange short text messages in seeking information on software or services, joining group discussions, or conducting open-domain chats. The data considered in this study are for one year period (year 2009), and contain texts of messages and time resolution of one minute. After retrieval of all the logs for a given time window, anonymization by substituting user IDs by random number references, and removing the spam, the utterances are annotated with appropriate sentiment detecting tools. In particular, in this study we use the lexicon-based annotation, by which emotion carrying words in a message are detected Bradley1999 . Such words carry emotional arousal—degree of reactivity, and valence—pleasure or displeasure, listed in the range in the emotional dictionary Bradley1999 , from which then the average arousal and valence are computed for the whole message. Moreover, the content of each message is determined according to one (or more) dialog act classes. In total, twelve such classes can be determined skowron_paltoglou2011affect . For instance, three classes that we consider here (yes-no question, why-question, statement), in common “question”-type messages, appear to be characteristic to a certain group of users.
II Self-Organized Dynamics of Chats and Network Evolution
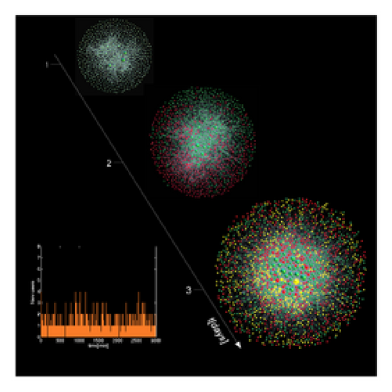
The data are filtered to identify unique user IDs (the ID labeled by “35177” belonging to the bot is treated equally). The subset where user-to-user communications are clearly identified is selected and mapped onto a directed network. The network nodes represent users and the directed link indicates that at least one message from user to user occurred within the considered time window. Multiple messages along the link increase its width, while the message emotion and message category are considered as properties of that link. Starting from the beginning of the dataset, the network evolves in time by addition of new users and new links and increasing the widths of the existing links. Fig. 1 shows how the network grows within first three days. After one year (data limit) the network consists of 85185 users with the link density and link reciprocity .
|
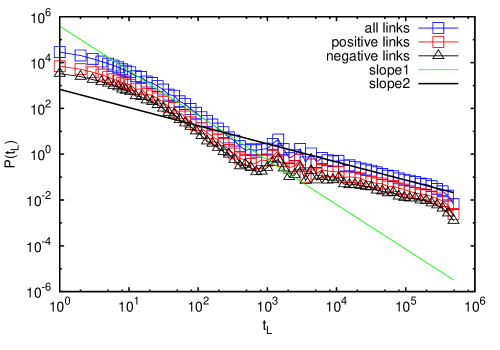
In the temporal patterns of user actions we noticed that some users appear for a short time and disappear from the channel, while others are constantly or occasionally active within a long time period. We examine the lifetime of links that the users establish between each other. The distribution of the lifetimes of all links in the dataset is shown in Fig. 2. The three curves are, respectively, for all kinds of links, and for the links that carry an overall positive and negative emotion valence. Apart from the frequency, the patterns are similar: For lifetimes shorter than one day, the distribution decays faster than for the lifetimes longer than one day. The power-law with a small exponent of the distribution in the latter region suggests that the links that survive the first day after the appearance are likely to persist for a longer time (till data limit). The network that contains only such persistent links, here termed the persistent network, or UbuNetP, is of our interest and can be considered as a potential social structure. Thus, we remove the links which do not survive over the first day after their appearance. Note that in this way a number of users are also removed. (The user survival distribution follows a similar pattern, not shown). In the following we explore the emergent network with the persistent links and study how the above mentioned link properties, in particular the message types and their emotion contents, are related with the network architecture.
|
|
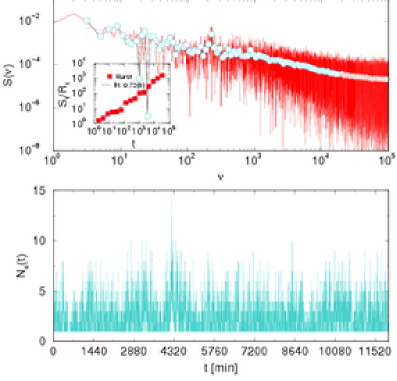
These network connections emerge through a self-organized dynamics, in which users play different functions and over time they “settle” in the evolving environment. The cooperative behavior is quantified by analysis of correlated fluctuations in the time series of user actions. Specifically, we construct the time series of the number of messages per one minute time bin. In Fig. 3 an example of the time series is shown in the bottom panel. For better view, only a small part corresponding to eight days is shown, while the length of the considered time series is bins. The power spectrum of the time series is given in the top panel in Fig. 3. The inset shows the fluctuations , scaled by the standard deviation , of the integrated time series as a function of varying time window . The slope determines the Hurst exponent . Apart from the peak corresponding to daily periodicity, the spectrum shows long-range correlations of the Gaussian noise type with in a wide range of frequency index , which is indicated by the straight line. The correlation range, considered in the time domain, agrees well with the persistence time window of the fluctuation, i.e., . Note also that the values of the exponents and satisfy (within error bars) the scaling relation expected for the colored noise signals. Furthermore, the value of the Hurst exponent suggests that a persistent type of fluctuations occurs in the system as a whole. T Note that the Hurst exponent in this range is also found for the time series of messages carrying emotional content along a particular link or by a particular user we-Chats12 ; garas2011 .
III Content-Based Structure and Resilience of the Social Graph
The network with persistent links is further examined as a “social” structure. We recall that “weak-ties” hypothesis has recently been confirmed in the data of mobile phone, online games, and MySpace dialogs networks onela2007 ; szell2010 ; ST12 ; we-MySpace11 . In analogy to the social networks, the test is performed by computing the overlap —the number of common neighbors of two nodes which share a link, as a function of the width and of the betweenness centrality of that link. In particular, the overlap increases with the intensity of communications between the nodes as , while it decreases with the centrality of the links as . Both laws hold in the above mentioned online systems, all of which have a typical community structure. The corresponding exponents are close to the universal values and , which are recently conjectured in ST12 .
|
|
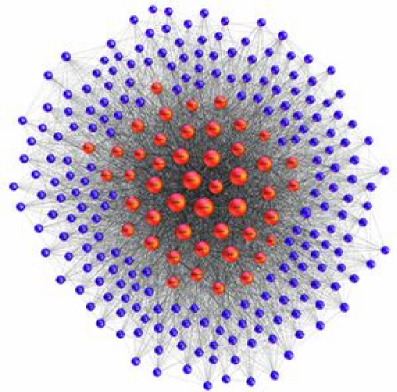
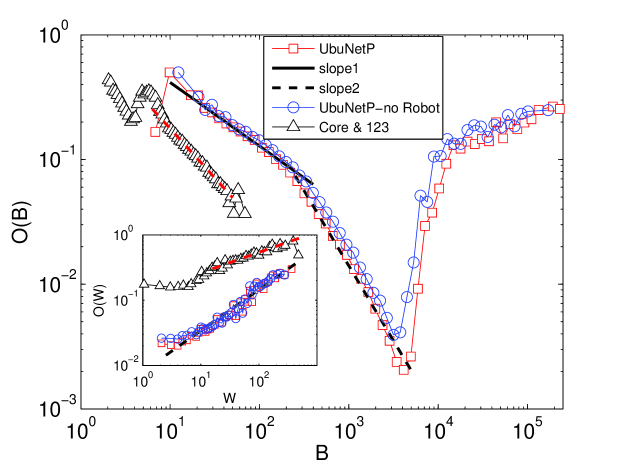
In the emergent networks of chats, the situation is somewhat different in that no classical community structure is found. Moreover, the network shows hierarchical organization of links with a large “core”, but the links between nodes at different hierarchy levels also occur. Thus the network remains connected even if the central core is removed comment . Consequently, we find that the overlap has a different dependence of betweenness centrality, as shown in Fig. 4. The inset shows the overlap as function of . The three curves are for our persistent network UbuNetP, and for two subnetworks described below. One subnetwork is obtained by removing the bot and all its links. The other is a reduced network shown in the top Fig. 4, whose structure reflects the type of messages that the users exchange: the outer layer (blue nodes) represents the users who send question-type of messages twice more often than the average frequency on the channel, and no other message types. They are attached to the central core (red nodes), which consists of the bot and the users who frequently use all types of messages. Qualitatively, the “social ties” behaviors are present, but the corresponding exponents are twice larger, and , except for a small parts of the curves (marked by the red dashed line), which agree with the other online social systems. The origin of such behavior as well as the sudden increase of the overlap at high values needs theoretical modeling and analysis of more similar systems, which is left out of the present work. It is interesting to note that qualitatively same behavior is found in the network from which the bot is removed.

|
The chat network has a structure with a power-law distribution for in- and out-degree with a similar exponent and disassortative mixing. A detailed analysis is left for a separate study we-Chats12 . Hereafter we focus on the resilience of the persistent chats network by analyzing the percolation transition that occurs in relation to the arousal of the messages carried along the directed links. The rationale is that the links persist over a long time due to certain attribute (or “excitement”, properly quantified by the emotional arousal) of the messages exchanged along them. It is worth noting that the weights and the averaged arousal of the links obey a power-law and a skewed Gaussian distribution, respectively we-Chats12 . Starting from the whole persistent network (with users and links) we cut the directed links whose average arousal exceeds a threshold value, i.e., . For convenience it is normalized by , the largest average arousal found on the network. Note that, depending on the actual value of the threshold , the number of links that satisfy the condition as well as their position on the network can vary considerably. Together with the network topology, directedness, and reciprocity of the links, this fact of the content-based topology determines the features of the percolation transition boguna2005 . For each threshold the largest cluster (as weakly connected component) is found and its size is plotted against the threshold in Fig. 5. Also shown is the susceptibility , which is defined as . It determines the fluctuations of the cluster size in response to cutting the links with a given arousal. The distribution of cluster size satisfies the power law . In agreement with the percolation theory, exhibits a peak at the transition point , where the tends to vanish.
What kind of geometry and/or complexity change dorogovtsev2008 ; schwartz2002 ; boguna2005 ; neelima2011 in the network structure occurs at the transition point ? We examine the fraction of retained links , and the average degree of the giant cluster, for the range of values of above the transition point. In the inset of Fig. 5 we show the scaling region , where the index indicates . The critical value and . The exponent is close to one, i.e., , , for , respectively.
IV Conclusion
Applying physics methods we have studied the self-organized dynamics of user-to-user interactions in the online chats, and have shown that both the type of the messages and their emotional arousal play an essential role in building a persistent techno-social structure. The social graph is hierarchically organized having a central core with some very active users and the Web bot. In contrast to more familiar user grouping into communities, this kind of spontaneous organization marks a new class of structures in the zoo of emergent online communication networks. The observed percolation transition on this graph is smooth with the enhanced fluctuations in response to a targeted deletion of links which carry the emotional arousal over a threshold value. Our analysis reveals that the contents of the exchanged messages and the role that users assume in the dynamics need to be considered as an integral parts of the topology in the online social graphs. In general, the idea to consider features beyond conventional interactions, that we pursued here for the analysis of human online interactions, can also be useful for studying physical systems which are assembled from complex molecules or other objects in laboratory.
Authors’ contributions: BT designed research, analyzed data and wrote the paper; VG contributed software and performed analysis; MS collected data and performed annotation of emotional contents.
Acknowledgments: We thank the support from the program P1-0044 by the Research agency of the Republic of Slovenia and from the European Community’s program FP7-ICT-2008-3 under grant no 231323.
References
- (1) C. Castellano, S. Fortunato, and V. Loreto. Reviews of Modern Physics, 81(2):591–646, 2009.
- (2) J. Kleinberg. The Convergence of Social and technological Networks. Communications of the ACM, 51:66–72, 2008.
- (3) M. Mitrović and B. Tadić. Emergence and structure of cybercommunities. in Handbook of Optimization in Complex Networks Theory and Applications , Eds. M.T. Thai and P. Pardalos, Springer ”Optimization and its Applications” , Vol.57, Part 2, pp. 209–227, DOI:10.1007/978-1-4614-0754-6-8 , January 2012, ISBN 978-0-19-953304-6
- (4) M. Šuvakov, M. Mitrović, V. Gligorijević, and B. Tadić. How the online social networks are used: Dialogs-based structure of MySpace, arXiv:1206.6588. 2012.
- (5) M. E. J. Newman. Phys. Rev. Lett., 89:208701, 2002.
- (6) S. Boccaletti, V. Latora, Y. Moreno, M. Chavez, and D.-U. Hwang. Physics Reports, 424:175–308, 2006.
- (7) J. Ugander, B. Karrer, L. Backstrom, and C. Marlow. arxiv:1111.4503v1, 2011.
- (8) M. Szell, R. Lambiotte, and S. Thurner. Proceedings of the National Academy of Sciences USA, 107(31):13636–13641, 2010.
- (9) M. Szell and S. Thurner. Social networks, 313–329.:313–329., 2010.
- (10) M. Mitrović, G. Paltoglou, and B. Tadić. Journal of Statistical Mechanics: Theory and Experiment, 2011(02):P02005+, February 2011.
- (11) A. Chmiel, P. Sobkowicz, J. Sienkiewicz, G. Paltoglou, K. Buckley, M. Thelwall, and J. Holyst. Physica A, 390:29362944, 2011.
- (12) http://www.ubuntu.com/support/community/chat
- (13) M. M. Bradley and P. J. Lang. Affective norms for English words (ANEW): Instruction manual and affective ratings. Technical report, The Center for Research in Psychophysiology, University of Florida., 1999.
- (14) M. Skowron, and G. Paltoglou. iIEEE Symposium Series on Computational Intelligence, 2011.
- (15) V. Gligorijević, M. Skowron, and B. Tadić. in preparation, 2012.
- (16) A. Garas, D. Garcia, M. Skowron, and F. Schweitzer. Scientific Reports, 6, 2012.
- (17) J. Onela, J. Saramaki, J. Hyvönen, G. Szabo, M. de Menezes, K. Kaski, A.-L. Barabási, and J. Kertesz. New Journal of Physics, 9(6):176, 2007.
- (18) Considered as an undirected graph, the size of -core is found to decreases as power . The strongest core is , which also contains the bot.
- (19) M. Boguna and M. A. Serrano. Phys. Rev. E, 72:016106, 2005.
- (20) S. N. Dorogovtsev, A. V. Goltsev, and J. F. F. Mendes. Rev. Mod. Phys., 80(4):1275–1335, Oct 2008.
- (21) N. Schwartz, R. Cohen, D. ben Avraham, A.-L. Barabasi, and S. Havlin. Phys. Rev. E, 66:015104(R), 2002.
- (22) A.D. Kachhvah and N. Gupte. Transmission of packets on a hierarchical network: Statistics and explosive percolation. CoRR, pages –1–1, arxiv:1108.2854, 2011.