The Unprecedented 2012 Outburst of SN 2009ip: A Luminous Blue Variable Star Becomes a True Supernova
Abstract
Some reports of supernova (SN) discoveries turn out not to be true core-collapse explosions. One such case was SN 2009ip, which was recognised to be the eruption of a luminous blue variable (LBV) star. This source had a massive (50–80 M⊙), hot progenitor star identified in pre-explosion data, it had documented evidence of pre-outburst variability, and it was subsequently discovered to have a second outburst in 2010. In 2012, the source entered its third known outburst. Initial spectra showed the same narrow-line profiles as before, suggesting another LBV-like eruption. We present new photometry and spectroscopy of SN 2009ip, indicating that the 2012 outburst transitioned into a genuine SN explosion. The most striking aspect of these data is that unlike any previous episodes, the spectrum developed Balmer lines with very broad P-Cygni profiles characteristic of normal Type II supernovae (SNe II), in addition to overlying narrow emission components. The emission lines exhibit unprecedented (for any known nonterminal LBV-like eruption) full width at half-maximum intensity values of km s-1, while the absorption components seen just before the main brightening had blue wings extending out to 13,000 km s-1. These velocities are typical of core-collapse SN explosions, but have never been associated with emission lines from a nonterminal LBV-like eruption. SN 2009ip is the first object to have both a known massive blue progenitor star and LBV-like eruptions with accompanying spectra observed a few years prior to becoming a SN. Immediately after the broad lines first appeared, the peak absolute magnitude of was fainter than that of normal SNe II. However, after a brief period of fading, the source quickly brightened again to mag in days, suggesting a causal link to the prior emergence of the broad-line spectrum. Once the bright phase began, the broad lines mostly disappeared, and the spectrum resembled the early optically thick phases of luminous SNe IIn. The source reached a peak brightness of mag about 2 weeks later, after which broad emission lines again developed in the spectrum as the source faded. We conclude that the most recent 2012 outburst of SN 2009ip was the result of a true core-collapse SN IIn that occurred when the progenitor star was in an LBV-like outburst phase, and where the SN was initially faint and then rapidly brightened due to interaction with circumstellar material. The pulsational pair instability, LBV-like eruptions, or other instabilities due to late nuclear burning phases in massive stars may have caused the multiple pre-SN eruptions.
keywords:
circumstellar matter — stars: evolution — stars: winds, outflows — supernovae: general — supernovae: individual (SN 2009ip)1 Introduction
Some very massive stars undergo sporadic luminous outbursts accompanied by episodic ejection of matter during their post-main-sequence evolution, in a few cases immediately before the final supernova (SN) explosion (e.g., Smith et al. 2008a, 2010a, 2010b; Smith & Owocki 2006; Gal-Yam & Leonard 2009). Strong evidence for this has been provided by observations of interacting supernovae (Type IIn/Ibn SNe), the spectra of which exhibit relatively narrow (narrow and “intermediate width”) emission lines that are generated by the interaction between the SN blast wave and dense circumstellar material (CSM) ejected by the stellar progenitor in the years to decades before the final explosion. Depending on the nature of the star, the CSM may be created via strong superwinds that last for millennia, in the case of extreme red supergiant progenitors (Smith et al. 2009), or by discrete outbursts that occur rapidly on month-to-year timescales (see Chugai et al. 2004; Chugai & Danziger 1994; Smith et al. 2010a, 2008a). The episodic outbursts are reminiscent of luminous blue variable (LBV) stars.
Several such events have been observed directly, including the historic eruption of Carinae in our own Galaxy during the mid-19th century (Smith & Frew 2011), as well as the more recently discovered extragalactic analogs, the so-called “SN impostors” (Van Dyk et al. 2000; Smith et al. 2011). These eruptive/explosive events can collectively liberate significantly more material than the total integrated mass lost via steady line-driven winds during the lifetime of a massive star (Smith & Owocki 2006), although the physical mechanism or trigger that causes the eruptions remains uncertain. The physics of this explosive mode of mass loss is poorly understood, and almost completely unaccounted for in current stellar evolution models.
Eruptive pre-SN mass loss from SN progenitors can be probed indirectly by observations of interacting SNe. In the extraordinary case of the Type Ibn SN 2006jc, a pre-SN outburst from the progenitor was observed directly, two years before core collapse (Pastorello et al. 2007). The precursor outburst, observed only photometrically, was believed to be the source of dense CSM emission and X-rays detected throughout the evolution of the SN spectrum (Pastorello et al. 2007; Foley et al. 2007; Smith et al. 2008b; Immler et al. 2008). Owing to the H-poor abundances of the CSM, the progenitor of SN 2006jc was believed to be a Wolf-Rayet (WR) star. Since WRs are not typically associated with luminous outbursts, the eruptive progenitor was suggested to have recently transitioned from the LBV phase into a WR (Foley et al. 2007). While LBVs provide the only known precedent for the eruptive pre-SN mass loss needed to make luminous SNe IIn (e.g., Smith et al. 2010a, 2008a), this suggestion has been controversial because it directly contradicts current expectations of standard stellar evolution models (Heger et al. 2003; Langer et al. 1994; Maeder & Meynet 2000).
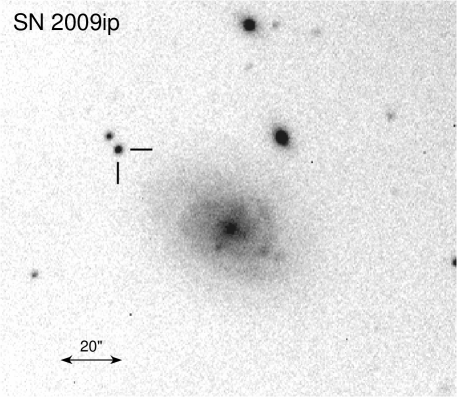
The SN impostor SN 2009ip, shown in Figure 1, provides a rare case where multiple outbursts were observed approximately one year apart (Smith et al. 2010b; Drake et al. 2010). Archival images from the Hubble Space Telescope (HST) revealed a luminous blue progenitor at the location of the transient, having photometry consistent with a stellar luminosity of log and an initial mass of 50–80 M⊙, indicating that the source is likely to be an LBV (Smith et al. 2010b). Subsequently, Foley et al. (2011) provided their own analysis of the same HST data and found a consistent result, indicating a progenitor with an initial mass above 60 M⊙. The first 2009 outburst was very brief compared to other LBV-like eruptions, lasting only a few days (Smith et al. 2010b), instead of a few months or more like most LBV eruptions (Smith et al. 2011). While narrow Lorentzian emission-line profiles indicated that most of the ejected mass was expanding at around 600 km s-1, higher speeds seen only in absorption suggested a small amount of ejecta moving at speeds up to km s-1 or more (Smith et al. 2010b; Foley et al. 2011). This provided an interesting likeness to Car, which also had a small fraction of its ejected mass moving at similarly high speeds (Smith 2008, 2012).
On 2012 July 24 (UT dates are used throughout this paper), SN 2009ip was discovered entering its third known outburst. The first calibrated photometric measurements on 2012 Aug. 14 revealed the source to have a brightness of mag (Drake et al. 2012). The earliest spectrum of the 2012 outburst was obtained on 2012 Aug. 24 (Foley et al. 2012); it exhibited narrow Balmer emission features similar to those observed during the previous outbursts, having Lorentzian profiles with full width at half-maximum intensity (FWHM) 640 km s-1.
| Date | |||
|---|---|---|---|
| (JD2,450,000) | (mag) | (mag) | (mag) |
| Aug. 28 (6167.83) | |||
| Sep. 05 (6175.81) | |||
| Sep. 08 (6178.81) | |||
| Sep. 10 (6180.79) | |||
| Sep. 18 (6188.78) | |||
| Sep. 20 (6190.81)c | ::: | ||
| Sep. 21 (6191.76) | |||
| Sep. 24 (6194.10)a | ::: | ::: | |
| Sep. 24 (6194.75)c | ::: | ||
| Sep. 24 (6194.69)b | ::: | ||
| Sep. 25 (6195.07)a | ::: | ::: | |
| Sep. 25 (6195.70)a | ::: | ::: | |
| Sep. 25 (6195.81)c | ::: | ||
| Sep. 26 (6196.02)a | ::: | ::: | |
| Sep. 26 (6196.76) | ::: | ||
| Sep. 29 (6199.76) | |||
| Sep. 30 (6200.60)c | ::: | ||
| Oct. 01 (6201.60)c | ::: | ||
| Oct. 03 (6203.71) | |||
| Oct. 07 (6207.72) | |||
| Oct. 09 (6209.55)c | ::: | ::: | |
| Oct. 11 (6211.72) | |||
| Oct. 14 (6214.60)c | ::: | ||
| Oct. 18 (6218.60)c | ::: | ::: | |
| Oct. 19 (6219.69) | |||
| Oct. 24 (6224.73) | |||
| Oct. 30 (6230.69) | |||
| Nov. 03 (6234.70) | |||
| Nov. 04 (6235.64) | |||
| Nov. 05 (6236.63) | |||
| Nov. 08 (6239.65) | |||
| Nov. 14 (6245.60) | |||
| Nov. 25 (6256.59) | |||
| Nov. 28 (6259.65) | |||
| Dec. 07 (6268.60) | |||
| Dec. 21 (6282.57) |
Here, we provide spectroscopic evidence that the latest outburst has actually developed extremely broad emission lines, consistent with those of a true core-collapse SN (Smith & Mauerhan 2012a), in addition to the narrow lines. Specifically, we report the emergence of strong P-Cygni profiles having broad emission components with FWHM 8000 km s-1 and absorption-wing velocities of 13,000 km s-1 and higher in some cases. The large widths measured for the broad emission components, which likely represent the bulk velocity of the outflow, are unprecedented for any known nonterminal LBV-like eruption, and were not seen in previous spectra of this same object. Although some broad absorption was visible during previous outbursts, this is the first time that broad emission has been detected, and it marks a significant and new qualitative change in the object.
While the new spectra of SN 2009ip look like those of a true core-collapse SN, the absolute magnitudes that were initially reported were less luminous than those of normal SNe, leading some to conclude prematurely that it is not a genuine SN (Margutti et al. 2012a; Martin et al. 2012). The initial peak absolute magnitude of 14.5 measured in the first week of September was, however, more luminous than that of some of the faintest known examples of core-collapse SNe II-P such as SN 1999br (Pastorello et al. 2004). The faintness and slow rise at early times could resemble some well-known SNe from blue supergiant progenitors that are initially faint, including SN 1987A (e.g., Arnett 1989, and references therein). The conclusion that it is not a core-collapse event appears to have been unjustified, because a few days later SN 2009ip began to brighten rapidly, reaching a luminosity consistent with a true SN after all (Brimacombe 2012; Margutti et al. 2012b; Smith & Mauerhan 2012b). In this paper, we present both new spectra and new photometry of the most recent outburst of SN 2009ip, and we discuss the interesting implications of this unprecedented event.
2 Observations and Results
2.1 Photometry
We began photometrically monitoring the 2012 outburst of SN 2009ip on Aug. 28 using the 1 m Nickel telescope and CCD imager at Lick Observatory. Measurements at 23 epochs through 2012 Dec. 21 were obtained with , , and filters. Images of SN 2009ip in the and bands were also obtained on 2012 Sep. 24 using the MONT4K imager on the Kuiper 61 in telescope on Mt. Bigelow in Tucson, Arizona. In addition, 8 epochs of , , and photometry were acquired between 2012 Sep. 20 and Oct. 18, using the 0.76 m Katzman Automatic Imaging Telescope (KAIT) at Lick Observatory (Filippenko et al. 2001).
Photometric measurements were extracted using standard aperture-photometry techniques and were calibrated using photometry of 4–5 field stars in the same image as the SN. For calibration purposes, we used magnitudes from the American Association of Variable Star Observers (AAVSO) Photometric All-Sky Survey (APASS111http://www.aavso.org/apass). Initially, we had used photometry from the USNO-B1 catalog for calibration, which led to imprecise results, especially for the band. We subsequently became aware of the availability and superior quality of APASS photometry (Brimacombe 2012; Prieto et al. 2012), and thus used this for our calibration. We also performed point-spread function (PSF) fitting photometry of SN 2009ip and surrounding fields stars using the IDL-based code Starfinder. The results from both techniques are fully consistent, well within the uncertainties.
Table 1 lists our Lick/Nickel, Kuiper/MONT4K, and KAIT photometry of SN 2009ip, and also includes -band measurements reported by Brimacombe (2012). Our and photometry was derived by converting the and APASS values (Sloan system) to the Johnson system, following Lupton (2005)222http://www.sdss.org/dr5/algorithms/sdssUBVRITransform.html. Absolute magnitudes were derived adopting a distance modulus of 31.55 mag for the host galaxy NGC 725 and an extinction value of mag (Smith et al. 2010b), which was converted to and following Cardelli, Clayton, & Mathis (1989).
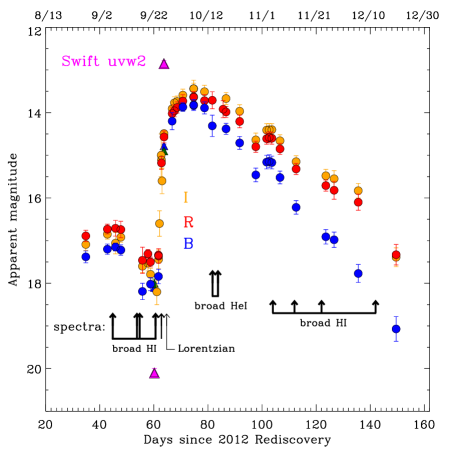
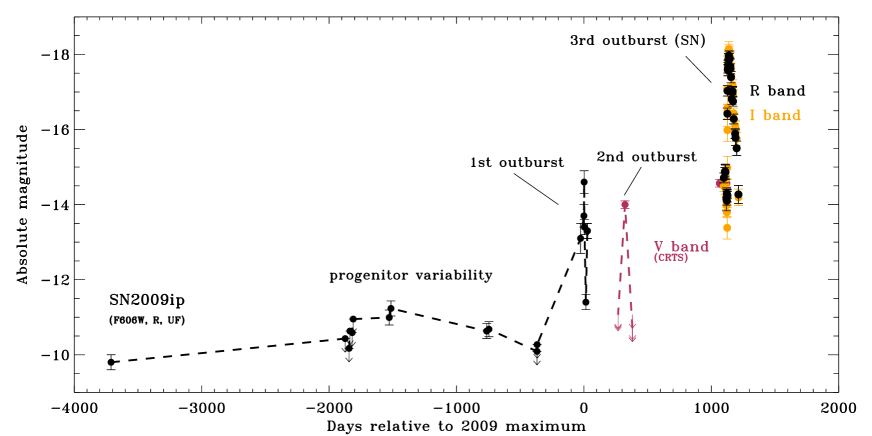
The new light curve of SN 2009ip is shown in Figure 2, which also contains several measurements from recent reports, including space-based UV photometry from Swift in the uvw2 band (Margutti et al. 2012a,b) having a central wavelength of 1928 Å. The complete absolute magnitude light curve is shown in Figure 3, which also includes the photometry originally presented by Smith et al. (2010b), and measurements of the second 2010 outburst from the Catalina Real-time Transient Survey (CRTS333http://nesssi.cacr.caltech.edu/catalina/current.html.) 0.5 m Schmidt telescope, which is part of the Siding Spring Survey (SSS).
The early photometry revealed a luminous and highly variable progenitor star at the location of the transient (Smith et al. 2010b) during the years leading up to the first observed outburst in 2009. We recently noticed that the progenitor star was detected in photographic plates from the second epoch of the southern plate survey (USNO-A2, not shown here) and appears to have been active on 1996 Aug. 14, which is earlier than previous studies have recognised. At this early stage the progenitor appears to have a very approximate brightness of –19 mag ( mag), comparable to magnitudes reached during the pre-outburst variability phase marked in Figure 3.
During the first outburst in 2009, the source brightened to an absolute magnitude of mag and faded on a relatively rapid timescale of several days (Smith et al. 2010b). After a quiescent period of year, a second outburst occurred, achieving a comparable luminosity and fading on a similarly rapid timescale. Nearly 2 years later, the latest outburst occurred, first detected on 2012 July 24, although calibrated photometry was apparently not publicly available at that time. Subsequent photometry on 2012 Aug. 14 revealed an absolute magnitude of . Approximately one month later, SN 2009ip appeared to fade by mag over a time span of 10 days (Figure 2). However, on Sep. 25, a large (–4 mag) increase in brightness began to develop rapidly in the optical bands, accompanied by an even bigger ( mag) increase in the UV bands (Brimacombe 2012; Margutti et al. 2012a,b). By 2012 Oct. 7, SN 2009ip had brightened and reached a plateau at mag, which implies a peak luminosity of . The source subsequently began to decline and became gradually redder in color. However, beginning Nov. 3 there was a small temporary brightness increase lasting for several days before the decline resumed and continued through Dec. 21, with a slight but apparent change in the decline rate between Nov. 25 and Dec. 21.
2.2 Spectroscopic Observations
Spectra of SN 2009ip were obtained at multiple facilities throughout the 2012 outburst. On Sep. 16, 17, 27, and Dec. 14, spectra were acquired with the 2.3 m Bok Telescope on Kitt Peak with the Boller & Chivens (B&C) Spectrograph. We utilised the 400 l mm-1 and 1200 l mm-1 gratings, which provided respective spectroscopic resolutions () of and through a 15 wide slit. The lower-resolution spectrum was obtained from four separate integrations of 900 s each, and the higher-resolution spectrum from six exposures of 1200 s each. The low declination of SN 2009ip (near ) limited our observations to be performed through a high airmass of –2.6. Observing with the slit at the parallactic angle (Filippenko 1982) was thus critical to avoid relative loss of blue light owing to atmospheric dispersion. Flat-field and wavelength calibration were performed using spectra of continuum and He-Ne-Ar emission sources internal to the instruments. Flux calibration was provided by observations of the A0V standard star HR 7596, with the difference in airmass between calibration and science observations taken into account. Data reduction and calibration were performed using standard IRAF444IRAF: The Image Reduction and Analysis Facility is distributed by the National Optical Astronomy Observatory, which is operated by the Association of Universities for Research in Astronomy (AURA) under cooperative agreement with the National Science Foundation (NSF). routines. For all spectra presented in this paper, the wavelength scale was corrected for the redshift of the host galaxy NGC 7259 ().
Spectra were also obtained on 2012 Sep. 23 using the Keck-II 10 m telescope and the Deep Imaging Multi-Object Spectrograph (DEIMOS; Faber et al. 2003). We utilised the 1200 l mm-1 grating and the 08 slit, which provided a spectral resolution of . Flat-field and wavelength calibration were performed using internal continuum and arc lamps, and flux calibration was derived from spectral measurements of the standard star BD17∘4708.
Low-resolution CCD spectra of SN 2009ip were obtained on 2012 Sep. 7 and 25, Oct. 5 and 6, and Nov. 6 and 14, using the Kast spectrograph (Miller & Stone 1993) on the 3 m Shane reflector at Lick Observatory. For our typical setup, we observed with a 300/7500 grating on the red side, a 600/4310 grism on the blue side, a D55 dichroic (giving a crossover wavelength Å), and a wide slit. The typical wavelength coverage is 3300–10,400 Å with resolutions of and Å on the red and blue sides, respectively.
Additional low-resolution spectra were obtained on 2012 Oct. 16 and Nov. 23 with the Bluechannel spectrograph on the Multiple Mirror Telescope (MMT), utilising the 300 l mm-1 grating and a 15 slit.
We also include some previously unpublished older spectra of SN 2009ip, obtained during or between previous eruptions. Spectra of the prior 2010 outburst were acquired on 2010 Nov. 5 using the Low-resolution Imaging Spectrograph (LRIS; Oke et al. 1995) on the Keck-1 10 m telescope, and a spectrum of SN 2009ip was obtained in between the 2010 and 2012 events on 2011 June 26, also using MMT and the Bluechannel spectrograph. The data reduction for these observations followed standard techniques as described previously by Silverman et al. (2012). Only the Lick/Kast spectra have been corrected for telluric absorption.
2.3 Overview of the Spectra


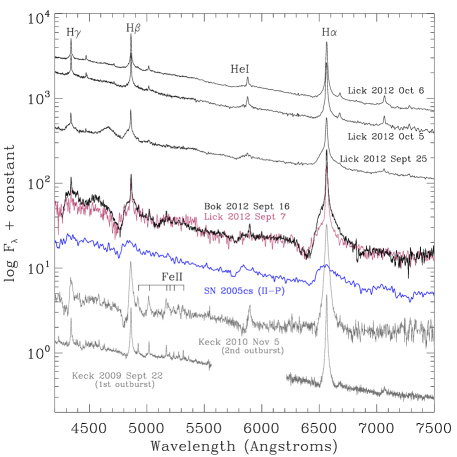
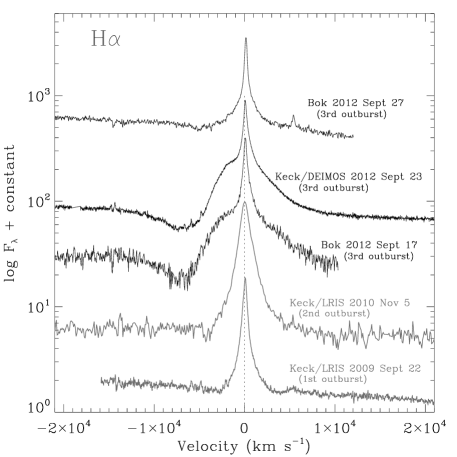
The spectra of SN 2009ip during the 2012 event are presented in Figures 4–7. On Sep. 16 and 17, the source is dominated by hydrogen Balmer emission lines that exhibit a combination of (a) strong intermediate-width components having FWHM velocities of km s-1 plus (b) broad P-Cygni features having FWHM 8000 km s-1 and blue absorption edges that indicate very high expansion speeds of up to 13,000 km s-1. Weak He i 5876 also appears to be detected, exhibiting the same combination of intermediate-width emission and a broad, but weak, P-Cygni profile; however, Na I might also contribute to this feature. Weak emission lines of Fe ii also appear redward of H.
The intermediate-width emission-line component during the most recent outburst appears similar in morphology to those observed during prior outbursts of SN 2009ip (Smith et al. 2010b; Foley et al. 2011). On 2009 Sep. 22, this component exhibited FWHM 550 km s-1 (Smith et al. 2010b), and on 2010 Nov. 5 it had FWHM 1200 km s-1. However, the underlying broad P-Cygni profiles during the latest outburst have not been observed at any time during the prior outbursts, and have also never before been observed from any other purported LBV eruption (Smith et al. 2011). Although evidence for material as fast as 5000 km s-1 was seen in the absorption components of the P-Cygni profiles of SN 2009ip’s prior eruption in 2009 (Smith et al. 2010b; Foley et al. 2011), velocities this high have never been seen in the main emission components. Instead, the large velocity widths of the emission lines observed from SN 2009ip in 2012 appear very similar to those of SNe II-P, such as SN 2005cs (Pastorello et al. 2006), which is shown in Figure 4 [data obtained from Weizmann Interactive Supernova Data Repository (Yaron & Gal-Yam 2012)]
By Sep. 25, the broad-line components began to weaken as the continuum strengthened. The slope of the continuum at wavelengths between 5500 and 7500 Å appears more or less consistent with an effective temperature of K, and this is also true for the spectra on Sep. 7–17. By Sep. 27, as the source had experienced a large increase in brightness during which the broad-line components mostly disappeared, the spectrum became dominated by broad-winged Lorentzian profiles of Balmer emission, more closely resembling the spectra of normal SNe IIn. The spectrum from 2 days earlier on 2012 Sep. 25 appears to have a morphology that is intermediate between the previous broad-line spectrum from Sep. 16 and the Lorentzian spectrum on Sep. 27.
The spectrum obtained on 2012 Oct. 16, after the source had peaked and began to decline, reveals another dramatic change in morphology, shown in Figure 6. He i emission becomes very strong at this stage, exhibiting a superposition of very broad P-Cygni emission features and narrow lines. The FWHM of the main broad He i 5876 emission components is km s-1, the same as the earlier Balmer profiles. However, the blue edge of the He i 5876 absorption component appears to extend to even higher velocities, perhaps as high as 20,000 km s-1, although we must consider the possibility that Na i is contributing to the absorption and/or emission components of this feature as well. The narrow component of the He i 5876 line exhibits a P-Cygni profile, with an absorption minimum at a velocity of km s-1.

By Nov. 6, and continuing through Dec. 14, our Lick, MMT, and Bok spectra (Figure 7) once again show the broad H P-Cygni emission that we observed on Sep. 7–17, and which had disappeared in the interim. The width of the broad components appears slightly smaller than before, having FWHM –6000 km s-1. On Nov. 6, however, the narrow component of the H emission exhibits a P-Cygni profile as well, having an absorption minimum near km s-1; it diminished in later spectra, however. By Nov. 14, broad P-Cygni emission from the Ca ii triplet begins to emerge near 8600 Å and strengthens substantially by Nov. 24, which is our most recent spectrum. Although fringing and telluric absorption in the spectrum from Nov. 24 are significant at wavelengths redward of H, the detection of Ca ii is nonetheless secure. Also appearing on Nov. 24 is a deep double-absorption profile at the location of Na i/He i, in the range 5600–5800 Å. The redder component was weakly detected earlier, on Nov. 6 and 14, but becomes the deepest absorption feature by Nov. 24, and continues to grow in strength through our latest spectrum on Dec. 14. It is difficult to ascertain confidently whether this redder absorption component is the result of Na i or He i. However, the fact that the broad He i features that were seen previously (Figure 6) have mostly diminished suggests that this feature is likely dominated by Na i. The strengthening of broad Ca ii P-Cygni emission at the same time might also support this interpretation, as both Ca ii and Na i are metal lines that typically signify inner-ejecta emission.
Finally, Figure 8 shows a much earlier spectrum of SN 2009ip obtained on 2011 June 26, between the 2010 and 2012 outbursts. Although a factor of weaker in flux, the morphology of the line appears similar to that of the 2010 outburst from months earlier (also shown). No continuum flux was detected in the 2011 spectrum, only intermediate-width H emission. Although we refer to the 2011 spectrum as “quiescent” because the source was significantly fainter, we are not suggesting that the progenitor was completely inactive at this time.
3 Discussion
3.1 The Remarkable Sequence of Events in 2012
The earliest reports on the spectrum of SN 2009ip for the 2012 outburst (Foley et al. 2012) stated that it was apparently consistent with previous LBV-like outbursts of the same object (Smith et al. 2010b; Foley et al. 2011). However, this situation soon changed. A few weeks later, we observed the emergence of the broad-line spectra that signaled the onset of the SN explosion (Smith & Mauerhan 2012a). The broad emission components are quite significant — the FWHM of 8000 km s-1 for the broad emission lines implies that a substantial fraction of the outflowing mass has achieved these high velocities, which is beyond the capabilities of any nonterminal super-Eddington wind-driven mechanism (Owocki et al. 2004). No other known SN impostor has ever exhibited such high bulk ejecta speed. Typically, impostors exhibit much slower outflow speeds of 300–1000 km s-1 (Smith et al. 2011). The highest-velocity material detected outside Car’s Homunculus nebula only reaches km s-1 (Smith 2008). It is important to note, however, that the fastest material in Car traces only a tiny fraction of the outflowing mass (less than 1%; Smith 2008), most of which expands at a much slower speed of km s-1. Emission from the fastest material would not dominate the shape of Balmer emission-line profiles in the optical spectrum, as seen during the 2012 outburst of SN 2009ip, even before the source brightened to normal SN luminosity.
Therefore, the appearance of broad spectral features, particularly the broad emission, signals the direct transition of SN 2009ip from an LBV-like eruption into a true core-collapse SN IIn. This hypothesis is further supported by the similarities between the broad spectral components of SN 2009ip and those of other SNe II-P, such as SN 2005cs, illustrated in Figure 4. In this interpretation, the broad spectral components of SN 2009ip probably represent the photosphere within the rapidly expanding SN ejecta that is seen through the CSM, while the narrow emission components could be generated by interaction of the fastest SN ejecta with the CSM ejected during the prior eruptions over the past few years, or ionisation of the CSM by the SN. SN 2009ip thus joins SN 2006jc as the second example of a massive star that was actually observed to undergo a luminous outburst immediately before core collapse. The fact that both objects exhibit narrow lines from dense CSM provides strong support for the conjecture that the CSM of SNe IIn can be produced by eruptive precursor events. SN 2009ip would have significant added importance, however, since the first outburst was studied in detail, including high-quality spectra (Smith et al. 2010b; Foley et al. 2011), and a luminous blue progenitor star was detected in archival HST images (Smith et al. 2010b).
Following our initial announcement of high velocities in SN 2009ip (Smith & Mauerhan 2012a), two preliminary reports presented optical photometry which was interpreted as indicating that the most recent outburst of SN 2009ip was not a true SN (Margutti et al. 2012a; Martin & O’Brien 2012). It was claimed that the peak absolute magnitude of around 14.5 mag ruled out a core-collapse event. This conclusion now seems premature, however, since SN 2009ip then rapidly rebrightened to luminosities consistent with a core-collapse explosion after all, eventually reaching a peak absolute magnitude of 18. As shown by our light curve in Figure 2, the initial outburst reported in July 2012 was evidently a 50–60 day precursor event that was interrupted by a SN explosion.
3.2 The Nature of the First 2012 Outburst
In this section, we focus on the nature of the immediate precursor outburst in 2012 (before the jump in brightness days after the July 24 rediscovery), and we discuss physical scenarios that could potentially explain SN 2009ip’s behaviour at this early stage.
While an absolute magnitude of around 14.5 mag during this phase did indeed indicate that SN 2009ip was fainter than normal core-collapse SNe, there is a class of faint SNe II-P with comparably faint luminosities (Pastorello et al. 2007). The least luminous of these faint SNe II-P is SN 1999br, which has a peak of roughly 14.2 mag, slightly fainter than the initial 2012 outburst of SN 2009ip. Relatively low initial luminosities and slow rise times have also been observed during the early phases other SNe. Such behaviour was observed from SN 1987A, and was explained as the result of an explosion from a blue progenitor with a relatively compact stellar radius (Arnett 1989, and references therein). In an explosion of a compact massive progenitor, the SN might be faint initially due to adiabatic losses. Ruling out a core-collapse event altogether for the precursor outburst of SN 2009ip, based simply on brightness at early times, is not easily justifiable.
A relatively faint transient might also result from a weak or “failed” SN, whereby the collapsing core forms a black hole. In such a scenario, the absence of neutrinos leads to a weak explosion that is unable to completely explode the star, and so most of the 56Ni and much of the star’s core falls back into the black hole (Heger et al. 2003). This is expected to produce a transient source that is fainter than a normal core-collapse event. Fryer et al. (2009) predict that such events should have peak magnitudes in the range to mag, comparable to what has been measured for the first 2012 outburst of SN 2009ip. With some asymmetry in the explosion mechanism, this may provide a means to accelerate a small fraction of the mass in the star’s envelope to very high speeds. However, given the subsequent sharp rise to very high luminosities shortly after broad lines were seen, this scenario seems unlikely for SN 2009ip.
A much more likely interpretation is that the 2012 precursor outburst of SN 2009ip was the result of yet another eruptive phase similar to its previous outbursts, which in this case occurred immediately before core collapse. The maximum of mag achieved just prior to the large jump in brightness around Sep. 25 is typical of the peak luminosities of suspected SN impostors (see Smith et al. 2011, and references therein), and is the same as the previous LBV-like outbursts of SN 2009ip itself. This could explain why the SN was initially so faint, as the mass outflow from the preceding nonterminal outburst(s) could have partially obscured the SN temporarily.
Indeed, there may be theoretical reasons to suspect a nonterminal stellar outburst immediately before core collapse. For example, since the quiescent progenitor was thought to be a very massive star of 50–80 M⊙ (Smith et al. 2010b), it is close to the regime where the pulsational pair instability could occur (Heger & Woosley 2002; Heger et al. 2003; Chatzopolous & Wheeler 2012). The instability could give rise to repeated, explosive bouts of oxygen burning, following by eruptive mass ejections during the few years preceding core collapse. Smith et al. (2010a) noted that the variations of the pulsational pair instability are essentially indistinguishable (observationally) from the properties of giant LBV-like eruptions. Alternatively, explosive nuclear flashes associated with oxygen or silicon burning can potentially occur near the time of core collapse (Woosley et al. 1973; Smith et al. 2011), perhaps driven by fluctuations in turbulent kinetic energy (Arnett & Meakin 2011). Wave-driven mass loss associated with those late nuclear burning phases could also be important (Quataert & Shiode 2012).
Whatever the cause of the 2012 precursor outburst during July/August, the onset of very broad line emission by 2012 Sep. 7–17 signals that a clear change in the star had occurred before the subsequent jump in brightness near Sep. 25. If SN 2009ip had not yet become a SN by the time the broad-line emission spectrum appeared, then the event would be even more difficult to understand, since we would need to invoke some nonterminal mechanism that is capable of accelerating the bulk of the stellar envelope to speeds in excess of 8000 km s-1, and up to 20,000 km s-1 (see Figure 6), far in excess of the escape velocity from the star’s surface – but without causing the star to brighten yet. It seems more likely that the appearance time of broad-line emission marks the initial stages of a terminal SN explosion, to which the subsequent jump in brightness is causally linked.
3.3 The Nature of the Second 2012 Outburst
Beginning near 2012 Sep. 25, SN 2009ip underwent another dramatic increase in brightness (Brimacombe 2012), rapidly reaching much higher luminosities, eventually peaking at mag in the band ( mag; ). During the rise, the broad Balmer lines in the spectrum diminished, and they changed into narrower Lorentzian profiles (Smith & Mauerhan 2012b; Figures 4 and 5). This spectral morphology resembles the early-time spectra of other luminous SNe IIn, such as SN 2006gy, SN 2006tf, SN 1994W, and SN 2011ht, all of which exhibited broad-winged Lorentzian profiles during their early phases as a result of electron scattering in the dense SN-CSM interaction zone, while masking the broad lines from the underlying fast SN ejecta (Smith et al. 2010a, 2008a; Chugai et al. 2004; Mauerhan et al. 2012). Strong SN-CSM interaction is often accompanied by the formation of an opaque, cool dense shell (CDS) that forms in the post-shock medium, and this would explain the almost complete extinguishing of the broad-lined component in the spectra, as the inner high-velocity ejecta would be masked by an opaque shell.
The detection of the broad Balmer lines immediately preceding the rapid increase in brightness on Sep. 25 suggests a causal link between this event and the precursor outburst, such that the SN had actually begun before the dramatic brightness jump shown in Figure 2. We therefore favour the interpretation that the SN explosion had begun by the time we first detected the emergence of broad-line emission spectrum on 2012 Sep. 7, and perhaps even earlier. This was well after the onset of the precursor LBV-like eruption. In this picture, the subsequent brightness jump on Sep. 25 is dominated by the onset of intense CSM interaction, as the fast ejecta from an already-occurring SN caught up to the slower material ejected during previous outbursts. It is interesting to note that the difference in expansion velocities between the previous LBV-like outbursts (600–1000 km s-1) and the most recent event (13,000 km s-1) would suggest a delay of 1–2 months for the fastest ejecta to begin overtaking the slower material, which would imply an approximate explosion date between Aug. 7 and near the time of discovery in mid-July. As reported by Foley et al. (2012), however, a spectrum taken on Aug. 26 apparently did not reveal the broad-line spectrum that we see emerging by Sep. 7 — but if another LBV-like outburst was taking place at the time of supernova explosion, as we have speculated, then it is possible that an optically thick outflow generated by that event could temporarily mask the high-velocity ejecta from the emerging SN.
The temporary appearance of very broad He i profiles by Oct. 16 (Figure 6), just after peak brightness, indicates a very dynamic interaction between the SN explosion and CSM. He i could have been excited as the radiation field from the shocked SN/CSM interface hardened temporarily, perhaps as a result of the SN ejecta encountering a slower shell of CSM or a gap between CSM shells. Indeed, the blue continuum becomes very strong at this stage (Figure 6). The hard UV and X-ray radiation from the interaction shock would also shine inward, exciting He i in the fast SN ejecta, thus explaining the broad components of the He i emission that we temporarily observe on Oct. 16. He i emission would then fade as the radiation field softened. The evolving collision between a SN and the CSM, which comprises mass outflows from multiple (at least three) previous ejections, is potentially quite complicated, and nonspherical geometry is probably important in the details of the brightness and spectral evolution. The small temporary luminosity increase that occurred after the light curve had begun to decline (near day 100 in Figure 2) potentially indicates the onset of interaction with another mass shell or density enhancement farther out in the CSM.
The nature of the strong double-absorption feature in the range 5600–5800 Å that develops strongly by Nov. 24 is puzzling. However, the development of strong broad Ca ii around the same time suggests that Na i is a potential contributor, as these are both signatures of metal-rich SN ejecta. The evolution of He i P-Cygni emission could also have a significant effect on the morphology of this absorption complex. In any case, we refrain from further detailed analysis of this feature at this time. Indeed, the interaction of SN ejecta with multiple shells of CSM, in adition to a potentially asymmetric geometrical configuration, will undoubtedly result in a complicated system of emission components from multiple zones of shocked CSM and SN ejecta, requiring more detailed analysis.
3.4 The Nature of the CSM and Prior Outbursts
Our ability to detect very broad lines just before the main brightening perhaps indicates that the CSM was partially transparent at first, compared with some other SNe IIn such as SN 1998S (Leonard et al. 2000), SN 2006gy (Smith et al 2007, 2010a; Ofek et al. 2007), SN 2006tf (Smith et al. 2008a), SN 1994W (Sollerman et al. 1998; Chugai et al. 2004), and SN 2011ht (Mauerhan et al. 2012). All of these SNe had dense CSM that was opaque to the observational signature of any inner high-velocity ejecta — but no SN IIn has ever been observed in the weeks before it brightened, because in all previous cases the SN was not discovered and monitored until it had already begun to brighten substantially.
Thus, we have no precedent for comparison with SN 2009ip. Perhaps many SNe IIn go through a very early phase when their CSM is transparent, before it is ionised by the CSM interaction and before the SN brightens. The early detection of broad lines could simply be due to the fact that we caught SN 2009ip remarkably close to the time of core collapse. This could also be the case if the ejections associated with the prior outbursts in 2009 and 2010 had a relatively low mass compared with the outflows of other SN impostors, or if the CSM had a small geometric covering factor due to a highly clumped CSM or highly nonspherical geometry (e.g., a disk or bipolar shell). If so, the progenitor could be an LBV-like star that underwent mass eruptions similar in scale to those of P-Cygni, which has a nebular mass of only M⊙ ejected over 10 yr (Smith & Hartigan 2006). This is in contrast with more massive LBV ejection nebulae, such as Car’s Homunculus or the Pistol nebula, both of which have masses of M⊙ (Smith et al. 2003; Figer et al. 1999).
We can use the kinematic information from our spectra combined with the observed luminosity to constrain the parameters of the CSM. The wind-density parameter, which is defined the ratio of the mass-loss rate () and the CSM velocity (), can be expressed as , where is the velocity of the SN ejecta and is the luminosity. Using the peak luminosity , and taking the FWHM of 8000 km s-1 of the broad H emission line as the average value of , implies a wind-density parameter of g cm-1. The absorption-trough minimum of the narrow H P-Cygni component from the Nov. 6 spectrum indicates that km s-1, implying a mass-loss “rate” on the order of yr-1 for the pre-SN outburst that created the CSM. These values are to be taken with caution, however. After all, the CSM around SN 2009ip is likely to be a complicated system, judging by the persistent and rather chaotic variations and outbursts that have been observed over the last decade. Upon close inspection, though, there does appear to be some evidence for a velocity gradient in the CSM. For the narrow He i 5876 component seen on Oct. 16, the km s-1 velocity of the absorption minimum in the P-Cygni profile is slightly lower than the value of km s-1 that we measured for the narrow H component on Nov. 6. Since the later spectrum traces material further out in the CSM, the observed velocity gradient may suggest Hubble-like expansion for the CSM, which we might expect for an LBV mass ejection (see, e.g., Smith et al. 2010a, where this was seen in the case of SN 2006gy).
There are a few plausible suggestions for the physical nature of the precursor variability during the past few years. The most likely scenario is that the 2009 and 2010 outbursts have the same underlying cause and mechanism as the 2012 precursor outburst. As noted above, possibilities include the pulsational pair instability mechanism or outbursts associated with late stages of nuclear burning. However, an important clue about the cause of SN 2009ip’s earlier 2009 and 2010 eruptions might be the short timescale over which they occurred. Those outbursts lasted for only a few days to weeks, which is distinct from the much longer lasting outbursts of most other SN impostors (see Smith et al. 2011, and references therein). Such short timescales suggest a dynamical mass ejection event, rather than a wind-driven event. The rapid fluctuations are similar to the variations observed from the highly variable and recurrent transient SN 2000ch (Pastorello et al. 2010).
The physical reasons for such rapid, large-amplitude variability are uncertain, but one possibility we might consider is the close periastron passages of a companion star in an eccentric binary system (Smith 2011). This might occur if a companion plunges into the bloated envelope of an LBV primary, the radius of which may be highly variable (the change in radius governs whether the violent interaction occurs). This was suggested by Smith (2011) as a potential explanation for Car’s brief brightening events in 1838 and 1843, both of which occurred within weeks of periastron encounters (Smith & Frew 2011). One would expect such encounters to form a very nonspherical distribution for the CSM (like a disk or torus), possibly helping to explain the variable transparency to emission from the inner high-velocity ejecta in SN 2009ip, as noted above. Whether such collisional events could help trigger core collapse, however, remains unknown.
Although the exact causes for the complex pre-SN evolution of SN 2009ip remain uncertain, the opportunity to spectroscopically observe such a unique object in the days before it became a SN was truly remarkable. Our observations provide dramatic confirmation of recent conjectures that suggest a link between LBV-like eruptions and the class of SNe IIn that are dominated by CSM interaction (Smith & Owocki 2006; Smith et al. 2010a, 2008a, 2007; Gal-Yam et al. 2007; Gal-Yam & Leonard 2009). Moreover, the explosion of SN 2009ip confirms that LBV stars can explode as SNe before becoming Wolf-Rayet stars, which previously was not expected from stellar models (e.g., Langer et al. 1994). The 2012 event is still underway at the time of writing, so the details of its late-time evolution should be followed closely.
Acknowledgments
We are grateful to the referee, Geoff Clayton, for a careful review of this manuscript. We thank Peter Milne for conducting the Kuiper/MONT4K photometric observations of SN 2009ip, as well as Byung Yun Choi, Ori Fox, Jenifer Gross, Patrick Kelly, Erin Leonard, Michelle Mason, and Frank J. D. Serduke for assistance with the Lick observations. Some of the data presented herein were obtained at the W. M. Keck Observatory, which is operated as a scientific partnership among the California Institute of Technology, the University of California, and NASA; the observatory was made possible by the generous financial support of the W. M. Keck Foundation. We are grateful to the staffs at the Lick (KAIT, Nickel, and Shane telescopes), Mt. Bigelow, MMT, Bok, and Keck Observatories for their assistance. This research was also made possible through the use of the AAVSO Photometric All-Sky Survey (APASS), funded by the Robert Martin Ayers Sciences Fund. The supernova research of A.V.F.’s group at U.C. Berkeley is supported by Gary & Cynthia Bengier, the Richard & Rhoda Goldman Fund, the Christopher R. Redlich Fund, the TABASGO Foundation, NSF grants AST-0908886 and AST-1211916, and NASA/HST grants AR-12126 and AR-12623 from the Space Telescope Science Institute (which is operated by Associated Universities for Research in Astronomy, Inc., under NASA contract NAS 5-26555). KAIT and its ongoing operation were made possible by donations from Sun Microsystems, Inc., the Hewlett-Packard Company, AutoScope Corporation, Lick Observatory, the NSF, the University of California, the Sylvia & Jim Katzman Foundation and the TABASGO Foundation. We dedicate this paper to the memory of Weidong Li, whose unfailing stewardship of KAIT and enthusiasm for supernova science were inspirational; we deeply miss his friendship and collaboration, which were tragically taken away from us much too early.
References
- Arnett et al. (1989) Arnett W. D., Bahcall J. N., Kirshner R. P., Woosley S. E. 1989, ARA&A, 27, 629
- Arnett & Meakin (2011) Arnett W. D., Meakin C. 2011, ApJ, 733, 78
- Brimacombe et al. (2012) Brimacombe J. 2012, The Astronomer’s Telegram, 4423, 1
- Cardelli et al. (1989) Cardelli J. A., Clayton G. C., Mathis J. S. 1989, ApJ, 345, 245
- Chatzopoulos & Wheeler (2012) Chatzopoulos, E., & Wheeler, J. C. 2012, ApJ, 760, 154
- Chugai et al. (2004) Chugai N. N., Blinnikov S. I., Cumming R. J., et al. 2004, MNRAS, 352, 1213
- Chugai & Danziger (1994) Chugai N. N., Danziger I. J. 1994, MNRAS, 268, 173
- Drake et al. (2012) Drake A. J., Howerton S., McNaught R., et al. 2012, The Astronomer’s Telegram, 4334, 1
- Drake et al. (2010) Drake A. J., Prieto J. L., Djorgovski S. G., et al. 2010, The Astronomer’s Telegram, 2897, 1
- Figer et al. (1999) Figer D. F., Morris M., Geballe T. R., et al. 1999, ApJ, 525, 759
- Filippenko (1982) Filippenko A. V. 1982, PASP, 94, 715
- Filippenko (1997) Filippenko A. V. 1997, ARAA, 35, 309
- Filippenko (2001) Filippenko A. V., Li W. D., Treffers R. R., Modjaz M. 2001, in Paczynski B., Chen W. P., Lemme C., eds., Small-Telescope Astronomy on Global Scales (San Francisco: Astron. Soc. Pac.), 121
- Foley et al. (2011) Foley R. J., Berger E., Fox O., et al. 2011, ApJ, 732, 32
- Foley et al. (2012) Foley R. J., Berger E., Roederer I. U., Chomiuk L. 2012, The Astronomer’s Telegram, 4338, 1
- Foley et al. (2007) Foley R. J., Smith N., Ganeshalingam M., et al. 2007, ApJL, 657, L105
- Fryer et al. (2009) Fryer C. L., Brown P. J., Bufano F., et al. 2009, ApJ, 707, 193
- Gal-Yam et al. (2007) Gal-Yam, A., Leonard, D. C., Fox, D. B., et al. 2007, ApJ, 656, 372
- Gal-Yam & Leonard (2009) Gal-Yam A., Leonard D. C. 2009, Nature, 458, 865
- Heger & Woosley (2002) Heger A., Woosley S. E. 2002, ApJ, 567, 532
- Heger et al. (2003) Heger A., Fryer C. L., Woosley S. E., Langer N., Hartmann D. H. 2003, ApJ, 591, 288
- Humphreys et al. (2012) Humphreys R. M., Davidson K., Jones T. J., et al. 2012, arXiv:1207.5755
- Immler et al. (2008) Immler S., Modjaz M., Landsman W., et al. 2008, ApJL, 674, L85
- (24) Langer N., et al. 1994, A&A, 290, 819
- Leonard et al. (2000) Leonard D. C., Filippenko A. V., Barth A. J., Matheson T. 2000, ApJ, 536, 239
- (26) Maeder A., Meynet G. 2000, A&A, 361, 159
- (27) Margutti R., Soderberg A., Chornock R., Foley R. 2012b, ATel, 4425, 1
- (28) Margutti R., Soderberg A., Milasavljevic D., 2012a, ATel, 4414, 1
- (29) Martin J. C, O’Brien J., Hubbell-Thomas J., 2012, ATel, 4416, 1
- Mauerhan et al. (2012) Mauerhan J. C., Smith N., Silverman J. M., et al. 2012, arXiv:1209.0821
- Miller & Stone (1993) Miller J. S., Stone R. P. S. 1993, Lick Obs. Tech. Rep. 66 (Santa Cruz: Lick Obs.)
- Ofek et al. (2007) Ofek, E. O., Cameron, P. B., Kasliwal, M. M., et al. 2007, ApJL, 659, L13
- Oke et al. (1995) Oke J. B., Cohen J. G., Carr M., et al. 1995, PASP, 107, 375
- Owocki et al. (2004) Owocki S. P., Gayley K. G., Shaviv N. J. 2004, ApJ, 616, 525
- Pastorello et al. (2010) Pastorello A., Botticella M. T., Trundle C., et al. 2010, MNRAS, 408, 181
- Pastorello et al. (2007) Pastorello A., Della Valle M., Smartt S. J., et al. 2007, Nature, 449,
- Pastorello et al. (2006) Pastorello A., Sauer D., Taubenberger S., et al. 2006, MNRAS, 370, 1752
- Pastorello et al. (2004) Pastorello A., Zampieri L., Turatto M., et al. 2004, MNRAS, 347, 74
- Prieto et al. (2012) Prieto J. L., Brimacombe J., Drake A. J., 2012, ATEL, 4439, 1
- Quataert & Shiode (2012) Quataert E., Shiode J. 2012, MNRAS, 423, L92
- Roming et al. (2012) Roming P. W. A., Pritchard T. A., Prieto J. L., et al. 2012, arXiv:1202.4840
- Silverman et al. (2012) Silverman J. M., Foley R. J., Filippenko A. V., et al. 2012, MNRAS, 425, 1789
- Smith (2006) Smith N. 2006, ApJ, 644, 1151
- Smith et al. (2007) Smith, N., Li, W., Foley, R. J., et al. 2007, ApJ, 666, 1116
- Smith (2008) Smith N. 2008, Nature, 455, 201
- Smith (2011) Smith N. 2011, MNRAS, 415, 2020
- Smith (2012) Smith N. 2012, arXiv:1209.6155
- Smith et al. (2008a) Smith N., Chornock R., Li W., et al. 2008a, ApJ, 686, 467
- Smith et al. (2010a) Smith N., Chornock R., Silverman J. M., Filippenko A. V., Foley R. J. 2010a, ApJ, 709, 856
- Smith et al. (2008b) Smith N., Foley R. J., Filippenko A. V. 2008b, ApJ, 680, 568
- Smith & Frew (2011) Smith N., Frew D. J. 2011, MNRAS, 415, 2009
- Smith et al. (2003) Smith N., Gehrz R. D., Hinz P. M., et al. 2003, AJ, 125, 1458
- Smith et al. (2009) Smith N., Hinkle K. H., Ryde N. 2009, AJ, 137, 3558
- (54) Smith N., Mauerhan J. 2012a, The Astronomer’s Telegram, 4412, 1
- (55) Smith N., Mauerhan J. 2012b, The Astronomer’s Telegram, 4427, 1
- Smith et al. (2010b) Smith N., Miller A., Li W., et al. 2010b, AJ, 139, 1451
- Smith & Owocki (2006) Smith N., Owocki S. P. 2006, ApJ, 645, L45
- Sollerman et al. (1998) Sollerman J., Cumming R. J., Lundqvist P. 1998, ApJ, 493, 933
- Van Dyk et al. (2000) Van Dyk S. D., Peng C. Y., King J. Y., et al. 2000, PASP, 112, 1532
- Van Dyk et al. (2005) Van Dyk S. D., Filippenko A. V., Chornock R., Li W., Challis P. M. 2005, PASP, 117, 553
- Woosley et al. (1973) Woosley S. E., Arnett W. D., Clayton D. D. 1973, ApJS, 26, 231
- Yaron & Gal-Yam (2012) Yaron O., Gal-Yam A. 2012, arXiv:1204.1891