22email: rbakhshi@few.vu.nl, ravindra.harige@student.vu.nl, steen@cs.vu.nl 33institutetext: Network Institute, VU University Amsterdam, The Netherlands
Scalable Analysis for Large Social Networks:
the data-aware mean-field approach
Abstract
Studies on social networks have proved that endogenous and exogenous factors influence dynamics. Two streams of modeling exist on explaining the dynamics of social networks: 1) models predicting links through network properties, and 2) models considering the effects of social attributes. In this interdisciplinary study we work to overcome a number of computational limitations within these current models. We employ a mean-field model which allows for the construction of a population-specific model informed from empirical research for predicting links from both network and social properties in large social networks.. The model is tested on a population of conference coauthorship behavior, considering a number of parameters from available Web data. We address how large social networks can be modeled preserving both network and social parameters. We prove that the mean-field model, using a data-aware approach, allows us to overcome computational burdens and thus scalability issues in modeling large social networks in terms of both network and social parameters. Additionally, we confirm that large social networks evolve through both network and social-selection decisions; asserting that the dynamics of networks cannot singly be studied from a single perspective but must consider effects of social parameters.
1 Introduction
Dynamics of social networks are receiving increasing attention in multiple research domains [1, 2, 3]. Theoretical developments posit that dynamics are influenced by network [4] and social processes [2]; with recent theory suggesting that the two co-evolve [1]. Methods to explore dynamics of networks traditionally implement evolving graph models, using inferential statistics to assert the likelihoods of the creation, maintenance or dissolution of edges. Two distinct classes of modeling exist: 1) exclusively modeling the effect of network structures on dynamics [5, 6], and 2) modeling effects of social parameters and network effects for small networks ( 1000 nodes) [2]. Both types of models prove that network processes affect the dynamics of networks. Network models have been able to accurately predict a small percentage of edges, suggesting that dynamics may also be fed by other processes. Social-parameter models have proved social attributes, in combination with network structures, play a role in network dynamics.
Despite this growing knowledge from both model classes, these models have limitations. The main limitation relates to using an evolving graph model which calculates statistical probabilities of individual nodes. This approach generally leads to a super-linear growth in computational load as the network size increases, partly caused by the quadratic growth in the number of links that need to be considered. Both models attempt to overcome this through different means. One is limited to either testing the effect of a few parameters on a large network, or a number of parameters on small networks. Consequently, neither provide a terrain to empirically confirm the effect of both network and social parameters in large social networks.
In order to better understand the dynamics of large social networks, a different computational approach must be taken to overcome the issue of scalability in present models. In this paper we review the two existing model classes used to investigate dynamic social networks, and present a model for overcoming a number of acknowledged limitations. Using a mean-field model approach we are able to overcome scalability issues in previous models through aggregation of individual nodes. Parameters are developed using a data-aware approach which combines empirical research from Social Science and standard inferential statistics to develop a population-specific model for exploring the dynamics of collaboration in science.
We consider the question whether mean-field modelling allows us to describe the behavior of a social system, considering a number of network and social parameters. In this first application of the mean-field model to large social networks, we aim to explain the effect of a set of parameters governing networking patterns of collaboration in Dutch Computer Science (CS). Four parameters are considered in this research: institutional affiliation, scientific age, cosmopolitanism of knowledge production, and visibility of the scientists. We prove that mean-field models expand the empirical testing ground of dynamic network models through increased scalability. This allows us to better understand dynamics of large social networks, covering space that has not been investigated in the past using a mean-field approach.
The paper is set up as follows. In Section 2 we review the state of social network models, specifically highlighting the limitations of present models. In Section 3 we explain the mean-field model, discussing in detail the computational advantages of the model as well as the steps taken to implement a data-aware approach for improved specifications. In Section 4, we test the model on the coauthorship networks of papers from the conference proceedings for Dutch computer scientists, collected from the DBLP data set for 2006 – 2010. Finally, we conclude with the results and implications for scalable, data-aware modeling solutions for explaining dynamics of social networks.
2 Network Models
The evolution of a network is driven by the addition, maintenance, and dissolution of interactions (edges) between nodes over time. Evolving graph models are the most commonly implemented models to explain the dynamics of networks [7, 8, 9]. These models assume that nodes are added one-by-one to the network, in discrete time. They infer the probability of a link emerging given a node-transition rate using a Markovian model of simulation. Within this model type two distinct approaches exist investigating social network dynamics: 1) global network-structure link-prediction models, and 2) social-parameter models integrating social factors into link prediction.
Models with pure network-structure prediction assumptions derive from the vast research on global network structures. Studies on network properties confirm that many real-world networks display small-world properties in which high node clustering is combined with short average internode distances [10, 7]. Networks have also been found to behave according to a power-law scale-free phenomenon where a relatively small number of nodes have numerous connections [11, 3, 12]. Additionally, networks have properties of clustering hierarchies [3], and tendencies of transitivity or “triangles of interaction” describing the manner in which ties between node and , and between node and facilitate a likely tie between and .
From this knowledge on network properties a second generation of studies emerged addressing how a social network can be modeled using properties intrinsic to the network. These global network-structure link-prediction models provide insight into not yet identified or observed linkages [13], as well as to infer not directly observed likely links [14, 15, 16]. Within these studies two approaches are taken to predict links: (1) computing node-level measures from greater network structures and, (2) meta-level analyses. In this study we consider only node-level measures (which are comparable to the gap we aim to fill in this research), while still maintaining the network structure.
Several approaches for predicting social network linkages have been proposed, for a complete list see [5]. Despite the extensive research of different measures used to model the network dynamics, all of these models suffer from low fitness, with random link prediction performing just as well as Katz’s model of path collection- predicting links by the sum of collected path lengths per individual [17]. This has led informaticians to explore the effects of additional parameters in understanding network dynamics. A second model type works to address the effect(s) of social parameters on the dynamics of social networks. The justification for these models arose from research on social networks which proved that social selection plays a key role in relation formation [18, 19, 20]. Models of this type allow us to question how a social network can be modeled using both network and social properties of nodes. These models also infer edges through evolving graph models but consider state spaces with both network and social parameters. Two model types are commonly used to investigate the inference of these dual parameters: stochastic actor models (SIENA) [2] and exponential random graph models (ERGM) [21].
The key distinction in these models, from the network-only models, is the combination of link prediction based on both local effects, as well as on “social circuits” that capture the influence of more distant ties on behavior [22]. This leads to an exponential growth of the state space due to the consideration of more parameters, requiring extensive computing power in prediction. Given the computational complexity of calculating this for every node these models are not easy to develop in a way that convergence emerges in large networks [22]. Consequently, these classes often limit the size of networks through a theoretical boundary of inferring statistics for a bounded network. This reduces the burden of having to perform computations on potentially very large graphs, but also effectively limits application to small networks ( 1000 nodes).
In summary, these two model classes provide a testing ground to explore dynamics, but are both not without limitations. Both network and social parameters have scalability problems. As we discuss next, in order to empirically explore the effect of both network and social parameters on large social network dynamics a scalable solution is required.
3 Modeling Framework
We propose a mean-field approach for studying social networks; (equally behaving) individual nodes are grouped according to their states. This approach is used for an optimized analysis of large-scale systems, allowing for a prediction of the average behavior of the system. The mean-field theory has been applied previously, e.g., to large-scale gossip systems in [23, 24, 25]. Concisely, the state of the system is represented by a distribution, or a vector of fractions of nodes in each state at time unit . The evolution of the stochastic system is governed by a so-called master equation of the form:
| (1) |
is the matrix, each entry of which is a transition probability from a state at time to state at time . Thus, we are effectively reducing the global state space, thereby increasing the computational efficiency of the model, and in turn, allowing us to consider more parameters as well as more nodes.
Moreover, we use the notion of classes, introduced in [24], to distinguish between equally behaving nodes affiliated to different categories. To this end, the mean-field model predicts average behavior of sets of nodes of each class given a number of social and network parameters. We highlight the modelling steps:
Forming a model
In order to model the network, first we need to define the system in the form of its parameters. This will form a state of the system. Given the type of network under study, the effects of system parameters are considered using either manual classification or statistical classification (e.g., [26]) to identify the set of significant parameters to form states and classes. For example, some parameter can be a theoretically informed organizational constraint (e.g. an organization, a background, etc).
Applying abstraction refinement
The theory underlying the mean-field model requires also the population of each state to be large enough to be approximated by the law of large numbers. The size of the population in a sampled data set may force one to consider further abstraction for the ranges of the parameters, thereby reducing the size of the system state space. For instance, if chosen parameters for the system are the number of papers per author and the number of an author’s coauthors , the number of possible states of the system will simply be a product . Some parameters can be restricted in their value ranges without loss of the accuracy of the model itself.
Computing the model input
To execute the model, input data is needed on the initial state of the system, as well as on distributions for networking behavior, which will be used for the matrix . The input distributions for the mean-field model include three categories: (1) communication, (2) idle, and (3) collision. Communication describes the interaction between nodes, and idle is a state of no interaction. Collision is the disappearance or decay of an interaction. The distributions of interaction (links, from a graph-theoretical perspective) are estimated for each class, which determines the nonuniform behavior by different classes for the model. We compute these distributions statistically from the sampled data set.
Estimation of distributions
The aforementioned transition probability distributions are determined using a discrete-time model to identify the optimal time slicing for the studied data set. Such a time slice corresponds to one time unit in the model. The distribution for probability of transition from one class to another one is also used in the master equation (1) (for a more detailed equation, cf. [24, Fig. 10]. The method used for estimation of the probability distributions is a Hidden Markov Model (HMM) [27].
Applying automated mean-field framework
Armed with the knowledge regarding states, classes and transition rates, obtained from the previous steps, we apply an automated mean-field framework to infer average behavior of the system. We repeat the earlier steps until all parameters are included for a time period covered by the data set. We use the resulting mean-field model to make average link predictions on the system given the parameters under consideration. The model provides a number of advantages over models discussed in Section 2, such as greater flexibility in modeling behavior of nodes through a number of processes. The use of HMMs provides an additional round of probability in node interactions, to compensate for the aggregation. Moreover, such a model allows us to consider both social parameters as well as network structures. Unlike simulation or deployed models, the model is flexible given a theoretical knowledge of the interactions under study. In analyzing the system under question we set the formal specifications which provide detailed processes of specification.
Considerations for extensions of social networks
The challenge in applying the mean-field model to social networks is to derive accurate predictions of the local behavior of the nodes within defined classes. Particularly, for social networks, model abstractions need to be done using a data-aware approach. A data-aware approach implies that both classes and parameters are informed through an intense, robust knowledge of the system under study, as well as the content of edges in the network data. It is a requirement that this is approachable through a theoretically or empirically grounded conceptual scheme on both the system under study and the mechanisms that inform the parameters considered in simulation models. Consequently, not all social networks and or systems can be analyzed using such an approach.
Additionally, we argue for an interdisciplinary approach in development of the model as data needs to be intensely explored to inform parameters by both a data engineer and validated by social scientists or informed experts of the system under study. This implies, unlike other models, that the data-aware approach is essential to determining accurate results, which can be compared in model-fit tests. This results in a model that specifically fits the needs of the system under study, and which can be adapted per population given the basic set of rules for abstraction we describe. In the next section we lay out the general steps for the application of a mean-field model.
4 Application
As discussed in the previous section a set of requirements are necessary for implementing a mean-field model to investigate the effect of social and network factors on network dynamics: network data, parameter data, and knowledge from empirical studies of the system under study. We explain the case studied here and detail the abstraction steps undertaken to model the effect of network and social parameters on network dynamics.
4.1 Network data
A majority of computational analyses of large social networks implement coauthor or similar co-occurrence networks to examine network dynamics [3]. Coauthorship networks, via publication data, provide a representation of a specific social interaction- successful collaboration, in producing an output- dissemination of knowledge through publication. Moreover, publication data is readily accessible on the Web providing large, reliable, and scalable data sets to model network dynamics.
In addition to the use of coauthorship data to study network dynamics, empirical studies on coauthorship provide a framework to develop measures to consider in the model testing. In science studies, coauthorship is a standard measure for collaboration in science. Collaboration is increasingly common in science; from the near disappearance of single-authored papers to the growth in prevalence of an increasing numbers of coauthors on academic publications [28]. A decade of studies on collaboration in science have proved the effect of different social variables on collaborative behavior of scientists [29, 30]. Recent studies have found that task types and a number of external factors influence collaborative behavior of scientific processes [31]. Both institutional and short geographical distances play a key role in the collaborative behavior of scientists [32, 33]. Given these studies we have a basis at which to both test informed parameters and link findings to knowledge on collaborative tendencies of scientists.
In this paper we explore a system of collaborative behavior of scientists in testing the mean-field model for large social networks. We select one nation and discipline – Dutch computer scientists, to investigate dynamics as to limit known exogenous effects of different knowledge production practices between disciplines and nations. Effectively, we comment only on the average behavior of the system of Dutch CS. The field of CS was chosen for three reasons: the traditions of the field with a diversity of subfields within the discipline; the known tendency for collaboration through coauthorship; the validity and reliability of online sources documenting publications. The Dutch context provides a diversity of cases at which to examine different institutional processes.
A source list of 434 tenured Dutch computer scientists in 2010 was acquired from the Nederlands Onderzoekdatabank, an official body that keeps records on research in the Netherlands. To identify a valid and reliable set of coauthorship data for the Dutch computer scientists a snapshot of DBLP DataBase was queried. (DBLP is one of the most comprehensive bibliographic indices for the field of CS.) Within this set the list of Dutch computer scientists was queried for all publications of scientists from 2006 - 2010 (the year of our list of tenured scientists). This list was manually cleaned to disambiguate names. From this list the name of the publication was queried to identify the unique author IDs of each author per publication. These unique author IDs were queried to pull full publication lists of each author (Dutch scientists and their coauthors).
Conference proceedings were selected for the case study as conferences in CS require at least one author to physically present work at a conference to be published. Conferences provide a good fit for the assumption of interaction in previous computer models as a potential meeting points for coauthors. Additionally, it provides a number of clear timestamps discerning possible transition periods, with most conferences occuring annualy, with regular cycles. Conference proceedings are denoted in this data set by the BibTeX entry @inproceedings, allowing us to further query for proceedings-only publications. This resulted in 3639 scientists, and 2757 conference-proceeding publications. Nodes represent individual scientists and links represent shared coauthorship of proceedings. From this data set of individual authors we also collect data on the social parameters.
4.2 Parameters
In this study we aim to include parameters that are informed from previous empirical studies in the field of science studies. Four parameters are considered in the model: scientific age, cosmopolitanism of knowledge production, visibility, and institutional affiliation. For the collection of social parameter data in this study the Web is used, providing a reliable method for collecting meta-data on scientists within publication records [34]. The use of Web data as the source of meta data is integral in this first model development as it reduces the burden of data collection of social variables (compared to traditional social science data of surveys or interviews). This allows us to quickly test the effect of social parameters on behavior with a considerable amount of reliability from merging meta-data from additional online databases.
The parameters – scientific age, cosmopolitanism of knowledge production, and visibility are calculated from within the DBLP data set. Scientific age was selected because tenure and rank are both said to play a role in collaborative behavior of scientists, with scientists of a higher tenure more likely to collaborate than mid-range, tenure-seeking colleagues [35]. We first noted publication per author in the DBLP data set for which we compute per year per author as his or her scientific age. A second parameter, cosmopolitanism, relates to the socio-technical acquired capabilities of scientists suggesting that access to potential coauthors in a field plays a key role in collaboration [29]. This parameter was measured through previous coauthorship experience. The number of coauthors per year per author is computed from the DBLP. The third parameter aims to comment on the visibility of the scientist. The visibility of the scientist is the likely popularity through publication magnitude. These three parameters allow us to consider a number of possible social factors that are not network effects but rather social attributes on the scientists’ networking behavior.
One additional parameter was collected for consideration in the model – the institution. Previous studies proved that the institution is statistically significant with respect to how scientists collaborate [32, 33, 31]. The institution is identified through a query of two databases. These data are considered static in this model, unlike the previously mentioned data, as we assume minimal change of institution in the five-year period under study. The automatic collection of historical data on institutional affiliation is not currently stored in one database, to our knowledge, thus we assume a five-year period as a valid period of time to accurately measure inference. A query using Microsoft Academic Search – a database which includes the DBLP data set is used to identify institutions. To locate additional missing data another database, ArnetMiner.org was used. The remaining unidentified institutions were queried manually giving us a total of 1358 identified institutions. In order to disambiguate institutional names, to have a reliable and valid set of data, this list was queried in geocoding Web service Yahoo! PlaceFinder [36]. This query provides a proximity measure for each institution and a uniform institutional affiliation based on common GPS coordinates.
These four parameters provide a setting to explore the application of the mean-field model in large social networks. The occupancy measure at time in our model is the fraction of people in state , where is a number of publications, is a number of coauthors, is scientific age, and is affiliation. We test the following social science hypothesis: institutions effect the patterns of collaborative behavior (by behavior we mean average number of coauthors, and average number of papers). In addition to these social parameters we also include the network parameter of transitivity. As discussed in section 1, social networks have tendencies of transitivity [3, 7]. We consider the social parameters in predicting the triadic interactions between nodes.
4.3 Classes abstraction
In principle, any of our parameters could be considered a class. When studying a social system, however, we need to consider known social and organizational constraints. In order to define a class we investigate the four possible parameters under consideration in this model. We first consider known effects.
Our system is already bounded by the selection of one national science structure and one scientific discipline. The effect of the institution provides a valid and logical boundary at which to explore aggregation. Additionally, we know that geographical location also plays a key role in collaboration, which we aim to consider in the abstraction. Consequently, we employ institutions as classes in our mean-field model, and as one of the parameters contributing to a state of a collaboration network. Due to limitation of the data-mining techniques to automatically extract full history of scientific employment, we assume that a scientist has one affiliation during the four year period.
The data set for our model consist of 3639 Dutch authors with 749 different institutions. However, the theory underlying our mean-field model requires that the population of each class should be large enough to be approximated by the law of large numbers. To this end, we applied an abstraction on classes (institutions) based on statistical metrics for the given distribution of computer scientists among institutions.
Since both our data set and results are focused on the system of Dutch computer scientists, we distinguish (1) institutions in the Netherlands, and (2) institutions in other countries. For each of these categories we estimate a statistical threshold of the significance of the institution. This threshold depends on the dispersion of the distribution of scientists sampled for each of the categories of institutions. If values are highly dispersed, then we set the threshold to be the average number of affiliated scientists.
To measure the statistical dispersion for the scientists’ distribution , we compute a sample covariance, which is the average distance to the mean value between any two values in the distribution . To allow for some dispersion, we compare the arithmetic mean for and its sample covariance: if the sample covariance for a subset is higher than the mean, then the values of the sampled are highly dispersed.
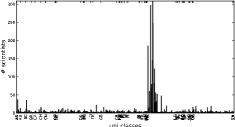
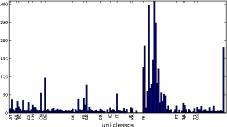
In addition to estimation of the significance threshold, this simple test is applied in two steps: (1) for the continental abstraction, and (2) the country-wide abstraction. In case 1, we sample data for all universities per continent (using the UN list of countries per continent and GPS coordinates). In the case of high dispersion in the number of scientists in institutions in one continent, we proceed to test the dispersion of the number of scientists affiliated with institutions in one country. We merge only those institutions that have a number of scientists below the mean of the entire distribution . The histogram in Fig. 1 shows the number of scientists in each class, before and after the classes abstraction. The number of classes has been reduced from an initial 749 to 157, effectively reducing also the state-space size.
4.4 Other parameters abstraction
Scientific age
The scientific age is based on the first publication date of an author according to DBLP. The earliest possible publications in DBLP date back to 1971, which inevitably leads to an increase by a factor 40 of the state-space size of our model. Considering our sampled data set with only 3639 scientists, the distribution of the population in such a state space is very sparse. Thus, we identify five main groups of scientific age, categorizing age into ten-year periods as to generalize about generations of scientists: , , , , . In general, scientific careers require substantial investments to establish tenure. These positional differences, whether it being established tenure, or a starting PhD, all influence the manner in which scientists undertake collaboration [35, 29]. Our abstraction granularity is fine enough to strongly indicate the scientific position of researchers, e.g., senior staff, junior staff.
Visibility
The visibility of the scientists is measured by the annual number of conference publications. We choose only conference publications, as a potential interaction point, assuming that scientists encounter future collaborators during conferences. Without loss of generality, we limit the highest number of conference publications per year to 12 assuming it takes on average one month of preparation per publication. Those scientists that publish 12 and more papers per year we distinguish as fast publishers with a parameter value of .
Cosmopolitanism
The cosmopolitanism of the science is measured by number of coauthors, indicating how well connected a scientist is. We studied the distribution of the number of coauthors on our sampled data set. We observed that there are few publications with a large (more than 12) number of coauthors on a single paper. A high number of coauthors on a paper generally indicates a participation in a large research project. This results in an unnecessary large state-space size of the model, given the sampled authors in this sample. To tackle this, we distinguish five categories of coauthor count per paper: “non cooperative” () for the papers with one author, “regular” () for the papers with up to coauthors, “high” () with up to coauthors on the paper, “team” () with up to coauthors, and a “large project” () for papers with more than coauthors. Since we consider the unique coauthors of a scientist as possible network contacts within one year, we take the annual number of coauthors relative to the number of the publications per year per person.
4.5 Transitions and Distributions
There are three categories of distributions needed to derive from our data set for our mean-field model: (1) communication , (2) idle , and (3) collision . Communication is defined as collaboration via shared coauthorship between two scientists resulting in a conference paper. Both idle and collision states signify the decay of communication; in fact, for our application, these probability distributions are both an identity function. Moreover, in terms of the model, selection of the collaboration partner is governed by the distribution function contact, which specifies the collaboration network topology.
Computing transition probabilities
We first measure from the collected data the evolution of collaboration between scientists (nodes) for each year 2006–2010. That is, we compute the state vector , entries of which are the fractions of nodes in every possible state of the system at time . This state vector is used in the initial configuration for the model: we sum up all fraction of nodes with scientific age from class , for all possible and and set the result as at the beginning of each year . In the model, we split the time frame onto a week , for finer granularity, with 52 weeks in each year.
Consider states and . For each pair of classes and , we compute the probability that a node from contacts any node in in year as follows. Each paper with -authors by a node from and a node from gives the probability that the node from class contacts a node from . Here, is the number of nodes in class . Since we have to take into account that papers jointly written by nodes from and may have other coauthors, divisor distributes the share of contribution to each coauthor. Then, is obtained as follows: , where and means “for each author of paper from class ” (, respectively).
The computation of the collaboration distribution is as follows. For each paper penned by authors in states and (within a one-year time frame), we observe all possible state transitions (i.e. before and after collaboration). The result is an expression of the form:
where is the probability that the nodes in state at time make a transition to state at time (and, those in state move to state , respectively). All these distributions are normalized to a weekly timescale.
Estimating distributions
These rates may vary from year to year thereby requiring an average to be determined for every of these distributions to ensure accuracy in the model. To that end, we obtained probabilities, as described earlier, for the years 2006–2008, and use an HMM approach to sample the underlying distribution. We can view “training-period” collaborations as samples drawn from a probability distribution on pairs of nodes. Our goal is to approximate the set of pairs that have positive probability of collaborating. Our mean-field model takes these sampled distributions as its input.
5 Results
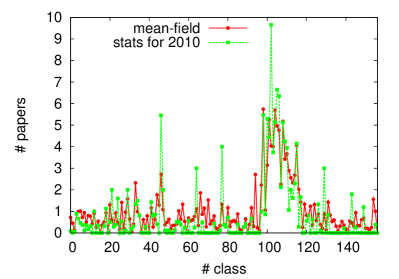
The mean-field model allows us to predict average behavior. The analytical results to the statistical results for the years 2009 and 2010 are compared to the ones produced by the mean-field model. Institutions are labeled and sorted in lexicographical order; this list is enumerated and corresponds to the number on the -axis (similar to Fig. 1). Classes 98-116 correspond to Dutch institutions. As we can see from Fig. 2a the mean-field results for the larger institutions corresponds with the statistics from the data set for 2010. Our data set does not list all papers of the coauthors of coauthors, but we divide by all people in the class; so statistics produced are lower than actual.
Institutional factor
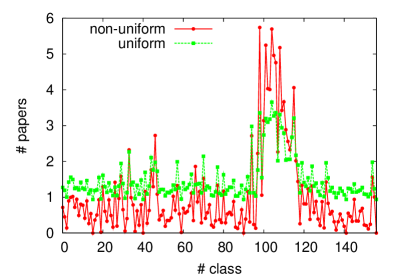
The results produced by the alternative mean-field model with uniform distribution contact for collaborations between different institutions show that the sample distribution is non uniform. This contact distribution produces the equal probability of collaboration between any two scientists in the whole network, irrespective their affiliations, and thus forms a baseline for comparison to see whether affiliations are statistically significant. The comparison in shown in Fig. 2b. As we can see, the uniform contact distribution predicts higher output for foreign institutions but lower for Dutch institutions, since the output is then uniformly “redistributed”.
Impact of scientific age
| Sci. age | avg # pubs. |
|---|---|
| 2010s | 1.8 |
| 2000s | 1.61 |
| 1990s | 1.76 |
| 1980s | 1.95 |
| 1970s | 2.3 |
| , | avg. |
|---|---|
| 0.0 | 1.0 |
| 0.2 | 1.13 |
| 0.4 | 1.15 |
| 0.6 | 1.20 |
| 0.8 | 1.27 |
| 1.0 | 1.32 |
Fig. 3a shows the average number of papers for different scientific age. The results from only Dutch institutions were averaged. The mean-model model shows that a principle of preferential attachment [3] is occuring in the network based on age, with higher tenured scientists acquiring more collaborators and papers. The average output per scientific age per institution, was also computed; see results in Table 1 in the appendix, which displayed differing tendencies in collaboration patterns.
Link prediction
In accessing the manner in which links are made through transitivity: if class has a paper in common with , and class with , then has stronger connectivity with . Within this system we consider the institution parameter, allowing us to reflect on the initial hypothesis – an institution plays a role in the collaborative patterns of scientists. The connectivity factor based on the distribution contact, which in turn, depends on the probability , the number of coauthors from a certain institution implicitly contributes to strength of the connectivity between institutions. Fig. 3b shows the generalized triad relations of Dutch institutions; considering a scientific age in contact produces results in Table 2 in the appendix.
6 Discussion and Conclusion
In investigating the system of Dutch computer scientists’ collaborative behavior through the mean-field model we observed systematic networking behavior associated with a number of social parameters, which aid in describing the networking dynamics of scientists. The past collaborative partners of one’s institution plays a key role in how future collaborations unfold. With every conference proceeding with another institution the chance of collaborating with the institution increases. Age also matters; the age of the scientists plays a role in the visibility of a scientist (number of publications) within the system. The cosmopolitanism of the scientists (number of co-authors) also contributes to the likelihood of future interaction. Consequently the mean-field model allows us to describe the Dutch CS system of conference paper collaboration to be governed by a number of social variables, where ties can be predicted given previous relationships among common institutions, reinforcing clustering tendencies in these networks.
In this first application of the mean-field model in predicting both social and network parameters for large social networks, we also recognize a number of shortcomings. The first is the sensitivity of the data-aware approach and thus the empirically informed aggregations of nodes into clusters from such an approach. Future work should aim to consider additional social parameters, such as performance, gender, discipline, length of time known in understanding the system. To improve the precise description of states the notion of idle and collisions in the model should be improved for social networks. Additionally, we acknowledge that this explorative study of the mean-field model did not address both the potential for shift classes reflecting the fluidity of actual organization constraints in social life, as well as model checking. These limitations are related to the current state of computing techniques, in first data-mining techniques which does not currently allow us to collect such refined information on social beings, and secondly the lack of methods to appropriate accurate model checking.
The incorporation of the modeling knowledge with population specific dynamics we are able to identify the conditions under which links emerge given a set of both network and social parameters through the mean-field model. This allows us to provide informed predictions to comment on the mechanism(s) under which specific patterns of behavior emerge in large social networks. Mean-field models provide a meta-scopic method, which overcomes limitations of the network only and social parameter models. Meta-scopic models of this sort allow us to incorporate both the micro (considered in evolving graph models) and the mega networking processes to infer links through a data-aware approach. Additionally, it provides an empirical terrain at which to explore the effects of both network and social parameters on large social networks.
Acknowledgements
We thank Paul T. Groth for the initial DBLP data set, and Jörg and Stefan Endrullis for their support in the "refitting" of the automated mean-field framework for the social domain.
References
- [1] Ahuja, G., Soda, G., Zaheer, A.: The genesis and dynamics of organizational networks. Organization Science 23 (2012) 434–448
- [2] Snijders, T., van de Bunt, G., Steglich, C.: Introduction to actor-based models for network dynamics. Soc. Networks 32 (2010) 44–60
- [3] Albert, R., Barabási, A.L.: Statistical mechanics of complex networks. Reviews of Modern Physics (74) (2002) 47–97
- [4] Barabási, A.L., Albert, R.: Emergence of scaling in random networks. Science 286 (1999) 509–512
- [5] Liben-Nowell, D., Kleinberg, J.: The link-prediction problem for social networks. J. ASIST 58(7) (2007) 1019–1031
- [6] Moore, C., Ghoshal, G., Newman, M.E.J.: Exact solutions for models of evolving networks with addition and deletion of nodes. Phys. Rev. E 74 (2006) 036121
- [7] Newman, M.: Coauthorship networks and patterns of scientific collaboration. Proc. Natl. Acad. Sci 101 (2004) 5200–5205
- [8] Barabási, A., Jeong, H., Néda, Z., Ravasz, E., Schubert, A., Vicsek, T.: Evolution of the social network of scientific collaborations. Physica A: Statistical Mechanics and its Applications 311(3–4) (2002) 590 – 614
- [9] Grossman, J.W.: Patterns of collaboration in mathematical research. Notices of the AMS 52(1) (2005) 35–41
- [10] Watts, D.J., Strogatz, S.H.: Collective dynamics of ‘small-world’ networks. Nature 393(49) (1998) 440–442
- [11] de Solla Price, D.: Introduction to the special issue on network dynamics. Science 149(3683) (1965) 510–515
- [12] Akkermans, H.: Web dynamics as a random walk: How and why power laws occur. In: Proc. Conf. of Web Science (WebSci), ACM (2012) To appear.
- [13] Krebs, V.: Mapping networks of terrorist cells. Connections 24(2) (2002) 43–52
- [14] Goldberg, D., Roth, F.: Assessing experimentally derived interactions in a small world. In: Proc. Natl. Acad. Sci. (2003) 4372–4376
- [15] Popescul, A., Ungar, L.: Statistical relational learning for link prediction. In: Proc. Conf. on Artificial Intelligence, ACM (2003) 81–90
- [16] Taskar, B., Wong, M.F., Abbeel, P., Koller, D.: Link prediction in relational data. In: Proc. of Neural Information Processing Systems, MIT Press (2003) 659–666
- [17] Katz, L.: A new status index derived from sociometric analysis. Psychometrika 18(1) (1953) 39–43
- [18] Granovetter, M.: The strength of weak ties. American Sociological Review 78 (1973) 1360–1380
- [19] Krackhardt, D.: The strength of strong ties: the importance of philos in organizations. Netw. and Organiz.: Structure, Form, and Action (1992) 216–239
- [20] Ennett, S., Bauman, K.: The contribution of influence and selection to adolescent peer group homogeneity, the case of adolescent cigarette smoking. J. of Personality and Social Psychology 67 (1994) 653 – 663
- [21] Robins, G., Pattison, P., Kalish, Y., Lusher, D.: An introduction to exponential random graph (p*) models for social networks. Soc. Networks 29(2) (2007) 173–191
- [22] Robins, G.: Exponential random graph models for social networksl. In: Handbook of Social Network Analysis. Sage (2011)
- [23] Bakhshi, R., Cloth, L., Fokkink, W., Haverkort, B.R.: Mean-field framework for performance evaluation of push-pull gossip protocols. Performance Evaluation 68(2) (2011) 157 – 179
- [24] Bakhshi, R., Endrullis, J., Endrullis, S., Fokkink, W., Haverkort, B.: Automating the mean-field method for large dynamic gossip networks. In: Proc. of QEST, IEEE Computer Society (2010) 241–250
- [25] Bakhshi, R.: Gossiping models: Formal Analysis of Epidemic Protocols. PhD thesis, Vrije Universiteit Amsterdam (2011)
- [26] Bishop, C.M.: Neural Networks for Pattern Recognition. OUP (1995)
- [27] Stratonovich, R.: Conditional markov processes. Theory of Probability and its Applications 5 (1960) 156–178
- [28] Grenne, M.: The demise of the lone author. Nature 450(1165) (2007)
- [29] Bozeman, B., Crley, E.: Scientists’ collaboration strategies: Implications for scientific and technical human capital. Research Policy 33(4) (2004) 599–616
- [30] Stokols, D., Misra, S., Moser, R., Hall, K., Taylor, B.: The ecology of team science: understanding contextual influences on transdisciplinary collaboration. American Journal Preventive Med 35(2S) (2008) S96–S115
- [31] Börner, K., Contractor, N., Falk-Krzesinski, H.J., Fiore, S.M., Hall, K.L., Keyton, J., Spring, B., Stokols, D., Trochim, W., Uzzi, B.: Team Assembly Mechanisms Determine Collaboration Network Structure and Team Performance. Sci. Transl. Med. 2(49) (2010) 49cm24
- [32] Rodriguez, M., Pepe, A.: On the relationship between the structural and socioacademic communities of a coauthorship network. J. Informetrics 2(3) (2009) 195–201
- [33] Jones, B.F., Wuchty, S., Uzzi, B.: Multi-university research teams: shifting impact, geography, and stratification in science. Science (322) (2008) 1259–1262
- [34] Mika, P., Elfring, T., Groenewegen, P.L.M.: Application of semantic technology for social network analysis in the sciences. Scientometrics 68(1) (2006) 3–27
- [35] deB. Beaver, D., Rosen, R.: Studies in scientific collaboration. Part III. Professionalization and natural history of modem scientific coauthorship. Scientometrics 1(3) (1979) 231–245
- [36] Yahoo! PlaceFinder. http://developer.yahoo.com/geo/placefinder/
- [37] Birkholz, J.M., Bakhshi, R., Harige, R., van Steen, M., Groenewegen, P.: Scalable analysis for large social networks: the data-aware mean-field approach. Technical Report arXiv:1209.6615, CoRR (2012)
Appendix 0.A Additional Tables
| class | sci. age | avg. # papers |
|---|---|---|
| NL0004 | 2010s | 5.387970137876415 |
| NL0004 | 2000s | 5.42581655220262 |
| NL0004 | 1990s | 5.531797518480899 |
| NL0004 | 1980s | 5.477090962989656 |
| NL0004 | 1970s | 5.528338394327215 |
| NL0019 | 2010s | 5.475312984569005 |
| NL0019 | 2000s | 5.758196664185871 |
| NL0019 | 1990s | 6.023724882790455 |
| NL0019 | 1980s | 6.8663700815459405 |
| NL0019 | 1970s | 5.984149638007387 |
| NL0013 | 2010s | 5.413644990583579 |
| NL0013 | 2000s | 5.474109082220787 |
| NL0013 | 1990s | 5.621564491339345 |
| NL0013 | 1980s | 5.56704430784838 |
| NL0013 | 1970s | 5.631497034501541 |
| NL0032 | 2000s | 2.3746979684703073 |
| NL0032 | 1990s | 2.3953334162184707 |
| NL0050 | 2010s | 1.7531110121700983 |
| NL0050 | 2000s | 1.9902354176212567 |
| NL0050 | 1990s | 3.1478709832331986 |
| NL0050 | 1980s | 2.446389301965944 |
| NL0026 | 2010s | 5.463616325979629 |
| NL0026 | 2000s | 5.891423256338538 |
| NL0026 | 1990s | 6.3905122793287426 |
| NL0026 | 1980s | 8.600700339873251 |
| NL0026 | 1970s | 5.444605947535513 |
| NL0061 | 2000s | 2.3171354951464065 |
| NL0061 | 1990s | 1.9297842271767376 |
| NL0014 | 2010s | 4.225951864691698 |
| NL0014 | 2000s | 3.53224949333238 |
| NL0014 | 1990s | 4.874423147075234 |
| NL0014 | 1980s | 2.547490074211703 |
| NL0014 | 1970s | 2.5172215234219197 |
| NL0020 | 2010s | 5.638230468869671 |
| NL0020 | 2000s | 5.739481550233624 |
| NL0020 | 1990s | 6.078863712640379 |
| NL0020 | 1980s | 6.604347286199442 |
| NL0020 | 1970s | 6.672447983873101 |
| class | sci. age | avg. # papers |
|---|---|---|
| NL0028 | 2000s | 2.1992652044875065 |
| NL0028 | 1990s | 3.7611830958900354 |
| NL0028 | 1980s | 5.887778929996966 |
| NL0028 | 1970s | 1.916486429360858 |
| NL0068 | 2000s | 3.8240436570417975 |
| NL0068 | 1990s | 3.8880963457664737 |
| NL0068 | 1980s | 11.046149565013765 |
| NL0009 | 2010s | 0.9745193168988106 |
| NL0009 | 2000s | 1.9822319970372344 |
| NL0009 | 1990s | 3.583446273423683 |
| NL0009 | 1980s | 3.5567522739468425 |
| NL0009 | 1970s | 5.18923352425846 |
| NL0035 | 2000s | 1.9853823673436444 |
| NL0035 | 1990s | 2.649920306864022 |
| NL0086 | 2000s | 1.2029281222985366 |
| NL0086 | 1990s | 2.1021646153185203 |
| NL0030 | 2010s | 4.839688780221957 |
| NL0030 | 2000s | 4.8193549962935744 |
| NL0030 | 1990s | 6.3334063984522 |
| NL0030 | 1980s | 5.248208479768112 |
| NL0030 | 1970s | 4.773586142320594 |
| NL0016 | 2010s | 2.49393738996642 |
| NL0016 | 2000s | 3.7673337179394926 |
| NL0016 | 1990s | 4.886530815370229 |
| NL0016 | 1980s | 5.116337010797732 |
| NL0016 | 1970s | 3.6766692089901465 |
| NL0006 | 2000s | 0.7347930885291606 |
| NL0006 | 1990s | 1.1441892520139676 |
| NL0021 | 2010s | 5.882071678870509 |
| NL0021 | 2000s | 6.023222506750733 |
| NL0021 | 1990s | 6.6374898109359615 |
| NL0021 | 1980s | 6.884416912837332 |
| NL0021 | 1970s | 7.578790125859185 |
| NL0025 | 2010s | 1.8698716348980597 |
| NL0025 | 2000s | 2.284845226862196 |
| NL0025 | 1990s | 2.956297121398708 |
| NL0025 | 1980s | 3.1944309000755786 |
| class | class | avg. # papers between |
|---|---|---|
| NL0004 | NL0019 | 2.263407259658148 |
| NL0004 | NL0013 | 0.4944409348985507 |
| NL0004 | NL0050 | 0.6580256046460706 |
| NL0004 | NL0026 | 0.37047393027047626 |
| NL0004 | NL0061 | 4.592857172934723 |
| NL0004 | NL0014 | 0.30798423769098177 |
| NL0004 | NL0020 | 2.398714227857339 |
| NL0004 | NL0028 | 0.4164640889428796 |
| NL0004 | NL0068 | 0.6061747061610265 |
| NL0004 | NL0009 | 0.6633554359577802 |
| NL0004 | NL0035 | 2.6838225144495502 |
| NL0004 | NL0030 | 2.3786523246885967 |
| NL0004 | NL0016 | 4.325481586579064 |
| NL0004 | NL0021 | 1.049071904544946 |
| NL0004 | NL0025 | 1.5680876945593265 |
| NL0019 | NL0013 | 1.263164247376606 |
| NL0019 | NL0032 | 1.4011820111760283 |
| NL0019 | NL0050 | 1.3827770823889554 |
| NL0019 | NL0026 | 1.973413511503678 |
| NL0019 | NL0014 | 0.22245162967310309 |
| NL0019 | NL0020 | 4.026561202730066 |
| NL0019 | NL0068 | 2.7450113205224453 |
| NL0019 | NL0009 | 2.2099848783755123 |
| NL0019 | NL0035 | 0.2673594397262916 |
| NL0019 | NL0030 | 0.11172136840556372 |
| NL0019 | NL0016 | 2.933493270016237 |
| NL0019 | NL0006 | 4.837153260029504 |
| NL0019 | NL0021 | 1.0036034944861343 |
| NL0019 | NL0025 | 1.5857662759274087 |
| NL0013 | NL0032 | 3.5540816217586015 |
| NL0013 | NL0050 | 5.411772797511066 |
| NL0013 | NL0026 | 1.2531918484487523 |
| NL0013 | NL0061 | 5.2454509657319255 |
| NL0013 | NL0014 | 0.07632021680371706 |
| NL0013 | NL0020 | 0.8782378750009818 |
| NL0013 | NL0028 | 1.7694984665097009 |
| NL0013 | NL0068 | 1.3772086810334625 |
| NL0013 | NL0009 | 0.6301882075378858 |
| NL0013 | NL0035 | 0.5055898105802711 |
| NL0013 | NL0086 | 0.5642383479094657 |
| NL0013 | NL0030 | 0.8378555376727728 |
| NL0013 | NL0016 | 0.7356057593307926 |
| NL0013 | NL0006 | 0.8548839485370945 |
| NL0013 | NL0021 | 0.7722536065314932 |
| NL0013 | NL0025 | 0.3257699911140513 |
| NL0032 | NL0026 | 5.690289048887382 |
| NL0032 | NL0020 | 1.2001233218988976 |
| NL0032 | NL0028 | 0.9288067821483903 |
| NL0032 | NL0009 | 0.02698279194374736 |
| NL0032 | NL0035 | 0.3763169179155553 |
| NL0032 | NL0086 | 0.2118886591850918 |
| NL0032 | NL0021 | 0.16702012542785669 |
| NL0032 | NL0025 | 0.036277940387929405 |
| NL0050 | NL0020 | 1.936954005954278 |
| NL0050 | NL0028 | 0.02072773164054517 |
| NL0050 | NL0035 | 0.03541644445312909 |
| class | class | avg. # papers between |
|---|---|---|
| NL0050 | NL0016 | 0.04256541335823162 |
| NL0050 | NL0021 | 1.1533007053158089 |
| NL0050 | NL0025 | 0.08509532089513992 |
| NL0026 | NL0014 | 4.8561561758914005 |
| NL0026 | NL0020 | 1.4329720180518557 |
| NL0026 | NL0028 | 0.8798112260545208 |
| NL0026 | NL0009 | 4.810684760273709 |
| NL0026 | NL0035 | 4.411840411657999 |
| NL0026 | NL0030 | 0.18459424275103944 |
| NL0026 | NL0016 | 1.7136146252333302 |
| NL0026 | NL0006 | 4.313522858056843 |
| NL0026 | NL0021 | 0.46632418474997933 |
| NL0026 | NL0025 | 1.4487786326784822 |
| NL0061 | NL0020 | 2.921188836589889 |
| NL0061 | NL0028 | 0.09561269073779911 |
| NL0061 | NL0021 | 4.772077983216558 |
| NL0014 | NL0020 | 1.824921240058736 |
| NL0014 | NL0028 | 0.11588914440358757 |
| NL0014 | NL0009 | 0.03395960031874417 |
| NL0014 | NL0035 | 0.20613212283148777 |
| NL0014 | NL0030 | 1.245053309760563 |
| NL0014 | NL0021 | 0.15648093247481415 |
| NL0014 | NL0025 | 0.09403039170462742 |
| NL0020 | NL0028 | 0.1811394917350658 |
| NL0020 | NL0009 | 1.1500793851576996 |
| NL0020 | NL0035 | 5.05334128327187 |
| NL0020 | NL0086 | 3.5145789273766326 |
| NL0020 | NL0030 | 1.3437113730742232 |
| NL0020 | NL0016 | 1.2399636762572337 |
| NL0020 | NL0006 | 5.523622926401512 |
| NL0020 | NL0021 | 1.2026231545075297 |
| NL0028 | NL0009 | 0.036176994375173285 |
| NL0028 | NL0035 | 0.03504757402471837 |
| NL0028 | NL0016 | 0.06389037493502961 |
| NL0028 | NL0006 | 0.0823774901330473 |
| NL0028 | NL0021 | 0.31348968936134985 |
| NL0028 | NL0025 | 0.004698085703887157 |
| NL0068 | NL0009 | 0.06766762951083505 |
| NL0068 | NL0021 | 0.5779882687355763 |
| NL0068 | NL0025 | 0.25566330393809494 |
| NL0009 | NL0035 | 0.08388778211855037 |
| NL0009 | NL0086 | 0.01110923956298006 |
| NL0009 | NL0006 | 0.009835235579214842 |
| NL0009 | NL0021 | 0.7310525345055223 |
| NL0009 | NL0025 | 0.013179244555458474 |
| NL0035 | NL0021 | 2.532724729506115 |
| NL0035 | NL0025 | 0.01383187109381942 |
| NL0086 | NL0030 | 0.5642684985452333 |
| NL0086 | NL0016 | 0.38769682014623896 |
| NL0086 | NL0021 | 4.976244164622265 |
| NL0030 | NL0016 | 1.0501730123811992 |
| NL0030 | NL0021 | 0.5051830348930917 |
| NL0030 | NL0025 | 0.22683573470800542 |
| NL0016 | NL0021 | 1.7537386698710558 |
| NL0016 | NL0025 | 0.13959766548258615 |
| NL0006 | NL0021 | 3.067102190843901 |
| NL0021 | NL0025 | 0.4936781178361756 |