On the Anomalous Silicate Absorption Feature of the Prototypical Seyfert 2 Galaxy NGC 1068
Abstract
The first detection of the silicate absorption feature in AGNs was made at 9.7 for the prototypical Seyfert 2 galaxy NGC 1068 over 30 years ago, indicating the presence of a large column of silicate dust in the line-of-sight to the nucleus. It is now well recognized that type 2 AGNs exhibit prominent silicate absorption bands, while the silicate bands of type 1 AGNs appear in emission. More recently, using the Mid-Infrared Interferometric Instrument on the Very Large Telescope Interferometer, Jaffe et al. (2004) by the first time spatially resolved the parsec-sized dust torus around NGC 1068 and found that the 10 silicate absorption feature of the innermost hot component exhibits an anomalous profile differing from that of the interstellar medium and that of common olivine-type silicate dust. While they ascribed the anomalous absorption profile to gehlenite (Ca2Al2SiO7, a calcium aluminum silicate species), we propose a physical dust model and argue that, although the presence of gehlenite is not ruled out, the anomalous absorption feature mainly arises from silicon carbide.
keywords:
galaxies: active – galaxies: ISM : dust – infrared: galaxies1 Introduction
Amorphous silicate is a major dust component of the Galactic interstellar medium (ISM), as revealed directly by the smooth, featureless 9.7 Si–O stretching and 18 O–Si–O bending vibrational absorption bands, and indirectly by the depletion of the silicate-forming elements Si, Mg, Fe and O in the gas phase (see Draine 2003). The first detection of the silicate absorption feature in active galactic nuclei (AGNs) was made at 9.7 for the prototypical Seyfert 2 galaxy NGC 1068 35 years ago by Rieke & Low (1975) and Kleinmann et al. (1976), indicating the presence of a large column of silicate dust in the line-of-sight to the nucleus. It is known now that most of the type 2 AGNs (which only exhibit narrow emission lines in their optical spectra) display silicate absorption bands, while the silicate features of type 1 AGNs (which are characterized by the presence of both broad and narrow emission lines in their optical spectra) appear in emission. This is consistent with the unified theory of AGNs which suggests that essentially all AGNs were “born equal”: as illustrated in Figure 1a, all types of AGNs are surrounded by an optically thick dust torus and are basically the same object but viewed from different lines of sight (see e.g. Antonucci 1993; Urry & Padovani 1995).
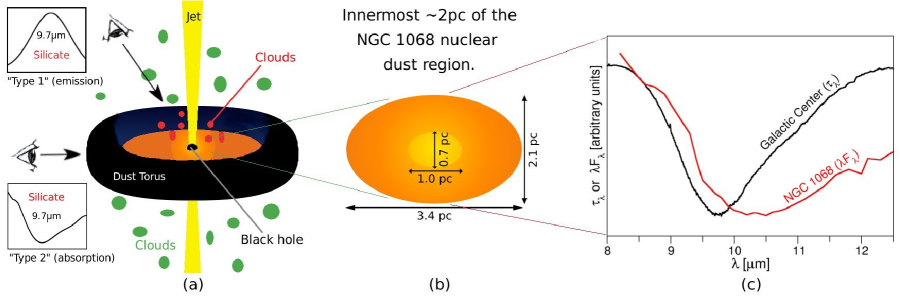
Within the framework of the unified theory of AGNs, for type 1 AGNs which are viewed face-on, one would expect to see the silicate features in emission since the silicate dust in the surface of the inner torus wall will be heated to temperatures of several hundred kelvin to 1000 K by the radiation from the central engine, allowing for a direct detection of the 9.7 and 18 silicate bands emitted from the dust (see Figure 1a). Their detection has been reported with Spitzer (Hao et al. 2005; Siebenmorgen et al. 2005; Sturm et al. 2005; Weedman et al. 2005; Shi et al. 2006; Schweitzer et al. 2008). For type 2 AGNs which are viewed edge-on, the silicate features are mostly seen in absorption (see Figure 1a) because of the obscuration of the optically thick dust torus (e.g. see Roche et al. 1991, 2007; Siebenmorgen et al. 2004; Hao et al. 2007; Spoon et al. 2007).
We note that the silicate emission features have also been detected in several type 2 QSOs (Sturm et al. 2006, Teplitz et al. 2006). Efstathiou (2006), Marshall et al. (2007) and Schweitzer et al. (2008) suggested that the silicate emission may actually arise from the narrow-line region (NLR) dust. However, Nikutta et al. (2009) argued that the clumpy dust torus model could explain the detection of the silicate feature in emission in type 2 sources. More recently, by combining Gemini and Spitzer mid-IR imaging and spectroscopy of NGC 2110 (the closest known Seyfert 2 galaxy with silicate emission features), Mason et al. (2009) were able to constrain the location of the silicate-emitting region to within 32 pc of the nucleus. Their results were consistent with both a NLR origin and an edge-on torus origin of the silicate emission.
The silicate emission profiles of AGNs are rather diverse, suggesting that the AGN silicate grains were probably not “born equal”. Some AGNs display an “anomalous” Si–O stretching band which is considerably shifted to longer wavelengths (from the canonical 9.7 to 11.5; hereafter we call it “redshift”) and broadened in comparison with the Galactic silicate profile (Hao et al. 2005, Siebenmorgen et al. 2005, Sturm et al. 2005, Smith et al. 2010), with the degree of redshifting and broadening varying from one AGN to another.
Some AGNs, e.g. 3C 273 (Hao et al. 2005) and NGC 7213 (Wu et al. 2009), exhibit an unusually strong red tail of the 18 O–Si–O bending band, incomparable with the Galactic silicate profiles. The silicate absorption profiles of some AGNs also show appreciable deviations from that of the Galactic ISM. More specifically, using the Mid-Infrared Interferometric Instrument (MIDI) on the ESO’s Very Large Telescope Interferometer (VLTI), Jaffe et al. (2004) by the first time spatially resolved the parsec-sized dust torus around NGC 1068 (see Figure 1b) and found that the 10 silicate absorption feature of the innermost hot component exhibits an anomalous profile differing from that of the ISM (see Figure 1c): the 9.7 silicate absorption spectrum of NGC 1068 shows a relatively flat profile from 8 to 9 and then a sharp drop between 9 and 10, while the Galactic silicate absorption profiles begin to drop already at about 8. Jaffe et al. (2004) found that the profile of the silicate absorption towards the hot component does not fit well to the profiles of common olivine-type silicate dust (also see Raban et al. 2009). They obtained a much better fit using the profile of gehlenite (Ca2Al2SiO7), a calcium aluminum silicate species (a high-temperature dust species found in some supergiant stars, e.g. see Speck et al. 2000).
As a part of a systematic study of the nature of the dust in AGNs and particularly of the AGN dust mineralogy, we quantitatively model the anomalous silicate absorption feature associated with the innermost hot component of the dust torus of NGC 1068.
2 NGC 1068
At a distance of only 14.4 Mpc, NGC 1068 is one of the closest and probably the most intensely studied Seyfert 2 galaxy. It has played a key role in the establishment of the unified model of AGNs: classified as a Seyfert 2 based on the presence of narrow emission lines and absence of broad emission lines in its optical spectrum, NGC 1068 is known to also harbor an obscured Seyfert 1 nucleus as revealed by the detection of broad emission lines in polarized light (Antonucci & Miller 1985). As expected from an edge-on geometry of the proposed dust torus for type 2 AGNs, NGC 1068 has long been known to display a strong absorption band at 9.7, attributed to amorphous silicate dust (Rieke & Low 1975, Kleinmann et al. 1976, Roche et al. 1991, Lutz et al. 2000, Le Floc’h et al. 2001, Siebenmorgen et al. 2004).
Jaffe et al. (2004) obtained the 8–13.5 -band spectra of the nuclear region of NGC 1068, using the MIDI instrument coupled to the VLTI [with a spatial resolution of 10 milliarcsec (mas) at = 10, corresponding to 0.7 pc]. Their interferometric mid-IR observations by the first time spatially resolved the central parsec-sized circumnuclear dust structure of NGC 1068 (see Figure 1b).
Rhee & Larkin (2006) obtained spatially-resolved mid-IR spectra of the nucleus of NGC 1068, using the Long Wavelength Spectrograph (7.71–12.48) of the Keck I 10 m telescope (with a spatial resolution of 0.25″, corresponding to 18 pc in physical scale). They found that the silicate absorption feature varies over the nuclear region: the depth of the feature reaches its maximum in the nucleus and decreases with distance from the central engine. Spatially-resolved mid-IR spectra of the nucleus of NGC 1068 were also obtained by Mason et al. (2006), using the Michelle -band (7–14) spectrometer of the Gemini North 8.1 m telescope (with a spatial resolution of 0.4″, corresponding to 30 pc). They also found that the silicate feature profile and depth exhibit striking spatial variations.
The interferometric observations of Jaffe et al. (2004) resolved the near-nuclear mid-IR emission into a warm component (320 K) in a (well-resolved) structure 2.1 pc thick and 3.4 pc in diameter, surrounding a smaller (marginally-resolved) hot structure () of 0.7 pc in size along the jet and across (also see Raban et al. 2009). They found that the silicate absorption feature could not be fit with the Galactic silicate profile or the profiles of common olivine-type silicate dust (see Figure 1c), as they begin to drop already at 8, while the interferometric spectrum of NGC 1068 (with the highest spatial resolution) shows a relatively flat profile from 8 to 9 (and then a sharp drop between 9 and 10). Therefore, they concluded that their observations would require special dust properties in the innermost 2 pc around the nucleus of NGC 1068. They obtained a quite satisfactory fit with the profile of gehlenite Ca2Al2SiO7, a high-temperature dust species. However, the approach taken by Jaffe et al. (2004) seems to us too simplified (see §5). This stimulates us to present a more physical model (see §3) to interpret the unusual silicate absorption spectrum of NGC 1068 obtained by Jaffe et al. (2004).
3 The Model
Following Jaffe et al. (2004), we assume that the nuclear dust region of NGC 1068 consists of two components: a hot component and a warm component. Let and be the hydrogen column densities of the warm and hot components, respectively; and be the (mean) dust temperatures of the warm and hot components, respectively; and be the absorption cross sections of the dust species of size at wavelength of the warm and hot components, respectively. For simplicity, we will assume a single grains size of for both the warm and hot components. Let and be the column densities of the dust (of size ) of the warm and hot components, respectively. Let and be the total absorption cross sections per H nucleon of the dust at wavelength of the warm and hot components, respectively. Apparently, we have and . Let and be the solid angles extended by the warm and hot components, respectively. The flux emitted by the warm and hot components received at the Earth is given by111Consider a dusty system with a hydrogen column density of . Let be the total dust absorption cross section per H nucleon. Let be the power radiated per solid angle in per H. With the dust self-absorption taken into account, the emission intensity is . If the dusty system is optically thin [i.e. ], .
| (1) | |||||
The term in eq.2 accounts for the fact that the emission from the inner hot component is further absorbed by the dust in the warm component (like a screen). The solid angles of the warm and hot components are taken to be , and (Jaffe et al. 2004).
We take the column density of the dust of a given species to be limited by the cosmic abundance of the rarest element contained in a given species (e.g. Ca in gehlenite Ca2Al2SiO7). Therefore, the total number of gehlenite grains (per H) can not exceed
| (2) |
where is the Ca abundance (relative to H), is the mass density of gehlenite (Mutschke et al. 1998), is the molecular weight of gehlenite (Ca2Al2SiO7), and is the atomic mass of H. Similarly, for amorphous olivine-type (MgFeSiO4) silicate dust, the total numbers of silicate and SiC grains (per H) are limited to
| (3) |
where is the Si abundance (relative to H), is the mass density of MgFeSiO4, is the molecular weight of MgFeSiO4, is the mass density of silicon carbide dust, and is the molecular weight of SiC.
In modeling the interferometric mid-IR absorption spectrum, we first need to specify the dust compositions for the warm and hot components. Once the dust compositions are specified, we obtain their absorption cross sections from Mie theory (Bohren & Huffman 1983). We are then left with only four parameters: , , , and .
4 Results
We have considered a wide variety of dust materials, including amorphous olivine (Dorschner et al. 1995), amorphous pyroxene (Jäger et al. 1994), amorphous carbon (Rouleau & Martin 1991), -SiC (Laor & Draine 1993), glassy gehlenite (Mutschke et al. 1998), and spinel (Fabian et al. 2001). We have also considered mixtures of these materials, with their absorption properties calculated from Mie theory in combination with the Bruggeman effective medium theory (Bohren & Huffman 1983). For the abundance constraints (see eqs.3,4), we adopt the solar abundance of and (Asplund et al. 2009). With = 0.1, , , and (see eqs.2,3).
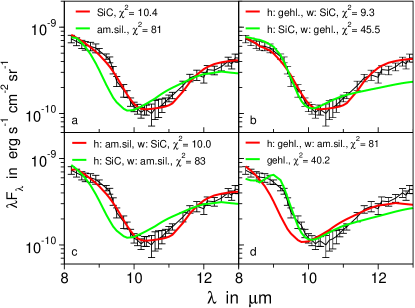
As shown in Figure 2, the best fits to the interferometric mid-IR spectrum of Jaffe et al. (2004) are provided by models which all require SiC (see Table 1 for the model parameters): either with pure SiC in both the hot region and the surrounding warm region (see Figure 2a), or with gehlenite in the hot region and SiC in the warm region (see Figure 2b), or with amorphous olivine in the hot region and SiC in the warm region (see Figure 2c). The composition of the inner hot component is less well constrained as the large column density required for the inner component causes the dust there to emit effectively like a blackbody. The absorption profile is predominantly provided by the SiC dust in the outer warm region.
We have also tried pure amorphous olivine dust for both regions. As shown in Figure 2a, even the best fit fails to fit the observed spectrum, particularly in the blue wing. With the warm region filled with amorphous olivine and with the hot region filled with either SiC (see Figure 2c) or gehlenite (see Figure 2d), we obtain model spectra similar to that of the pure amorphous olivine model, confirming that it is the dust in the outer warm region dominates the absorption profile.
We have also considered gehlenite. Assuming either gehlenite for both regions (see Figure 2d) or gehlenite only for the outer warm region and other dust species (e.g. SiC) for the inner hot region (see Figure 2b), we see that good fits to the blue wing of the 9.7 feature are achieved, but both models fail at .
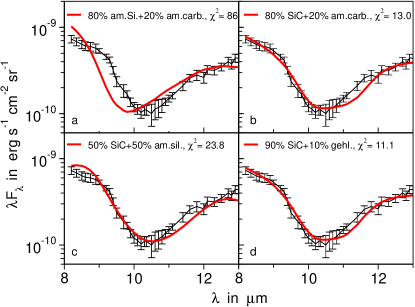
Finally, we model the observed mid-IR spectrum with a mixture of two dust species and assume the same mixture for both the hot and warm regions (see Figure 3). For the amorphous olivine-amorphous carbon mixture, even the closest fit (given by a mixture of silicate of a volume fraction of 80% and amorphous carbon of a volume fraction of 20%) fails to reproduce the blue wing of the 9.7 feature (see Figure 3a). Better fits could be achieved if the mixture contains SiC (see Figure 3b,c,d).
| Hot | Warm | |||||
|---|---|---|---|---|---|---|
| Dust | Dust | [] | [] | [K] | [K] | |
| SiC | SiC | 1110 | 250 | 10.4 | ||
| sil. | sil. | 870 | 100 | 81 | ||
| gehl. | SiC | 1140 | 250 | 9.3 | ||
| SiC | gehl. | 840 | 220 | 45.5 | ||
| sil. | SiC | 1110 | 250 | 10.0 | ||
| SiC | sil. | 870 | 100 | 83 | ||
| gehl. | sil. | 870 | 100 | 81 | ||
| gehl. | gehl. | 960 | 230 | 40.2 | ||
| 80% sil. | 20% am.carb. | 1020 | 100 | 86 | ||
| 80% SiC | 20% am.carb. | 1080 | 250 | 13.0 | ||
| 50% SiC | 50% sil. | 1770 | 240 | 23.8 | ||
| 90% SiC | 10% gehl. | 1020 | 250 | 11.1 |
5 Discussion
In §4 we have shown that, for a physically plausible model, to achieve any reasonably close fits to the interferometric spectrum of NGC 1068, SiC is required. SiC is a highly refractory dust species. It has been identified in the outflows of carbon stars. Interstellar SiC grains have been found intact in “primitive ” meteorites (e.g. Bernatowicz et al. 1987), although the fraction of silicon in the local diffuse ISM in SiC dust is small: 5% (Whittet et al. 1990) or 3% (Min et al. 2007). SiC was one of the three major dust species (i.e. amorphous silicate, graphite, and SiC) considered by Laor & Draine (1993) in their extensive AGN dust modeling. Although we are not able to rule out gehlenite as the major dust species in the inner hot component, SiC should be the dominant dust species in the outer warm component and dominates the mid-IR absorption.
For all models, the determined temperatures of the hot and warm components are and , respectively (see Table 1). For the SiC-containing model, the temperatures of the dust in the hot and warm components are and , respectively. The derived H column density of the hot component is in the order of 10, consistent with the measurements of the inner wall by Matt et al. (1997, 2004). The warm component requires to be in the order of 10, consistent with the measurements of Kinkhabwala et al. (2002).
Finally, we note that although the calculations were carried out for a grain radius of 0.1, increasing the grain radius or assuming a porous structure causes the deviation between the observed and model spectra to increase.
Jaffe et al. (2004) argued that a quite satisfactory fit to the interferometric mid-IR spectrum of the near-nuclear dust region of NGC 1068 could be obtained with the absorption profile of gehlenite. Gehlenite is a silicate of the melilite group with a high condensation temperatures (1735 K for melilite, see Hutchison 2004). It has been found in objects in the solar system: calcium-aluminum rich inclusions in carbonaceous chondrites (see e.g. Morlok et al. 2008), anhydrous interplanetary dust particles (Greshake et al. 1996), and cometary dust collected by the Stardust spacecraft from comet Wild 2 (Zolensky et al. 2006, Schmitz et al. 2008). It is assumed that gehlenite was produced close to the young Sun at high temperatures and was distributed in the entire system.
In their model, Jaffe et al. (2004) assumed that (1) both the warm and hot components emit like a black-body, and (2) each component is subject to an attenuation of , with the optical depth profile varying to match that of known silicate species. Their modeling theme can be described as the following
| (4) |
where and are the constants (related to the total dust masses) for the warm and hot components, respectively;222More explicitly, under the assumption that the dust emits like a blackbody, and , where and are respectively the total dust masses of the warm and hot components, and are respectively the mass densities of the dust in the warm and hot components. and are the dust temperatures of the warm and hot components, respectively; is the Planck function of temperature at wavelength ; and are the optical depths in front of the warm and hot components, respectively. Since the hot component is embedded in the warm component, the hot component is subject to an attenuation of .
While it was rather successful in fitting the MIDI spectra, the assumptions made by Jaffe et al. (2004) were not justified: (1) their modeling theme implied that as if there were an absorbing screen in front of the hot component and an additional absorbing screen in front of the warm component; and (2) if the grains in the hot and warm components indeed emit like a blackbody as they assumed, the grains must be much larger than several micrometers and reach the geometrical optics regime.333This requires the grain size satisfying the criterion of at the wavelength range of the silicate Si–O band, i.e. 10 (see Bohren & Huffman 1983). These grains would not produce any noticeable spectral features around , and therefore the silicate absorption must arise from the absorbing screens.
To summarize, we agree with Jaffe et al. (2004) that the interferometric spectrum of NGC 1068 cannot be explained with amorphous silicate with an olivine normative composition. However, unlike Jaffe et al. (2004) who attributed the unusual 9.7 absorption feature of NGC 1068 to gehlenite, we argue that SiC is mostly responsible for this feature although the presence of gehlenite in the inner hot region is not ruled out.
Acknowledgments
We thank C. Kemper for providing us with the ISO spectrum of the Galactic center, and J.Y. Hu, M.P. Li, H.A. Smith, A.K. Speck, and the anonymous referee for very helpful discussions/comments. This work is supported in part by NASA/HST Theory Programs, NASA/Spitzer Theory Programs, and a NASA/Chandra Theory program.
References
- [\citeauthoryearAntonucci1993] Antonucci, R., 1993, ARA&A, 31, 473
- [\citeauthoryearAntonucci & Miller1985] Antonucci, R.R.J., & Miller, J.S., 1985, ApJ, 297, 621
- [\citeauthoryearAsplund et al.2009] Asplund, M., et al., 2009, ARA&A, 47, 481
- [\citeauthoryearBernatowicz et al.1987] Bernatowicz, T., et al., 1987, Nature, 330, 728
- [\citeauthoryearBohren & Huffman1983] Bohren, C.F., & Huffman, D.R., 1983, Absorption and Scattering of Light by Small Particles, Wiley: New York
- [\citeauthoryearDorschner et al.1995] Dorschner, J., et al., 1995, A&A, 300, 503
- [\citeauthoryearDraine2003] Draine, B. T., 2003, ARA&A, 41, 241
- [\citeauthoryearEfstathiou2006] Efstathiou, A., 2006, MNRAS, 371, L70
- [\citeauthoryearFabian et al.2001] Fabian, D., 2001, A&A, 373, 1125
- [\citeauthoryearGreshake et al.1996] Greshake, A., et al., 1996, M&PS, 31, 739
- [\citeauthoryearHao et al.2005] Hao, L., et al., 2005, ApJ, 625, L75
- [\citeauthoryearHao et al.2007] Hao, L., et al., 2007, ApJ, 655, L77
- [\citeauthoryearHutchison2004] Hutchison, R., 2004, Meteorites: A Petrologic, Chemical and Isotopic Synthesis, Cambridge University Press
- [\citeauthoryearJäger et al.1994] Jäger, C., et al., 1994, A&A, 292, 641
- [\citeauthoryearJaffe et al.2004] Jaffe, W., et al., 2004, Nature, 429, 47
- [\citeauthoryearKemper et al.2004] Kemper, F., et al., 2004, ApJ, 609, 826
- [Markwick-Kemper et al.(2007)] Kemper, F., Gallagher, S. C., Hines, D. C., & Bouwman, J. 2007, ApJ, 668, L107
- [\citeauthoryearKinkhabwala et al.2002] Kinkhabwala, A., et al., 2002, ApJ, 575, 732
- [\citeauthoryearKleinmann et al.1976] Kleinmann, D.E., et al., 1976, ApJ, 208, 42
- [\citeauthoryearLaor & Draine1993] Laor, A., & Draine, B.T., 1993, ApJ, 402, 441
- [\citeauthoryearLe-Floc’h et al.2001] Le Floc’h, E., et al., 2001, A&A, 367, 487
- [\citeauthoryearLutz et al.2000] Lutz, D., et al., 2000, ApJ, 530, 733
- [\citeauthoryearMatt et al.1997] Matt, G., et al., 1997, A&A, 325, L13
- [\citeauthoryearMatt et al.2004] Matt, G., et al., 2004, A&A, 414, 155
- [\citeauthoryearMarshall et al.2007] Marshall, J.A., et al., 2007, ApJ, 670, 129
- [\citeauthoryearMason et al.2006] Mason, R.E., et al., 2006, ApJ, 640, 612
- [\citeauthoryearMason et al.2009] Mason, R.E., et al., 2009, ApJ, 693, L136
- [\citeauthoryearMin et al.2007] Min, M., Waters, L. B. F. M., de Koter, A., Hovenier, J. W., Keller, L. P., & Kemper, F. 2007, A&A, 462, 667
- [\citeauthoryearMorlok et al.2008] Morlok, A., et al., 2008, M&PS, 43, 1147
- [\citeauthoryearMutschke et al.1998] Mutschke, H., et al., 1998, A&A, 333, 188
- [\citeauthoryearNikutta et al.2009] Nikutta, R., et al., 2009, ApJ, 707, 1550
- [\citeauthoryearRaban et al.2009] Raban, D., et al., 2009, MNRAS, 394, 1325
- [\citeauthoryearRhee & Larkin2006] Rhee, J.H., & Larkin, J.E., 2006, ApJ, 640, 625
- [\citeauthoryearRieke & Low1975] Rieke, G.H., & Low, F.J., 1975, ApJ, 199, L13
- [\citeauthoryearRoche et al.1991] Roche, P.F., et al., 1991, MNRAS, 248, 606
- [\citeauthoryearRoche et al.2007] Roche, P.F., et al., 2007, MNRAS, 375, 99
- [\citeauthoryearRouleau & Martin1991] Rouleau, F., & Martin, P.G., 1991, ApJ, 377, 526
- [\citeauthoryearSchmitz et al.2008] Schmitz, S., et al., 2008, LPI, 39, 1137
- [\citeauthoryearSchweitzer et al.2008] Schweitzer, M., et al., ApJ, 679, 101
- [\citeauthoryearShi et al.2006] Shi, Y., et al., 2006, ApJ, 653, 127
- [\citeauthoryearSiebenmorgen et al.2004] Siebenmorgen, R. et al., 2004, A&A 414, 123
- [\citeauthoryearSiebenmorgen et al.2005] Siebenmorgen, R. et al., 2005, A&A 436, L5
- [\citeauthoryearSmith et al.2010] Smith, H.A., et al., 2010, ApJ, in press
- [\citeauthoryearSpeck et al.2000] Speck, A.K., et al., 2000, A&A, 146, 437
- [\citeauthoryearSpoon et al.2007] Spoon, H.W.W., et al., 2007, ApJ, 654, L49
- [\citeauthoryearSturm et al.2005] Sturm, E., et al., 2005, ApJ, 629, L21
- [\citeauthoryearSturm et al.2006] Sturm, E., et al., 2006, ApJ, 642, 81
- [\citeauthoryearTeplitz et al.2006] Teplitz, H.I., et al., 2006, ApJ, 638, L1
- [\citeauthoryearUrry & Padovani1995] Urry, C. M., & Padovani, P., 1995, PASP, 107, 803
- [\citeauthoryearWeedman et al.2005] Weedman, D.W., et al., 2005, ApJ, 633, 706
- [\citeauthoryearWhittet et al.1990] Whittet, D. C. B., Duley, W. W., & Martin, P. G. 1990, MNRAS, 244, 427
- [\citeauthoryearWu et al.2009] Wu, Y., et al., 2009, ApJ, 701, 658
- [\citeauthoryearZolensky et al.2006] Zolensky, M.E., et al., 2006, Science, 314, 1735