PS1-10jh - a tidal disruption event with an extremely low disk temperature
Abstract
The cooler than expected optical-UV transient PS1-10jh detected by the Pan-STARRS1 survey is probably related to a tidal disruption event in which a He-rich stellar core remnant is implied. The evolution of bound debris during the disk phase is studied by solving the hydrodynamic equations. The model provides a good fit either of the raising part of the light curve in the bands , , and or in the early decay. The parameters characterizing this optimized model are the mass of the central black hole, i.e., M⊙ and the critical Reynolds number that fixes the viscosity and the accretion timescale. Such a high value of explains the low disk temperature and the consequent absence of X-ray emission. The predicted bolometric peak luminosity is about and the predicted total radiated energy is about erg.
keywords:
Supermassive black holes; tidal flares; accretion disks1 Introduction
Different flare events have been detected either in X-rays (Bade et al. 1996; Komossa & Bade 1999; Donley et al. 2002; Esquej et al. 2007, 2008; Cappelluti et al. 2009; Maksym et al. 2010) or in the UV region (Gezari et al. 2006, 2009). These sudden variations in the electromagnetic emission of “quiet” galaxies have been interpreted as being the consequence of the tidal disruption of a star that has passed close to a supermassive black hole (SMBH) living in a “dormant” state in the center of its host galaxy. For a near parabolic orbit in which the periapse distance is shorter than the tidal radius , tidal disruption is likely to occur and two distinct phases in the dynamical evolution of the debris can be distinguished. In the first, the “fallback” phase, nearly half of the debris is in gas streams having approximately ballistic trajectories, which converge and collide at periapse, dissipating energy through shocks. Typically, for a black hole of mass M⊙ and a disrupted star of the released energy in this phase is about erg. Since the dissipated energy in these shocks scales as , in our case, as we shall see below, this is expected to be one order of magnitude less than the “disk-phase. As the bound material converges at periapse and dissipates energy, a small accretion disk is formed and the second phase initiates as soon as the black hole begins to accrete mass, which coincides with the instant of maximum in the light curve. This is dictated by the viscous mechanism that controls the angular momentum transfer, fixing the timescale in which the material is conveyed from the outer regions of the disk to the last stable orbit. In this “disk”-phase, most of the flare energy is radiated.
Non-steady accretion disk models have recently been built by Montesinos & de Freitas Pacheco (2011a, b, hereafter MP11A and MP11B) by solving numerically the hydrodynamic and the energy transfer equations. These models are able to explain the sudden variation of the X-ray emission observed in non-active galaxies that are supposed to be related to tidal events like those observed in NGC 3599 or IC 3599. More recently, Gezari et al. (2012) reported an UV-optical flare that has occurred in a non-active galaxy at and which was probably originated in a tidal disruption event. This flare event discovered in the Pan-STARRS1 survey displays some particular characteristics like: a) the lack of hydrogen lines in the spectra and the presence of a broad HeII4686 Å emission line suggest that the disrupted star lost its outer envelope and can probably be identified with the He-rich core of an ancient red giant; b) no detectable X-rays emission by Chandra; c) from the analysis of the continuum emission, the estimated disk temperature is considerably lower than those attributed to disks associated usually with X-ray flare events.
We report here the results obtained from a series of models computed with our code, aiming to reproduce the observed light curve in different wavelengths and to derive the main parameters characterizing the event.
2 The model
The hydrodynamic equations describing the disk evolution can be found in MP11A and MP11B respectively but, in a few words, we recall here the basic features. The code is based on an Eulerian formalism using a finite difference method of second-order, according to the Van Leer upwind algorithm on a staggered mesh. Since the disks considered here are quite small, we have adopted an integration grid of 256 ring sectors instead of the original 1024 rings adopted in MP11A. The inner radius of the grid coincides with the last stable orbit while the external radius is defined by the tidal radius , where and are respectively the mass and radius of the disrupted star and is the black hole mass. Notice that generally in the literature the parameter is taken to be equal to unity. In fact, the work by Luminet & Carter (1986) suggests that = 2.4, which corresponds to the Roche limit for a fluid body in a circular orbit. More recent investigations of the fly-by problem for a viscous fluid body in a parabolic orbit suggest an effective Roche limit () with (Sridhar & Tremaine 1992; Kosovichev & Novikov 1992). In particular, the latter authors considered the case in which the disturbing body is a massive black hole as in the present case. Thus, the value will be adopted in our grid of models. This implies that in our models the most bound material returns to periapse after a timescale that is about 4.8 times higher than the case =1. As we shall see later, this explains why Gezari et al. (2012) concluded that the disruption occurred only 76 days before maximum light while our preferred model indicates a higher timescale, namely, 1.24 years. The original MP11A boundary conditions were also modified to allow an inflow of matter at the external ring, corresponding to the material that circularizes after shocks between converging streams.
Also as in MP11A, it was assumed that the gravitational field of the black hole is given by the approximate potential of Paczynski-Wiita (Paczynski & Wiita 1980) that gives correctly the position of the last stable orbit for the Schwarzschild geometry.
It should be emphasized that in the present model the angular momentum transfer is not described by the so-called “”-model introduced by Shakura & Sunyaev (1973). The viscosity coefficient is that given by the approach of de Freitas Pacheco & Steiner (1976), i.e., , where is the radial distance to center of the disk, is the azimuthal velocity of the debris at that distance and is the critical Reynolds number characterizing the flow.
Another important aspect concerns the fallback rate. According to early investigations (Rees 1988; Evans & Kochanek 1989), in a first approximation, the fallback rate is given by the relation
| (1) |
where
| (2) |
However, more detailed studies (Lodato et al. 2009) based on simulations indicate deviations from eq.1 at early phases of the fallback process. In fact, only in the late evolutionary stages the fallback rate varies as . As in MP11B, we have attempted to include these deviations by modifying eq.1 as
| (3) |
In the above equation is a normalization constant (see MP11A for details) and is still given by eq.2. Notice that the dimensionless parameter permits to control the instant at which the maximum fallback rate occurs.
3 Results
A series of models were computed in which the different parameters were varied, searching for a best representation of data, namely, the light curves of the flare in different wavelengths. In all models, we assumed that the disrupted star is a He-rich core of 0.23 and a radius of 0.33 as in Gezari et al. (2012). Our preferred model is characterized by a black hole of mass , a fallback parameter and a critical Reynolds number . Notice that this value is higher than those characterizing our previous models (MP11B) but is necessary to get a “colder” disk. A higher value of decreases the local dissipation of kinetic energy, producing lower temperatures and consequently, increasing the energy inflow by advection.
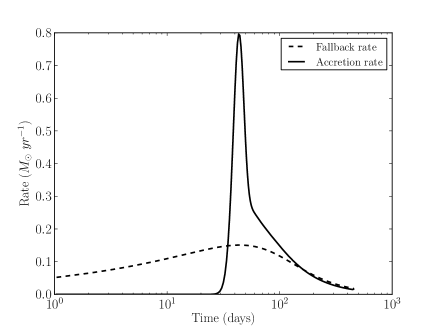
Contrary what is generally assumed in the literature, the beginning of the accretion process by the black hole does not coincide with the beginning of the circularization process or, in other words, with the beginning of the formation of the accretion disk. This is simply because it takes a finite time for the debris to be transported from the outer regions down to the inner region (last stable orbit) due to the angular momentum transfer mechanism. This is clearly seen in fig.1 where the evolution of the fallback rate is compared with the evolution of the accretion rate by the black hole. The very initial peak in the accretion rate occurs (for our preferred model) about 44.8 days after the onset of the circularization process and coincides also with the maximum in the light curve. The mass of the gravitationally bound debris is about 0.115 , corresponding to a half of the mass of the disrupted star, but a small fraction (about 15%) is not accreted by the black hole, escaping from the system and taking away the angular momentum stored in the disk.
The continuous emission of the flare is generally fitted by a black-body distribution characterized by an effective temperature. In reality, the local effective temperature varies along the disk surface with a radial profile that evolves in time. MP11B defined a suitable mean effective temperature, which corresponds to an effective energy flux that multiplied by the total disk surface gives the luminosity. Such a mean effective temperature is computed from the relation
| (4) |
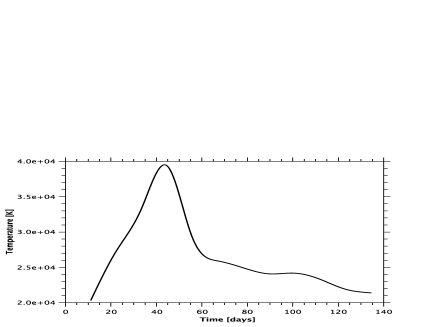
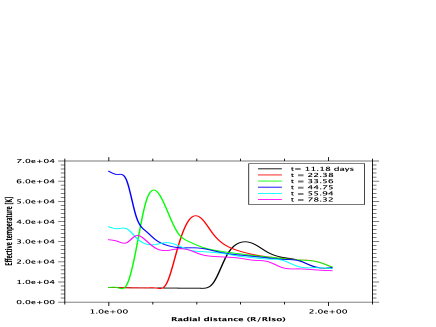
The evolution of the mean effective temperature is shown in fig.2. The maximum value ( 39400 K) coincides with maximum light (and maximum accretion rate by the black hole). After approximately 25 days the mean effective temperature of the disk drops to about 25000 K and then decreases more or less steadly at a rate of . The model predicts at maximum light and near the central region a “true” temperature around 65000 K. One month after maximum, in the inner region, the temperature has decreased to about 31000 K while in the outskirts of the disk it remains at a value around 20000 K. Figure 3 shows different snapshots of the temperature profile before, at and after maximum light.
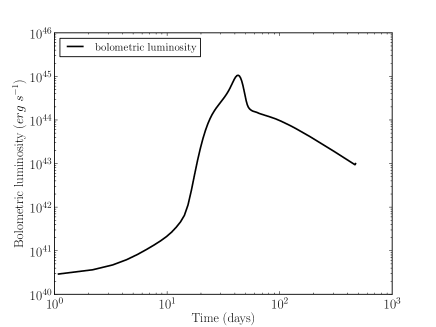
In figure 4, the bolometric light curve is shown. As already mentioned, before maximum light the black hole is not yet accreting matter and the radiation comes from viscous dissipation in the disk that is still being formed. Integrating the bolometric luminosity over time allows an estimation for the total radiated energy, i.e., erg, in agreement with the lower limit estimated by Gezari et al. (2012), based on a black-body spectrum characterized by a temperature 30 000 K. Taking into account the total amount of mass accreted by the black hole, the mean efficiency for the energy conversion is .
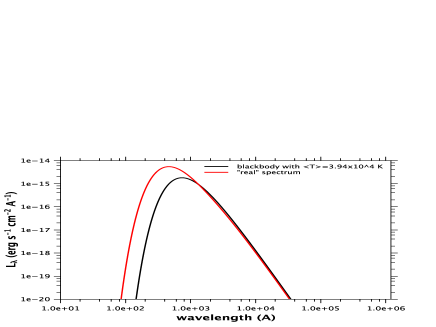
The resulting spectrum at maximum is shown in fig. 5 in comparison with the expected spectrum of a black body characterized by the mean effective temperature. As MP11B have shown, the black body approximation underestimates the emitted flux at short wavelengths ( 1000 Å) but predicts correctly fluxes at longer wavelengths.
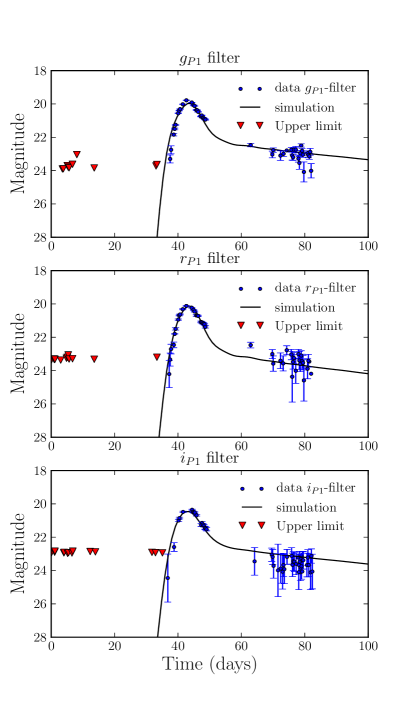
The light curve in filters , and are shown respectively in the upper, middle and lower panels of figure 6. Data points are those given by Gezari et al. (2012). According to these authors, who have adopted the models by Lodato et al. (2009), systematic differences are present between data and theoretical light curves during the early rise and the late decay. The present model explains quite well both the raising part of the light curve and the early decay phase. The former is produced while the disk is still being formed and the black hole is not yet accreting mass. The early decay, just after maximum does not vary as as usually claimed but varies faster, decreasing by about one magnitude per week. The late evolution of the theoretical light curve displays the aforementioned behaviour, i.e., although data in the filter (lower panel) 40 days after maximum are slightly below the predicted values but still consistent taking into account the observational errors.
4 Summary
The transient event discovered on 2010 May 28 by the Pan-STARRS1 (PS1) Medium Deep Survey was probably originated in a tidal disruption event. According to Gezari et al. (2012) the disrupted star was a helium-rich core resulting from the evolution of a red giant. We have used our hydrodynamic code (MP11A, MP11B) to compute the radiation of the bound debris during the phase in which a small accretion disk is formed and during which most of the flare energy is produced.
Our preferred model requires that the central black hole has a mass of M⊙ almost a factor 2.3 higher than that estimated by Gezari et al. (2012) but in good agreement with the relation between the black hole mass and the stellar mass of the host galaxy.
No significant X-ray emission related to the flare was detected, consistent with the temperature of 35 000 K estimated by Gezari et al. (2012) that is necessary to produce enough UV photons to ionize helium. Our model predicts at maximum and near the inner region of the disk a temperature of 65 000 K, which is a consequence of a high critical Reynolds number () characterizing the turbulent state of the gas. This is about 20 times the values defining our previous models (MP11B), in which an important X-ray emission is present. Notice that in our model the heating rate per unit volume due to viscosity is given by the equation
| (5) |
that shows why a higher critical Reynolds number or a lower viscosity decreases the heating rate and, consequently, the disk temperature.
The most important difference with the analysis by Gezari et al. (2012) concerns the chronology of the event, which results from the adopted value for the dimensionless parameter defining the tidal radius. If 1.69 and not one, then the disruption of the star occurred about 1.24 yr before maximum light and the beginning of the circularization process, about 44.7 days before the peak. We emphasize once more that the beginning of circularization doesn’t coincide with the beginning of the accretion process by the black hole.
Contrary to the models adopted by Gezari et al. (2012), the present model provides a good representation of the initial raise of the light curve, when the black hole is not yet accreting and the disk is being filling up, as well as of the initial light decay, which evolves faster than .
Detailed analyses of tidal disruption events provide an excelent tool to study dormant black holes and the physics of non-steady accretion disk, in particular of the mechanisms reponsible for the angular momentum transfer and energy dissipation.
Acknowledgments
MMA acknowledges the support from FONDECYT through grant No. 3120101, and Basal (PFB0609). The authors are grateful to the referee for her/his valuable comments which have improved considerably this paper.
References
- [1] Bade, N., Komossa, S. & Dahlem, M., 1996, A&A 309, L35
- [2] Cappelluti, N., Ajello, M, Rebusco, P., Komossa, S., Bongiorno, A., Clemens, C., Salvato, M., Esquej, P., Aldcroft, T., Greiner, J. & Quintana, H., 2009, A&A 495, L9
- [3] de Freitas Pacheco, J.A. & Steiner, J.E., 1976, ApSS 39, 487
- [4] Donley, J.L, Brandt, W.N., Eracleous, M. & Boller, Th., 2002, AJ 124, 1308
- [5] Esquej, P., Saxton, R.D., Freyberg, M.J., Read, A.M., Altieri, B., Sánchez-Portal, M. & Hasinger, G., 2007, A&A 462, L49
- [6] Esquej, P., Saxton, R.D., Komossa, S., Read, A.M., Freyberg, M.J., Hasinger, G., García-Hernández, D.A., Lu, H., Rodriguez Zaurín, J., Sánchez-Portal, M. & Zhou, H., 2008, A&A 489, 543
- [7] Evans, C.R. & Kochanek, C.S., 1989, ApJ 346, L13
- [8] Gezari, S., Heckman, T., Cenko, S.B. et al., 2009, ApJ 698, 1367
- [9] Gezari, S, Martin, D.C., Milliard, B. et al., 2006, ApJ 653, L25
- [10] Gezari et al., 2012, Nature, 485, 217
- [11] Komossa, S. & Bade, N., 1999, A&A 343, 775
- [12] Kosovichev, A.G. & Novikov, I.D., 1992, MNRAS 258, 715
- [13] Lodato, G., King, A.R. & Pringle, J.E., 2009, MNRAS 392, 332
- [14] Luminet, J.-P. & Carter, B., 1986, ApJS 61, 219
- [15] Maksym, P., Ulmer, M.P. & Eracleous, M., 2010, ApJ 722, 1035
- [16] Montesinos Armijo, M.A & de Freitas Pacheco, J.A., 2011, A&A 526, 146 (MP11A)
- [17] Montesinos Armijo, M.A & de Freitas Pacheco, J.A., 2011, ApJ, 736, 126 (MP11B)
- [18] Paczynski, B. & Wiita, P.J., 1980, A&A 88, 23
- [19] Rees, M.J., 1988, Nature 333, 523
- [20] Shakura, N.I. & Sunyaev, R.A., 1973, A&A 24, 337
- [21] Sridhar, S. & Tremaine, S., 1992, Icarus 95, 86