Measurement of the half-life of the two-neutrino double beta decay of 76Ge with the Gerda experiment
Abstract
The primary goal of the GERmanium Detector Array (Gerda) experiment at the Laboratori Nazionali del Gran Sasso of INFN is the search for the neutrinoless double beta decay of 76Ge. High-purity germanium detectors made from material enriched in 76Ge are operated directly immersed in liquid argon, allowing for a substantial reduction of the background with respect to predecessor experiments. The first 5.04 kgyr of data collected in Phase I of the experiment have been analyzed to measure the half-life of the neutrino-accompanied double beta decay of 76Ge. The observed spectrum in the energy range between 600 and 1800 keV is dominated by the double beta decay of 76Ge. The half-life extracted from Gerda data is = yr.
pacs:
23.40.-s, 07.85.Fv1 Introduction and scope
Neutrinoless double beta () decay of atomic nuclei (,) (,) +2 is a forbidden process in the Standard Model (SM) of particle physics because it violates lepton number by two units. An observation of such a decay would demonstrate lepton number violation in nature and would prove that neutrinos have a Majorana component. For recent reviews, see [1]. The two-neutrino double beta () decay of atomic nuclei,
with the simultaneous emission of two electrons and two anti-neutrinos,
conserves lepton number and
is allowed within the SM, independent of the nature of
the neutrino. Being a higher-order process, it is characterized by an
extremely low decay rate: so far it is the rarest decay observed in
laboratory experiments. It is observable for a few even-even
nuclei and was detected to-date for eleven
nuclides; the corresponding half-lives are in the range of
yr [2, 3, 4].
The measurement of the half-life of the decay () is of
substantial interest. For example, model
predictions of the half-life require the evaluation of nuclear
matrix elements. These calculations are complicated and have large
uncertainties. They are different from those required for
the decay, but it has been
suggested [5, 6]
that, within the same model framework, some constraints on the
matrix elements NME0ν can be derived from the
knowledge of the nuclear matrix elements NME2ν. Also,
the nuclear matrix element NME2ν which is extracted from the measurement
of the half-life of the decay can be directly compared with the
predictions based on charge exchange experiments [7, 8]. A
good agreement would indicate that the reaction mechanisms and the
nuclear structure aspects that are involved in the decay are well understood.
The GERmanium Detector Array (Gerda) experiment at the Laboratori
Nazionali del Gran Sasso of INFN searches for the decay
of 76Ge.
High-purity germanium detectors isotopically enriched in 76Ge are operated
bare and immersed in liquid argon in order to greatly reduce the
environmental background. As a first result of this ongoing research, the present paper
reports a precise measurement of the half-life of the decay
of 76Ge. The data used in this work encompasses an
exposure of 5.04 kgyr, taken between November 2011 and
March 2012.
2 The Gerda experimental setup
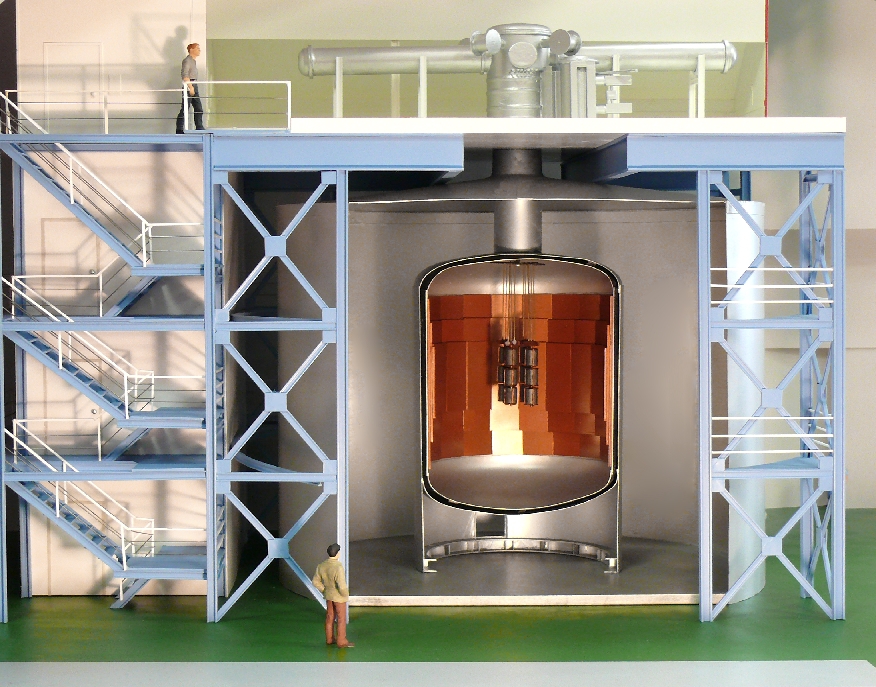
A brief outline of the components of the Gerda detector that are most relevant for this
work is given below; a detailed description can be found in [9, 10].
The Gerda experimental setup is shown in figure 1. At the core of the
setup there is an array of high-purity germanium detectors (HPGe). They are operated bare
in liquid argon (LAr) which acts both as a coolant and as a shield against the residual
environmental background.
The array configuration consists of eleven germanium detectors: eight
are made from isotopically modified germanium (enrGe), enriched to about 86% in 76Ge,
and three are made from natural germanium (natGe), with a total mass of 17.67 kg
and 7.59 kg, respectively. The enriched detectors come from the former Heidelberg-Moscow
(HdM) [11] and Igex [12] experiments.
They underwent specific refurbishing processes before operation in Gerda [13, 14].
The germanium detectors
are mounted in strings with typically three diodes each. Signals are amplified by
low noise, low radioactivity charge sensitive preamplifiers [15] with 30 MHz bandwidth
operated inside the LAr. They are digitized by a 14-bit 100 MHz
continuously running ADC (FADC) equipped with anti-aliasing bandwidth filters.
In the offline analysis the waveforms are digitally
processed to reconstruct the event energy.
The detector array is surrounded by 64 m3 of 5.0-grade LAr, contained in
a vacuum insulated cryostat made of stainless steel, lined on the inner side by a 3 to 6 cm
thick layer of copper.
The cryostat is in turn placed at the centre of a 580 m3 volume of ultra-pure water
equipped with 66 photomultiplier tubes to veto the residual cosmic ray muons
by the detection of Cherenkov light. The large water volume also serves as a shield
to moderate and capture neutrons produced by natural
radioactivity and in muon-induced hadronic showers.
The energy scale is set by using calibration curves, parametrized as second-order
polynomials, derived for each detector by calibration runs taken with 228Th sources.
The stability of the energy scale is monitored by performing such
calibration runs every one or two weeks. Moreover, the stability of the system is
continuously monitored by using ad hoc charge pulses generated by a spectroscopy
pulser that are regularly injected in the input of the charge sensitive
preamplifier.
All Gerda detectors but two exhibit a reverse current of the order of tens of pA. The
two problematic detectors showed an increase
of leakage current soon after the beginning of their operation; therefore their
bias high voltage had to be reduced and finally completely removed. These two detectors
do not contribute to the present data set, although they are accounted for in the
detector anti-coincidence cut described below. The total mass of the operational enriched
detectors is 14.63 kg. The natGe detectors are not considered in the present
analysis because of their low content of 76Ge.
The average energy resolution for the six enriched detectors considered
in this study is about 4.5 keV (full width at half maximum) at the
Qββ-value of 76Ge (2039 keV) [10].
A key parameter which is required for the computation of is the total 76Ge
active mass. It is calculated as the product of the total detector mass with the isotopic
abundance of 76Ge () and the fraction of the active mass ().
The average 76Ge isotopic abundance of the six enriched detectors
considered in this work is 86.3% [10, 12, 16, 17].
In Gerda p-type semi-coaxial detectors are used, for which a part of the volume
close to the outer surface is inactive.
After mechanical modifications and processing of the germanium diodes at the manufacturer,
their active mass was re-determined experimentally [10, 13]. The measured average
fraction is 86.7%, with individual detector uncertainties
of about 6.5.
3 The data set
The data set considered for the analysis was taken
between November 9, 2011, and March 21, 2012, for a total of 125.9 live
days, amounting to an exposure of 5.04 kgyr. Digitized charge pulses from the
detectors are analyzed with the software
tool Gelatio [18] according to the Gerda standard
procedure [19].
The pulse amplitude is reconstructed offline by applying an approximated Gaussian
filter with an integration time of 5 s (which is sufficient to avoid losses due to
ballistic effects).
Events generated by discharges or due to electromagnetic noise are
rejected by using a set of
quality cuts.
Due to the low counting rate,
the data set has a negligible contamination of pile-up events. The
combined efficiency of the trigger and of the
offline data processing is practically 100% above 100 keV. Similarly, no loss of
physical events is expected from the application of the quality cuts, as
deduced by dedicated Monte Carlo studies and by the analysis of pulser data.
Events that are in coincidence with a valid veto signal from the muon detector and
events having a signal in more than one HPGe detector are excluded
from the analysis. The time window for the coincidence between the muon
detector and the HPGe detectors was set to 8 s while that between different
HPGe detectors was set to a few s. Due to the very low muon flux
in the Gran Sasso laboratory, the dead time induced by the
muon veto is negligible.
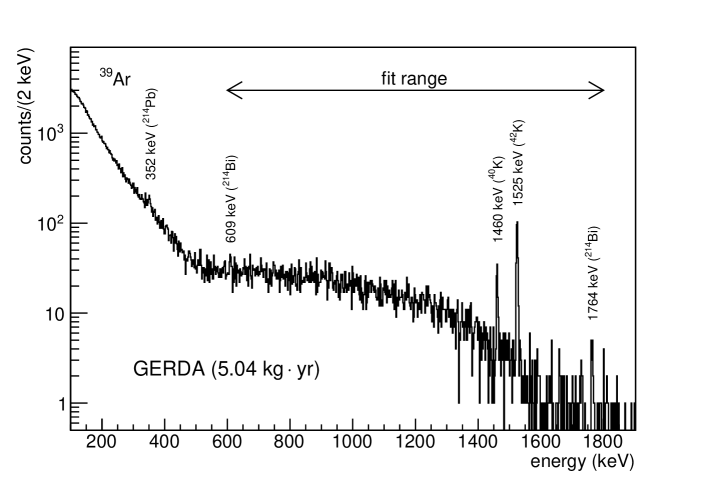
Given the half-life of the decay reported in the literature (about 1.5 yr), the anticipated count rate of the enrGe detectors is about 100 counts/day in the entire energy range up to =2039 keV. Since the detectors are submerged in LAr, the radioactive decay of 39Ar, which is a long-lived emitter produced by cosmogenic activation of natural argon in the atmosphere, gives a large contribution up to its -value of 565 keV. In fact, the low-energy spectrum is dominated by these particles and their Bremsstrahlung photons, which account for about 1000 counts/day above 100 keV. The decay is expected to be the major contributor in the energy spectrum above the end-point of the 39Ar spectrum. For this reason, the analysis of the decay is performed in the range between 600 keV, which is comfortably above the end-point of the 39Ar spectrum, and 1800 keV. The sum spectrum of the six enrGe detectors considered in this work is displayed in figure 2. The analysis range contains 8796 events in total. The probability for a decay taking place in the active volume of the enrGe detectors to produce a total energy release between 600 and 1800 keV is about 63.5%; the energy range above 1800 keV is practically insensitive to the signal, as the probability for a decay to produce an energy release in this region is . These estimates are based on the Monte Carlo simulation of decays in the Gerda detectors as described in section 4. Hence, the energy region chosen for the analysis is well suited for the study of the decay signal.
4 Data analysis
4.1 Statistical treatment and fit model
The experimental spectra of the six diodes are analyzed following
the binned maximum likelihood approach described in [20]. The analysis
region is divided into 40 bins, each 30 keV wide. A global model
is fitted to the observed energy spectra. The model contains
the decay of 76Ge and
three independent background contributions, namely 42K, 214Bi and
40K. The presence of these background sources is established by
the observation of their characteristic lines: 1525 keV from
42K; 1460 keV from 40K; 609 keV and 1764 keV from 214Bi;
352 keV from 214Pb (progenitor of 214Bi).
42K is a short-lived emitter (= 3525 keV,
= 12.6 h) which is present in Gerda as a progeny of the long-lived
42Ar (= 599 keV, = 32.9 yr). 42Ar is a trace
radioactive contaminant expected in natural argon and is produced by cosmogenic
activation. 214Bi from the 238U decay series and 40K are
emitters from the environmental radioactivity.
A few more candidate lines have been identified in the Gerda spectrum [10], which indicate the presence of small additional
background contributions: in particular 208Tl and 228Ac
from the 232Th decay series, and 60Co. However, most of
the candidate lines have either a poor statistical significance and/or
are seen in some detectors only. Given the lack of discriminating power in the
data, the background contributions other than 42K, 214Bi and 40K
are not included in the fit. However, their possible impact on the extracted
half-life is included in the systematic uncertainty, as discussed
in section 4.2; their cumulative contribution to the background
is estimated to be of a few percent.
The half-life of the decay is common in the fit to the six spectra
of the enrGe detectors.
The intensities of the background components are independent
for each detector. The active mass and the 76Ge abundance of each detector
are also left free in the fit; they are treated as nuisance parameters and
integrated over at the end of the analysis.
The shapes of the energy spectra for the model components (signal and
three backgrounds) are derived by a Monte Carlo simulation for each detector individually.
The simulation is performed using the MaGe framework [21] based on
Geant4 [22]. Assumptions have to be made in the
Monte Carlo simulation about the location and the primary spectrum of each
component of the model. The spectrum of the two electrons emitted in the
decay of 76Ge is sampled according to the distribution
of [3] that is implemented in the code
decay0 [23]. Electrons are propagated in the Gerda simulated
setup by MaGe and the total energy released in the active mass of
the enriched detectors is registered.
The 42K activity is uniformly
distributed in the liquid argon volume. The decay products of the decay
of 42K are taken into account as the initial state in the simulation.
However the energy deposit in the detectors is mainly given by the
1525 keV -ray (full energy peak and Compton continuum):
the contribution due to the particles is small (less than a few percent)
with respect to the 1525 keV -ray. The actual position of the 40K
and 214Bi emitters contributing to the Gerda spectrum is not
known in detail: the assumption is made in the Monte Carlo of “close sources”.
The ratio of the intensities of the 214Bi lines
observed in the experimental spectrum is consistent with such an assumption.
The impact on
due to the lack of knowledge about the source position – which
affects the peak-to-Compton ratio – is accounted as a systematic
uncertainty. The effect of muon-induced events that are not accompanied by a
veto signal, e.g. due to inefficiency, is estimated to be in the
energy range of this analysis.
The spectral fit is performed using the Bayesian Analysis Toolkit
Bat [24]. A flat distribution between 0 and yr is
taken as the prior probability density function (pdf) for .
The prior pdf for the active mass fraction of each
detector is modelled as a Gaussian distribution, having mean value
and standard deviation according to the measurements performed in
[13]. The analysis accounts for the fact that the uncertainties
on the active masses are partially correlated, because of the experimental procedure
employed for the measurement. Uncertainties on are split into
an uncorrelated term which is specific of each detector and a common
correlated term. The prior pdf for the 76Ge isotopic abundance
for each detector
is also a Gaussian, having mean value according to the earlier measurements
reported in [10]. The uncertainty of is
between 1% and 3% for the single detectors.
It was estimated from the dispersion of independent measurements performed with
isotopically enriched material; this dispersion is much larger than the quoted
uncertainty of each individual measurement.
The fit has 32 free parameters: one common value for the half-life and
31 nuisance parameters. The nuisance parameters are the common term which describes
the correlated uncertainty of the active masses plus five independent
variables for each of the six detectors (active mass, 76Ge abundance and three background components). The detector parameters used for
the prior pdf’s are summarized in table 1.
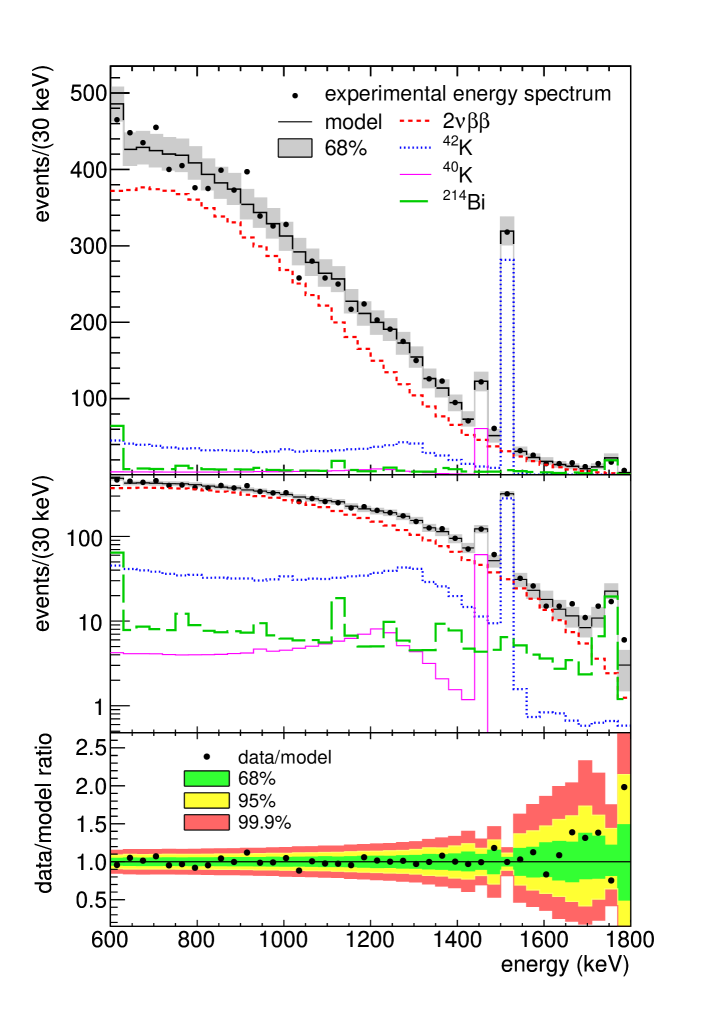
Figure 3 shows experimental data together with the best fit model for the sum of the six detectors. The analysis energy window contains 8796 events. The best fit model has an expectation of 8797.0 events, divided as follows: 7030.1 (79.9%) from the decay of 76Ge; 1244.6 (14.1%) from 42K; 335.5 (3.8%) from 214Bi; and 186.8 (2.1%) from 40K. The individual components derived from the fit are also shown in figure 3. The signal-to-background ratio in the region 6001800 keV is on average , which is much better than for any past experiment which observed the decay of 76Ge. The best ratio achieved so far for 76Ge was approximately by HdM [17]. The model is able to reproduce well the experimental data, as shown in the lower panel of figure 3. The -value of the fit derived from the procedure of [25], is .
All nuisance parameters are eventually integrated over in order to derive the posterior pdf for the half-life. The distribution is nearly Gaussian; the best estimate of the half-life is
| (1) |
(fit error only). This uncertainty is calculated as
the smallest interval containing 68% probability of . It
includes the uncertainty induced on by the nuisance parameters
of the fit and accounts for parameter correlations.
Active masses and 76Ge isotopic abundances drive the fit uncertainty
on : if these parameters were known without uncertainties, the
uncertainty from the fit would be about yr.
| detector | total mass | active mass | 76Ge isotopic | |
|---|---|---|---|---|
| (g) | (g) | abundance (%) | ( yr) | |
| ANG2 | 2833 | 246812189 | 86.62.5 | |
| ANG3 | 2391 | 207011877 | 88.32.6 | |
| ANG4 | 2372 | 213611679 | 86.31.3 | |
| ANG5 | 2746 | 228110982 | 85.61.3 | |
| RG1 | 2110 | 190810972 | 85.52.0 | |
| RG2 | 2166 | 18009965 | 85.52.0 |
As a cross-check, the same procedure is run for each detector separately. The resulting values are summarized in table 1; they are mutually consistent within their uncertainties (/ = 3.02/5).
4.2 Systematic uncertainties
| item | uncertainty on | |
| (%) | ||
| non-identified background components | ||
| energy spectra from 42K, 40K and 214Bi | ||
| shape of the decay spectrum | ||
| subtotal fit model | ||
| precision of the Monte Carlo geometry model | ||
| accuracy of the Monte Carlo tracking | ||
| subtotal Monte Carlo | ||
| data acquisition and selection | ||
| Grand Total | ||
The items which are taken into account as possible systematic
uncertainties of and which are not included in the fitting procedure
are summarized in table 2. They can be
divided into three main categories: (1) uncertainties related
to the fit model (choice of the components, shape of input spectra); (2) uncertainties
due to the Monte Carlo simulation regarding the precision of the
geometry model and the accuracy of the tracking of particles;
(3) uncertainties due to data acquisition and handling. The latter term
turns out to be negligible with respect to the others. The most relevant
items from table 2 are briefly discussed in the following.
Additional background components that are not accounted for in the fit model
might be present in the Gerda spectrum (see ref. [10] for a list
of the -ray lines detected in the Gerda spectrum and of the corresponding
intensities).
Due to the large signal-to-background ratio and the limited exposure
these background components cannot be identified unambiguously.
The uncertainty arising from such possible contributions is estimated to
be . Since any further background component would lead to
a longer , this uncertainty is asymmetric.
It is estimated by performing a fit with the contributions from
60Co, 228Ac, and a flat background added to the model.
These additional components are treated in the same way as the “standard”
background components (42K, 40K, and 214Bi).
The spectra from 60Co and 228Ac are simulated by Monte Carlo
assuming close sources and one additional parameter for each detector
and each additional background contribution is included in the fit.
Also for the flat background an individual contribution is considered for
each detector. The flat component describes the contribution coming
from 208Tl decays from the 232Th chain: given the small number
of events expected in the analysis energy window, this contribution can
be roughly approximated to be constant.
To a first approximation, also other possible non-identified
background components can be accounted by the constant contribution to the
model.
The systematic uncertainty on due to the uncertainties in the
spectra of the standard background components (42K, 40K, and 214Bi)
is estimated to be 2.1%. It is evaluated by repeating the analysis with
different assumptions on the position and distribution of the sources and
with artificial variations (e.g. via a scaling factor) of the ratio between the
full-energy peaks and the Compton continua.
The primary spectrum of the decay which is fed
into the Monte Carlo simulation is generated by the code decay0.
Decay0 implements the algorithm described in [3], which
is based on [27, 28].
The decay distributions of [3] are in
principle more precise than those based on the Primakoff-Rosen
approximation [29]. They
have been cross-checked against the high-statistics data of the Nemo
experiment for several nuclei: 82Se, 96Zn and
150Nd [30]. The spectrum
derived by the Primakoff-Rosen
approximation was used in earlier works
with 76Ge, like [31].
When the present analysis is re-run by
using the formula of [31], the result is
stable within 1%.
The uncertainty related to the MaGe Monte Carlo simulation
arises from two sources: (1) the implementation of the experimental geometry into
the code (dimensions, displacements, materials); and (2) the interaction of
radiation with matter (cross sections, final state distributions) which is
performed by Geant4. These items are evaluated to be 1% and 2%,
respectively. The estimated contribution due to the particle tracking is
based on the fact that electromagnetic physics processes provided by Geant4
for -rays and e± have been systematically validated
at the few-percent level in the energy range which is relevant for -ray
spectroscopy [32]. In this particular application
the Monte Carlo uncertainty is mainly due to the propagation
of the external -rays: the -decay electrons generated in the
germanium detectors have a sub-cm range and they usually deposit their entire
kinetic energy, apart from small losses due to the escape of Bremsstrahlung or
fluorescence photons.
The combination in quadrature of the contributions reported in table 2 sums up to , corresponding to yr.
5 Results and conclusions
The half-life of the decay of 76Ge was derived from the first data from the Gerda experiment at the INFN Gran Sasso Laboratory. Gerda operates HPGe detectors enriched in 76Ge directly immersed in liquid argon. The analysis has been carried out on the data collected with six enrGe detectors (14.6 kg total weight) during 125.9 live days by fitting the energy spectra with a comprehensive model. The best estimate of the half-life of the decay is
| (2) |
with the fit and systematic uncertainties combined in quadrature.
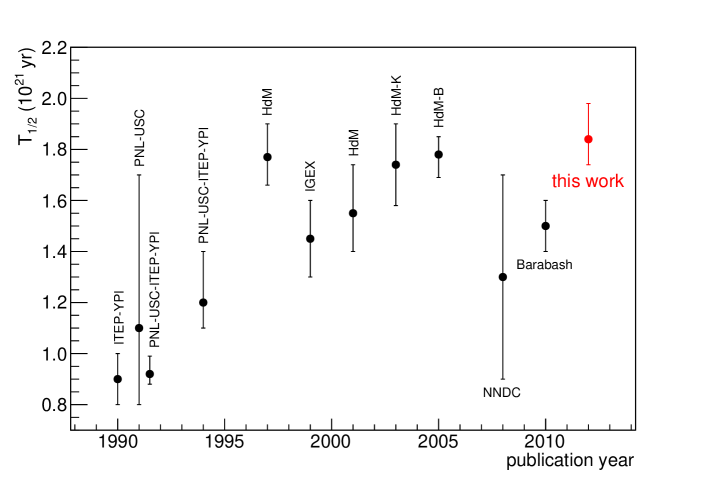
The half-life is longer than all previous measurements reported in the literature. A summary
of the results of 76Ge from earlier experiments vs.
publication year is displayed in figure 4. The figure includes
nine measurements published between 1990 and
2005 and two weighted averages. A trend towards longer values
reported by the most
recent (and lowest background) experiments is clearly seen. The Gerda result
is in better agreement with the two most recent results of [31, 37]
that are based on the re-analysis of the HdM data666If
were as short as yr reported in [2],
the decay of 76Ge would account for nearly all counts detected in the range
600–1800 keV (expected: 8782.7, detected: 8976), thus leaving almost no
space for any other background source in Gerda.. The fact that the half-lives
derived in the more recent works and particularly in this one
are systematically longer is probably related to the superior signal-to-background
ratio, which lessens the relevance of the background modelling and subtraction.
Thus the total Gerda uncertainty is comparable to what was achieved by
HdM, in spite of the much smaller exposure.
The uncertainty of the Gerda result can be further reduced in the future by
accumulating more exposure
and by performing a new and more precise measurement of the active mass of
the detectors. Large data sets will reduce also the
uncertainty due to the fit model, as background components can be
better characterized and constrained by the (non-)observation of lines.
Using phase space factors from the improved electron wave functions reported in
[39], the experimental matrix element for the decay of
76Ge calculated with the half-life of this work is
NME MeV-1.
The present value for NME2ν is 11 % smaller than that used in
[5], which compares the matrix elements
for and decays.
Ref. [5] also shows a relation between the
two matrix elements for QRPA calculations of 76Ge. According to this,
the new value for NME2ν results in an increase of the
predicted half-life for the by about 15%, which is well within
the present uncertainty of the model calculation.
The nuclear matrix elements of the decay of 76Ge estimated
from the charge exchange reactions (d,2He) and
(3He,t) are
MeV-1 [7] and
MeV-1 [8], respectively. They both seem to be higher
than the value reported in this work, but consistent within the uncertainties.
The Gerda collaboration thanks the Directors and the staff of the Laboratori Nazionali del Gran Sasso for their continuous strong support of the experiment.
We would like to thank Prof. V.I. Tretyak for help and suggestions about the modelling of the energy spectrum of the decay.
References
References
- [1] Avignone III F T, Elliott S R and Engel J 2008 Rev. Mod. Phys.80 481 Gomez-Cadenas J J et al2012 Riv. Nuovo Cimento 35 29 Vergados J D, Ejiri H and Simkovich F 2012 Rep. Prog. Phys. 75 106301 Bilenki S M and Giunti C 2012 Mod. Phys. Lett. A 27 1230015 Schwingenheuer B 2012 “Status and prospects of searches for neutrinoless double beta decay”, submitted to Annalen der Physik, preprint arXiv:1210.7432
- [2] Barabash A S 2010 Phys. Rev.C 81 035501
- [3] Tretyak V I and Zdesenko Yu G 1995 At. Data Nucl. Data Tables 61 43
- [4] Tretyak V I and Zdesenko Yu G 2002 At. Data Nucl. Data Tables 80 83 Ackerman N et al(EXO Collaboration) 2011 Phys. Rev. Lett.107 212501, arXiv:1108.4193v2 Gando A et al(KamLAND-Zen Collaboration) 2012 Phys. Rev.C 85 0455504, arXiv:1201.4664v2
- [5] Rodin V A, Fässler A, Šimkovic F and Vogel P 2006 Nucl. Phys.A 766 107; erratum: 793 (2007) 213
- [6] Šimkovic F, Fässler A, Rodin V, Vogel P and Engel J 2008 Phys. Rev.C 77 045503 Šimkovic F, Hodak R, Fässler A and Vogel P 2011 Phys. Rev.C 83 015502 Caurier E, Nowacki F and Poves A 2012 Phys. Lett.B 711 62 Barea J and Iachello F 2009 Phys. Rev.C 79 044301 Suhonen J and Civitarese O 2012 J. Phys. G: Nucl. Part. Phys.39 085105 Civitarese O and Suhonen J 2005 Nucl. Phys.A 761 313
- [7] Grewe E-W et al2008 Phys. Rev.C 78 044301
- [8] Ties J H et al2012 Phys. Rev.C 86 014304
- [9] Gerda Proposal to LNGS 2004 http://www.mpi-hd.mpg.de/gerda/
- [10] Ackermann K-H et al(Gerda Collaboration) 2012 “The Gerda experiment for the search of decay on 76Ge”, submitted to Eur. Phys. J. C
- [11] Günther M et al1997 Phys. Rev.D 55 54
- [12] Morales A 1999 Nucl. Phys.B. Proc. Suppl. 77 335
- [13] Barnabé Heider M 2009 “Performance and stability tests of bare high purity germanium detectors in liquid argon for the Gerda experiment”, Ph. D. thesis, U. Heidelberg, Germany; available at http://www.ub.uni-heidelberg.de/archiv/9551
- [14] Barnabé Heider M, Cattadori C, Chkvorets O, di Vacri A, Gusev K, Schönert S and Shirchenko M 2008 IEEE Nuclear Science Symposium, Oct 19-25, N68-7
- [15] Riboldi S et al2010 Proc. IEEE Nuclear Science Symposium and Int. Workshop on Room Temperature Semiconductor Detectors, Oct. 30 - Nov. 6, 1386
- [16] Morales J and Morales A 2003 Nucl. Phys.B Proc. Suppl. 114 141
- [17] Klapdor-Kleingrothaus HV et al(Heidelberg-Moscow Collaboration) 2001 Eur. Phys. J. A 12 147
- [18] Agostini M, Pandola L, Zavarise P and Volynets O 2011 JINST 6 P08013
- [19] Agostini M, Pandola L and Zavarise P 2012 J. Phys. (Conf. Ser.) 368 012047 Agostini M 2012 Ph.D. thesis, Tech. U. Munich, Germany; in preparation
- [20] Caldwell A and Kröninger K 2006 Phys. Rev.D 74 092003
- [21] Boswell M et al2011 IEEE Trans. Nucl. Sci. 58 1212
- [22] Agostinelli S et al(Geant4 Collaboration) 2003 Nucl. Instrum. MethodsA 506 250 Allison J et al(Geant4 Collaboration) 2006 IEEE Trans. Nucl. Sci. 53 270
- [23] Ponkratenko O A, Tretyak V I and Zdesenko Yu G 2000 Phys. Atom. Nuclei 63 1282
- [24] Caldwell A, Kollar D and Kröninger K 2009 Comput. Phys. Comm. 180 2197
- [25] Beaujean F, Caldwell A, Kollar D and Kröninger K 2011 Phys. Rev.D 83 012004
- [26] Aggarwal R and Caldwell A 2012 Eur. Phys. J. Plus 127 24
- [27] Doi M, Kotami T, Nishira H, Okuda K and Takasugi E 1981 Progr. Theor. Phys. 66 1739 Mohapatra R N and Takasugi E 1988 Phys. Lett.B 211 192 Burgess C P and Cline J M 1993 Phys. Lett.B 298 141 Carone C D 1993 Phys. Lett.B 309 85
- [28] Blatt J M and Weisskopf V F 1963 Theoretical Nuclear physics 7th Ed. (New York: John Wiley)
- [29] Primakoff H and Rosen S P 1959 Rep. Prog. Phys. 22 121
- [30] Arnold R et al(NEMO Collaboration) 1998 Nucl. Phys.A 636 209 Arnold R et al(NEMO Collaboration) 1999 Nucl. Phys.A 658 299 Arnold R et al(NEMO Collaboration) 2000 Nucl. Phys.A 678 341 Arnold R et al(NEMO Collaboration) 2006 Nucl. Phys.A 765 483 Argyriades J et al(NEMO Collaboration) 2009 Phys. Rev.C 80 032501
- [31] Dörr C and Klapdor-Kleingrothaus H V 2003 Nucl. Instrum. MethodsA 513 596
- [32] Amako K et al2005 IEEE Trans. Nucl. Sci. 52 910 Poon E and Verhaegen F 2005 Med. Phys. 32 1696 Cirrone G A P, Cuttone G, Di Rosa F, Pandola L, Romano F and Zhang Q 2010 Nucl. Instrum. MethodsA 618 315
- [33] Vasenko A A et al1990 Mod. Phys. Lett. A 5 1299
- [34] Miley H S et al1990 Phys. Rev. Lett.65 3092
- [35] Avignone F T et al1991 Phys. Lett.B 256 559
- [36] Avignone F T et al1994 Prog. Part. Nucl. Phys. 32 223
- [37] Bakalyarov A M, Balysh A Y, Belyaev S T, Lebedev V I and Zhukov S V 2005 Phys. Part. Nucl. Lett. 2 77; Pisma Fiz. Elem. Chast. Atom. Yadra 2 21, preprint arXiv:hep-ex/0309016
- [38] Pritychenko B 2008 Nuclear Structure 2008 June 3-6 2008, East Lansing, MI
- [39] Kotila J and Iachello F 2012 Phys. Rev.C 85 034316