A Conversation with David Findley
Abstract
David Findley was born in Washington, DC on December 27, 1940. After attending high school in Lyndon, Kentucky, he earned a B.S. (1962) and M.A. (1963) in mathematics from the University of Cincinnati. He then lived in Germany, studying functional analysis under Gottfried Köthe, obtaining a Ph.D. from the University of Frankfurt in 1967. Returning to the United States, he served as a mathematics professor at the University of Cincinnati until 1975. Having transitioned from pure mathematics to statistical time series analysis, Findley took a new academic position at the University of Tulsa, during which time he interacted frequently with the nearby research laboratories of major oil companies and consulted regularly for Cities Service Oil Company (now Citgo). In 1980 he was invited to lead the seasonal adjustment research effort at the U.S. Census Bureau, and eventually rose to be a Senior Mathematical Statistician before his retirement in 2009. In 1966 he married Mary Virginia Baker, and they currently live in Washington, DC.
David Findley has published more than 40 journal articles and book chapters, as well as dozens of technical reports and conference proceedings, many of which are heavily cited and influential. He has also published two edited volumes (1978 and 1981) that have had a substantial impact on the field of time series analysis. Numerous honors and awards have accrued to him, including ASA Fellow (1987), the Julius Shiskin award (1996) and the U.S. Department of Commerce Gold Medal (1997).
doi:
10.1214/12-STS388keywords:
.abstractwidth348pt \setattributekeywordwidth348pt
and
The initial conversation between David Findley, Scott Holan and Tucker McElroy took place on July 13, 2010 at the U.S. Census Bureau. Holan and McElroy later obtained clarifications of certain points from David Findley during the following year.
1 Education
McElroy: Hello, David. We are thankful to have the opportunity to discuss your life and career. Could you describe for us the early influences that led you to pursue a career in mathematics?
Findley: In high school I found algebra and geometry enjoyable and interesting. I found out decades later that many of my relatives were mathematics teachers, including one who taught in Suitland High School, not far from the U.S. Census Bureau (USCB). However, my plan was to study physics, and I decided to become a mathematics major only when I found out that the mathematics department at the University of Cincinnati would let me take advanced calculus and linear algebra before completing the basic calculus sequence, whereas the undergraduate program chair of the Physics Department would not accept the summer version of the general physics course as an adequate prerequisite for the upper-level physics courses that I wanted to take my sophomore year. By majoring in mathematics, I was able to take the physics courses I wanted, including a graduate level electrodynamics course my senior year, along with enough graduate mathematics courses that I was prepared to complete the master’s program in mathematics a year later.
McElroy: I see; but this was in Cincinnati, whereas you were born in Washington, DC.
Findley: I spent the first 12 years of my life in Washington DC, but moved with my family to Dayton, Ohio, which is close to Cincinnati.
Holan: So your interests in mathematics primarily began in high school?
Findley: No, I was interested in physics. I mean, I enjoyed mathematics, but I was set on physics from an early age. Perhaps because I had been very impressed by the age of four or five by the atomic bomb, having seen pictures of it on the front page of the newspaper.
Holan: That leads to our next question: why you chose the University of Cincinnati. Did you consider any other schools, such as The Ohio State?
Findley: I only looked at the University of Cincinnati (UC), because a high school counselor had recommended it. He knew that its College of Engineering had a strong reputation, and assumed that its Physics Department would be equally strong, which it wasn’t at that time.
Beyond my getting a solid mathematics background, a few other circumstances there also had a large impact. The Math Department’s flexibility continued into graduate school. Because of my interest in physics, I was interested in Hilbert space theory. There was no expert in functional analysis on the faculty, but I and two more senior graduate students were allowed to give ourselves a reading course in the area with nominal faculty supervision, working our way through the masterful monograph by Riesz and Nagy RiNa55 .
Then I was permitted to write a master’s thesis in the area on the topic I chose, expositing a Russian mathematician’s paper on operator representations, generalizing the representation formulas for symmetric and unitary operators, which generalize the representation formulas for symmetric matrices and unitary matrices. As a consequence, the first time I encountered the backshift operator in time series analysis and the Cramér integral representation of stationary processes, I recognized them as special cases of unitary operator representations. This led me to conclude that I had an advantageous background for time series analysis, which led me (years later) to choose this as my area of statistics.
My contacts with Germany also came from UC. Freshman physics majors were required to take German, and—perhaps because of Cincinnati’s German heritage—there were outstanding teachers in the German Department. After three semesters of German courses, I felt I had a solid foundation for studying in Germany, when later the idea came to me of combining my desire to live in Europe with my desire to get a Ph.D. in mathematics.
Fortunately, for me, the Mathematics Department in Cincinnati had a professor from Germany named Arno Jaeger, who knew the functional analyst in Germany I had wanted to work with, Gottfried Köthe in Heidelberg. Jaeger also knew a German mathematician at the University of Maryland in College Park, who could offer me a research assistantship after I learned that Köthe would be in College Park for the 1963–1964 academic year.
McElroy: After the University of Cincinnati, you held a research assistant position at the University of Maryland. What sort of research were you doing at the time, and did this have any influence on the problems you would later consider in your career?
Findley: The research assistant position had variable duties depending on who you were working for. I marked test papers for a first year graduate course and proof-read a Ph.D. dissertation. At Professor Köthe’s request, I presented an exposition of a recently published paper by two Japanese mathematicians in the Functional Analysis seminar series that ran for decades in the home of Professor John Brace in College Park. Their paper provided a complicated counter-example to a long-standing open question. Later in Germany, I learned that seminar presentations like this were the main filter used by professors to select Ph.D. dissertation students.
Holan: When you were at the University of Maryland (UMD), were there any young professors there with whom you came into contact?
Findley: There were two graduate students who showed the rest of us what it was like to be really gifted! Simon Levin and James Yorke; James has become very well known for his work in chaotic systems theory. He was a graduate student there, and he was then hired after graduation by UMD. I know the time series analysts at Maryland, but they came later, and I got to know them by giving seminars at the department. That is where I met my future co-authors Ching-Zong Wei and Benedikt Pötscher, who later left UMD—but who were there at the time that I started giving seminars.
Holan: At the time you were a Ph.D. student, was it common to go study abroad?
Findley: My parents had traveled in Europe, and seemed to enjoy it a lot, and I felt that my German language training was solid enough that I probably would survive. In Heidelberg there were a number of foreign students, and also other mathematics students from the United States. But, I was the first US citizen to get a doctorate from the Faculty of Natural Sciences of the University of Frankfurt.
Holan: Were your classes in German or in English?
Findley: German; keep in mind that mathematics is probably the easiest subject to study in a foreign language. The vocabulary is pretty limited and pretty predictable in its forms!
McElroy: It seems that during the sequence of your studies, there was an interval of time between Heidelberg and Frankfurt, at the University of Cincinnati.
Findley: Yes. I came back to the US for various personal reasons, including a death in the family, and also to earn enough money to marry my fiancée. Also, I wanted some time to decide whether I wanted to continue in mathematics, or return to physics.
McElroy: Your Ph.D. work in Germany lasted three years. What was your dissertation about?
Findley: It concerned the study of a quite abstract generalization—given in papers in 1963 and 1964 by W. A. J. Luxembourg and A. C. Zaanen—of the general class of vector space of real-valued sequence spaces defined by Köthe and his Habilitation supervisor Otto Toeplitz in a 1934 paper. I was able to prove analogs, in this new abstract setting, of several results established by Köthe in a series of papers from 1935 to 1951, results that made these sequence spaces quite influential in the development of the theory of locally convex topological vector spaces. The only part of this work I have been able to use in my time series research is a characterization I learned then of compact sets in the vector space of absolutely summable sequences. This played a minor clarifying role in a later paper with Benedikt Pötscher and Ching-Zong Wei on almost stationary processes FinPotWei01 , FinPotWei04 .
Holan: So, you decided to go back to the University of Cincinnati after graduation? Was this your first job out of school?
Findley: Yes, I felt it was an honor to be invited back. I knew and liked the department, and also my wife, who is a violinist, wanted to continue studying with the violin teacher she previously had at the College-Conservatory of Music at the University of Cincinnati. So it suited both of us.
Holan: So, at the time they just invited you back to apply? Today it seems to be much more of an adventure finding a job out of school.
Findley: It was a slightly different time. Perhaps a year or two after I was back at the University of Cincinnati, the job market for new Ph.D.s in mathematics became quite tight. However, there were many jobs available at the time I applied. In fact, I was also encouraged to apply for a position at the University of Maryland; so, I wasn’t worried about opportunities in mathematics.
2 Transition to Statistics
Holan: Your return to Cincinnati seems to mark the time you transitioned to time series analysis. Given your physics interests and the inherent dynamics of many physical processes, it seems to be a natural development. Where did you learn time series analysis?
Findley: I was self-taught. I found that when I began writing research papers in mathematics that the audience, perhaps because of the area in which I wrote my dissertation, was very small indeed and that the amount of effort necessary to write papers that would get into respected journals was so great that I became somewhat frustrated. Additionally, I felt that most mathematicians looked to the mathematics literature for stimulation for research, rather than anything outside mathematics. Some were even contemptuous of the mathematical work done in, say, econometrics and other disciplines. Now in Frankfurt, through singing together in a chorus, I had become friends with the young Professor of Stochastics, Hermann Dinges (each Full Professor had his own Institute then), with whom I had taken advanced seminars in Markov processes; he had suggested a research problem to me involving Wiener–Hopf factorization. So I was interested in stochastics, and therefore also in statistics. So after a year or two I started teaching statistics courses for engineering students, and knew of the book by Box and Jenkins BoxJen76 .
In 1973, at the invitation of the sole mathematical statistician in UC’s Mathematics Department, Manny Parzen and Grace Wabha gave a one day overview of time series analysis. From this overview I recognized that time series play an important role in many disciplines, and that the field uses mathematical tools that other statistical fields do not. I decided to become a time series analyst, and to start by reading books with a probabilist colleague who found the one day overview very stimulating. Grace Wahba recommended Ted Anderson’s 1971 book to us And71 , which we worked through very thoroughly.
Later, after I accepted an offer for a time series position at the Mathematics Department of the University of Tulsa (TU) in the Spring of 1975, I was asked to prepare a course for the fall semester based on David Brillinger’s 1975 monograph Bri01 . After reading his powerful presentation of the frequency domain perspective, I decided instead to give a semester-long series of lectures for Mathematics Faculty members on its contents, while presenting a more elementary two-semester course for the graduate students, many of whom worked in exploration seismology for local oil companies. I taught this two-semester course every year at TU, updating it annually with new material, such as state–space methods.
McElroy: What were your reasons for moving to TU?
Findley: Oh, they advertised the position in time series analysis, and that was what I wanted to do. Also, they already had three mathematicians on the faculty who had trained themselves in time series analysis—perhaps through consulting work for the oil company research labs in Tulsa. So, I knew I would have a community of people to work with. Additionally, they were willing to hire someone with no publications in time series analysis, because they were aware that a mathematician could become a competent time series analyst.
Holan: In addition to your colleagues, you also worked as a consultant at Cities Service Oil. Can you tell us a little about your experience there?
Findley: I should back up and mention that every mathematics professor there did consulting work, because it was available. The university thought it was a perfectly reasonable thing, as long as they did some other academic things. There were several major oil company research labs in Tulsa and neighboring cities, and oil companies have been quite at the forefront of using new technologies. They were among the first to use radioactivity as a measuring tool, using gamma rays in well logs to discover what was down there. So, there were interesting scientific problems to work on and, in the particular case of Cities Service, the university had been given a building which had belonged to the Carter Oil company. Von Neumann had consulted in this building, and it housed on one end most of the engineering college, and at the other end the Cities Service research laboratories, which the university leased to Cities Service. So I walked out the door at one end of the building and in the door of the other end, to consult, which was a very nice arrangement!
Also, I helped a geophysicist who was applying state space filtering methodology—Kalman filtering—to some geophysics problems. I worked on some problems related to time series methods and seismology. There were pure statistical issues—pure time series issues of a certain kind, arising from physical reasons. If you calculate wave propagation through a variety of media and assume everything is happening in one dimension, autoregressive processes seem very natural, since partial autocorrelations represent reflectivity coefficients, and anything that is forecastable represents noise, usually arising from echoes of a wave hitting the transition between geologic strata. Thus, anything that was predictable was noise, and hence prediction error filtering was important. I developed some time-varying methods for predicting fifty steps ahead—we were getting perhaps twenty-five hundred measurements a second in these seismograms, so fifty was a useful forecast interval.
Holan: Did any of that consulting work generate mathematical research?
Findley: The paper on my algorithm for time-varying forecasting for forecast error analysis was published in one of the symposium proceedings volumes from the two symposia I organized in Tulsa autokey10 , Fin81 , autokey11 . It had a different approach to looking at Levinson’s algorithm Lev47 . (Mostly known to statisticians through the special case independently discovered by Durbin Dur60 .) I was able to give a geometrical interpretation of it, which seemed possibly new at the time.
McElroy: Can you talk a bit about those symposia?
Findley: Yes, they were a great opportunity. My colleague J. B. Bednar suggested, after I had been at TU for a month or two, that I organize a symposium on time series analysis. There were now four people in the department interested in the subject, and I saw this as an opportunity to get in contact with the leading time series researchers in a number of different fields. This was an idea that was very exciting to me. I asked J. B. Bednar to contact a very respected electrical engineer at MIT, Alan Oppenheim, and ask if he would be willing to speak at the conference. Once he received an affirmative answer, I contacted Manny Parzen, and after he said yes, I contacted Henry Gray. After that we were launched, because it began to look very credible!
Akaike happened to be on sabbatical leave at Harvard; so I contacted him and he agreed to come. I wound up inviting people from geophysics, electrical engineering, exploration seismology—or seismology in geophysics—mathematics, astronomy, and statistics. I later discovered that there had been a very successful symposium in 1962 that Murray Rosenblatt organized at Brown University, whose proceedings had been published as a book by Wiley, and that the Tulsa symposium was the first thing like that, bringing people together from so many different fields. Therefore, there was really great interest in having such a symposium. Additionally, the first symposium was successful enough that, when three years later I organized another such symposium, things went very well from the beginning!
McElroy: Were there any econometricians at the symposium?
Findley: Yes: Clive Granger and Rob Engle, who shared the Nobel prize for economics in 2003. They gave very interesting talks, and were delightful, very well-informed and interesting contacts for later work.
Holan: Did you keep in contact with many of the people at the symposia?
Findley: Yes, indeed. When I later left TU and came to the Census Bureau, I lost contact with people from the geophysics and seismology community, but I certainly maintained contact with most of the statisticians who came. In statistics, there was Manny Parzen, Hirotugu Akaike, Henry Gray, G. S. Watson, Richard H. Jones, Doug Martin, David Donoho, William Dunsmuir, Will Gersch, Genshiro Kitagawa, Wayne Woodward and Mel Hinich. The electrical engineers Alan Oppenheim, Thomas Parks, John Makhoul and Jerry Mendel also attended, as well as the geophysicists Enders Robinson, Sven Treitel and Freeman Gilbert.
Will Gersch later came to USCB as an ASA/NSF-Census research fellow, with Genshiro Kitagawa as his research associate. Akaike, Genshiro and I worked together when I visited the Institute of Statistical Mathematics in Tokyo. My contact with Akaike was very long-lasting and very fruitful for me. Just about everyone I mentioned is someone I have benefited substantially from at later times, through contacts of one kind or another. Also Enders Robinson can be classified as both a time series analyst and a geophysicist; he has written a number of time series books Rob80 . His prediction error methods were very important for exploration seismology. Freeman Gilbert was there. Freeman is a very well-known seismologist whom David Brillinger has collaborated with. Sven Treitel, a leading exploration geophysicist, was there from Amoco. So it was a stellar experience for me to interact with these people!
3 At the Census Bureau
Holan: What led you to leave academia for a federal career? Maybe you could tell us a little about what the Census Bureau was like; for example, what the research environment was like and how your transition from academia transpired?
Findley: I knew of the Bureau’s reputation in the field of seasonal adjustment and the influence of its X-11 software. This gave me the sense that any research done by me or my group would be noted and considered by statistical offices and central banks around the world—a larger potential audience than exists for most academic papers. Also, I was sure that there would be support for implementing results of research in software designed for public use, making it much more likely that the results would be used in practice. This is in contrast to the situation with software developed in academia, which usually can only be used by its author. Thus, I felt I could have a greater practical impact by working at USCB than by staying in academia.
Finally, I knew from having lived there that the Washington, DC area was intellectually stimulating in the field of statistics, because there were a large number of statisticians there. I was looking forward to working with Bob Shumway at George Washington University (GWU), but he was on sabbatical leave at the University of California, Berkeley, and then accepted a position at Davis. So, Kirk Wolter of USCB wrote to a number of prominent time series analysts, two of whom recommended me to him. He then contacted me, and I came to the Bureau for an interview.
McElroy: It is interesting that your answer to that question is almost identical to the answer that Agustin Maravall gives for why he chose a career at the Bank of Spain, namely to develop and maintain a major software package.
Holan: So, in the early development of the software that came out of Census, were you the original programmer, or did you oversee the programming?
Findley: No, no; I was not one of the programmers. They had a programmer already hired when I came here. He was someone with a Master’s degree in mathematics, but he had no background in statistics, and therefore didn’t really understand what he was programming. I was lucky, very early on, that Brian Monsell showed up. Brian has outstanding programming ability, and also a keen interest in making software usable. Brian was able to work easily with lots of different operating systems and write good code, which programmers at SAS and other people who have translated his code have complimented. So, one needs good luck, and Brian’s coming along was good luck, as was Bill Bell’s being here, at the time!
Bill supervised much of the programming having to do with time series modeling. But, we didn’t start out programming. I mean, we started out just trying to respond to whatever the needs seemed to be. Our ultimate goal was to improve the practice of seasonal adjustment at the Census Bureau and elsewhere. USCB was still using X-11 then, and hadn’t even made the switch to X-11-ARIMA, so working on that transition was important, and other things came along that also seemed important. Later we realized that there were quite significant things that X-11-ARIMA couldn’t do, namely estimate regression functions jointly with the ARIMA models so that you could estimate level shifts and other outliers, as well as other kinds of user-defined regressors for special effects.
Holan: Given the production needs at the Census Bureau, how much time did you spend doing research? Was it your responsibility to ensure that the research have an influence on production?
Findley: Yes, it was my responsibility. By way of background, in 1978 and then in 1980, the Census Bureau had held two large seasonal adjustment conferences with many distinguished speakers, including Clive Granger. As part of a way of building up momentum for a new time series center at the Census Bureau, they had hired two statisticians—one Master’s degree statistician and one Ph.D. degree statistician—in addition to the programmer I mentioned earlier, and already had them working. Kirk Wolter, who knew time series analysis, as well as sample survey methodology, had been directing some work. So, when I arrived, I had to learn about seasonal adjustment myself! I knew that it existed as a subject and that it had connections with signal processing, but I had a learning curve to go through.
But to go back to your question: Kirk Wolter had established monthly meetings in which all the people in the Census Bureau interested in seasonal adjustment attended, and some topic that seemed to be of general interest was discussed. I found out, perhaps in the first week, that Wayne Fuller, who did consulting for the Census Bureau, had said that he would not work on seasonal adjustment until they started doing concurrent seasonal adjustment, namely using all of the data available every month, rather than forecasting seasonal factors from December of the year before. Thus, I had a mandate right away to make a strong case for concurrent seasonal adjustment. These monthly meetings, where the divisions discussed problems of interest to them, also provided an opportunity where we could respond to their problems; we could also present the research results we were obtaining on the smaller revisions you got to seasonal adjustments—smaller revisions after you recalculated the adjustment using later data—that came for most of the time series when you used all of the data available, rather than using forecasted seasonal factors from the December before.
This kind of idea, that you shouldn’t just use projected seasonal factors, had been a big stimulus to Estela Dagum to introduce ARIMA models to forecast ahead, so that you could at least use forecasted values as replacements for the data that you weren’t ready to use, or didn’t even have if it went past a certain point. So, these monthly meetings, which continued for several years, built up a rapport with the other groups in the Census Bureau. I think they may have gone on for ten years.
Holan: In those times, what was the day-to-day process like in terms of research versus production? For example, suppose you are sitting at your desk and you figure something out, on the topic of concurrent adjustment, and you say, “This really looks like what we need to do.” What was the process for getting things implemented in production back in those days?
Findley: It was a matter of talking about it, and presenting results in seminars. Also taking series from each one of the production groups there, and giving them the results for each one of their groups. Also, there were other things to talk about. The next big project that came along was due to someone who, without consultation or approval, seasonally adjusted the January value of a very important series, petroleum imports, that hadn’t been seasonally adjusted before because it didn’t exhibit stable seasonal characteristics. This happened when Shirley Kallek, the Associate Director for Economic Statistics, was out of town, and she decided that the published adjusted number had to be replaced with the unadjusted number. This indicated a different direction, which was embarrassing to the government. So she asked us to develop diagnostics to correctly ascertain when series were not good candidates for seasonal adjustment. That set off one of the veins of my work that has continued until I left the Census Bureau, and is still ongoing. So, diagnostics and model selection are the two most continuous veins of research that I have pursued during my years at the Census Bureau.
Holan: So—unusually for a federal employee—you’ve been able to visit numerous different places, and work with many different people, and spend a considerable amount of time away from the Census Bureau, sort of like an academic on sabbatical.
Findley: Yes; the thing I was most nervous about in leaving academia was giving up sabbatical leaves, because I had already had one and found it very fruitful to go away for a number of months to another place, and interact with other people and share an office with someone doing something completely different, but something that turned out to be interesting to me. It was broadening in some way. It is the international nature of seasonal adjustment work that to some extent led to my receiving invitations to go to other places. It was also Bill Bell’s presence here on the time series staff, being perfectly capable of taking over for me when I was away, which was probably more important in making it possible.
These visiting positions have always been productive for me, usually enabling me to complete research related to model selection that I couldn’t find time for at USCB. I have been especially fortunate to have more than one such visit to the Institute of Statistical Mathematics (ISM) in Japan and the Institute of Statistical Science of Academia Sinica in Taiwan. Both have strong research groups in many areas of statistics, superb libraries and other research resources, and contacts with other organizations, including statistical offices interested in seasonal adjustment.
Genshiro Kitagawa has always been my host at ISM, where Akaike had become director. On my first visit, he provided me with data to try out a slight modification of the order selection procedure for a vector autoregressive model-based ship autopilot, developed by him in collaboration with marine engineers. I gave an invited presentation on this work at the 1988 American Control Conference Fin88 . My future GWU Ph.D. student Jim Cantor was in the audience, and was stimulated to later ask me to direct his dissertation work on the recursive estimation of incorrect time series models CanFin06 .
I also worked with Yoshinori Kawasaki at ISM, primarily in conjunction with a series of conferences related to seasonal adjustment that alternated venues between Tokyo and Washington, DC over a six-year period.
At Academia Sinica, I worked mostly with my host and co-author Ching-Zong Wei, whose death from a rare disease ended a remarkable research career much too soon. I also interacted with the econometrician Jin-Lung Lin on various topics related to seasonal adjustment. He was at the Institute of Economics there, and is now Dean of the College of Management of Taiwan’s National Dong Hwa University in Hualien.
McElroy: Do you feel that the major goals of time series research at USCB have been met?
Findley: The major goal has been to improve seasonal adjustment practice at USCB and elsewhere. This has involved the development of new procedures, models, model selection procedures and diagnostics. Of course, one must evaluate these procedures for efficacy and practicality. Finally, it is necessary to implement successful innovations in software. Much of this work has proceeded incrementally, in response to urgently perceived needs or inadequacies with existing procedures or tools, or due to new opportunities for collaboration with other seasonal adjusters.
It was always assumed that we would, in the course of time, develop a new seasonal adjustment program and that we would make greater use of time series models, probably including the purely ARIMA model-based seasonal adjustment procedure of Hillmer and Tiao HilTia82 . George Tiao and his students have had a huge impact on the use of models in seasonal adjustment. When I arrived at the Census Bureau in 1980, his students Steve Hillmer and Bill Bell were here. Hillmer was finishing his year as an ASA/NSF-Census Research Fellow with Bill Bell as his Research Associate. Bill was also finishing the writing of his dissertation, which had path-breaking results on nonstationary signal extraction relevant to model-based seasonal adjustment. I was able to hire Bill, and with occasional input and contributions from me, he led the modeling developments for the next two decades and more. These efforts resulted in modeling innovations that were incorporated into the X-12-ARIMA seasonal adjustment program released by USCB in the 1990s BelHil84 . This software is widely used around the world.
Working with Brian Monsell and others, I led the development of the software’s new seasonal adjustment quality diagnostics, as well as model selection options concerned with transformations (such as logarithms) and with nonnested choices among candidate regressors for trading day and moving holiday effects.
The USCB plans to soon release the successor to X-12-ARIMA, which is named X-13 ARIMA-SEATS. Its new capabilities include the option to produce Hillmer–Tiao model-based adjustments, and to compare them with X-12-ARIMA adjustments using a common set of diagnostics. This should lead to a greater understanding of both traditional and model-based adjustments. The model-based adjustments will come from its incorporated version of the SEATS seasonal adjustment program, thanks to the collaboration of its designer, Agustin Maravall of the Bank of Spain. Equally vital to this undertaking has been the outstanding software development ability and statistical understanding of Brian Monsell, who now leads the time series group. He and Bill Bell were my most important hires.
4 Past, Present and Future Research
McElroy: Over your career you have made many contributions to model selection and seasonal adjustment. Of the different projects and papers you have worked on, are there any favorites that you have or that particularly stand out in your mind?
Findley: This is a question I might give a different answer to every time it is asked! Three papers come to mind in model selection. I have the feeling that the 1991 AISM paper Fin91N1 I did on counter-examples to BIC and other parsimonious model selection criteria has some value. It has been cited fairly often. What I showed there was that when you are working with models that are not correct, and you are making nonnested model comparisons, that one unneeded parameter’s estimate can cause problems for forecasting or parameter estimation, in general, that are significantly larger than the influence of another parameter that is not needed. In other words, we tend to think: if you have unneeded parameters, then the distribution to describe this is a distribution or something like this, and there is a kind of homogeneity to the effects of these unneeded parameters; but it is not true in the case of nonnested incorrect model comparisons.
Much of my research from early on has tried to address the situation of incorrect models, and I recommended the use of AIC at the Census Bureau, because there is some justification and demonstrable practical advantages for making comparisons between nonnested models with it. This is something that comes up often in seasonal adjustment, and I think in statistics in general. Additionally, there aren’t really systematic ways of addressing nonnested model comparisons.
I’m also very pleased with the 2002 JMVA paper FinWei02 I wrote with Ching-Zong Wei on a rigorous development of AIC for vector autoregressive models. There were some powerful new mathematical results that others have used, which were in that paper. But also the paper contains a precise theory of over-fitting, which says that if you have these unneeded parameters, they are going to corrupt the good results you might have obtained from these models, using an independent replicate of the data. In this situation, I was able to develop a theory of over-fitting, so that you can take the difference of the likelihood functions and use that as some kind of measure of over-fit. Mathematicians and statisticians talk about over-fitting, but here was a case where I could prove some results and come up with a rather precise measure—it is pretty theoretical, but at least it’s a handle on the concept of over-fitting, making it a precise concept.
A third paper that comes to mind is the one I just completed with Tucker, published in the 2010 JSPI special issue honoring Manny Parzen McEFin10 ; because, again, in one case it is another kind of likelihood ratio test for nonnested model comparisons. That paper is generally concerned with the problem of testing the forecasting performance of competing models—that is, if you have a statistical test that involves saying, “these two models are equally good at forecasting, one is not better than the other,” then you would like to have a test of some kind of this hypothesis. We analyze an in-sample measure of forecast error, and use as our null hypothesis that these two models forecast equally well, and were able to derive a test statistic, in particular an asymptotic distribution for the difference of the two forecast error measures—and a consistent estimate of the variance of this asymptotic distribution—which we could use to form a statistic you could use to test whether one model is better than the other.
I had started on this topic, in the context of likelihood ratio tests, in the early 1980s. I had obtained an asymptotic distribution for the likelihood ratio in the nonnested model case, having been inspired by the work of the econometrician Quong Vuong, who had done similar things for regression models, but I had never been able to find a consistent variance estimate for the asymptotic distribution, and Tucker and I were able to obtain that in our paper. Now, when we find time, we’re at work generalizing this to the vector autoregressive situation.
Those are the papers I like that are concerned with model selection. For seasonal adjustment papers, I particularly like papers that have had good expository value. I was invited to write a paper that would be the Journal of Business and Economics Statistics invited paper for the 1996 Joint Statistical Meetings Finetal98 , and I wrote that with Bill Bell and other staff members—Brian Monsell, Bor-Chung Chen and Mark Otto—and we really got a lot of ideas about seasonal adjustment and the role of models and model selection, and even estimation. It was a discussion paper, and that brought up a lot of other ideas. So, I regard that as a valuable paper.
I would like to mention the 2006 Journal of Official Statistics paper I did with Donald Martin on properties of time-domain filters, seasonal adjustment filters applied to nonstationary series that really account for the fact that we are working with a finite sample, and which examined the effects of phase delay FinMar06 . I am also very pleased with a paper that Catherine Hood and I wrote FinHOO00 , just setting out our procedures for seasonally adjusting a bunch of time series we have never seen before. Specifically, how we go about choosing program settings for them, or perhaps even deciding whether they should be seasonally adjusted at all. The paper was written for a conference sponsored by the Italian Statistical Office, where they gave out a dozen or so time series and asked people to analyze them. Subsequently, I have been very glad to have that paper available to hand out to people when I have taught seasonal adjustment courses.
I like the new trading day regressor that Brian Monsell and I came up with, which is described in our 2009 Journal of Official Statistics paper FinMon09 . It seems to do very well with stock series (e.g., inventories), better than the regressors we’ve had before. Akaike stressed to me the importance of models, and Bill Bell’s concentration on models from his education under George Tiao and George Box, has certainly reinforced the power of models to me. To convey statistical information, and good statistical practice, models are an extremely concentrated way of presenting information to people doing statistical work.
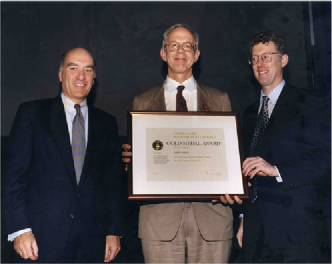
Holan: In 1987 you were elected Fellow of the American Statistical Association. Can you tell us a little bit about your award?
Findley: Yes, the award had particular meaning for me because, while I had had some coursework in stochastic processes in my Applied Mathematics Ph.D. studies, I had no formal training in statistics or time series analysis. The award confirmed for me that I had successfully established myself as a statistician and time series analyst. I was delighted when Alan Izenman came up to me the day after the award with a warm smile and handshake saying, “Now no one can say you aren’t a statistician!”
McElroy: Well, you are now retired from your position at the Census Bureau. Are there future plans for research, and are you still active in research? What sorts of things are you doing?
Findley: As I mentioned, I am interested in the research you and I are doing in extending our forecasting and likelihood ratio tests to the vector situation, at least for vector autoregressive models. I should have mentioned that a special aspect of this research is that the effect—at least when multi-step ahead forecasting is involved—of parameter estimation is taken into account in these tests, in a way that has not been done before with time series models. So I think the paper’s important for that reason, too—that it is kind of a breakthrough.
I hope someday we will find a way to understand what gain and phase function graphs mean for nonstationary time series: I think there is some hope for this when only one differencing is involved in transforming the data to stationarity. But we haven’t seen any reason to be optimistic under more complicated differencing operations! I have some other papers on model selection that I have never written up. I hope I’ll get around to writing those up, in time—mostly having to do with AIC, but for ARIMA models rather than AR models. Also I would like to look at other situations, say where you’re trying to decide “should I use a Weibull distribution or a logistic distribution to model a certain kind of data?” I had a project on that, where I got some pretty formulas, but never quite the theory needed to justify the formulas.
Holan: So, you’ve probably experienced a lot of changes in statistics over the years. What is your assessment of the state of statistics in general and the future of seasonal adjustment in particular?
Findley: I don’t feel qualified to comment on the state of statistics in general. But in terms of impact on statistics, the internet has been the most important development!—for disseminating data, for disseminating meta-data associated with the data, for disseminating software, for disseminating the results of research, and for maintaining contact with users. Brian Monsell gets many messages every month with seasonal adjustment questions; Tucker and I get messages from people we have taught seasonal adjustment courses to and other places, that sometimes turn into research problems and papers.
In seasonal adjustment, with the release of X-13 ARIMA-SEATS, we have just now gotten to the point where it is possible to compare the results of a model-based seasonal adjustment and a seasonal adjustment from the older X-11 filter methodologies. I think that will be valuable and that, from having one software package, we will learn more about both methods. We will be able to produce the adjustments easily and at the same time produce some diagnostics that make it easy to compare some aspects of the seasonal adjustments. Basically, you could say that if you run both methods and they give pretty similar results, you should feel very good and not think there is much to worry about; and if they produce rather different results, it would be very good if you could come up with some kind of understanding of why that is so. I think both methods have different strengths and different weaknesses, and so I think that this software will help improve the practice of seasonal adjustment.
I also believe that there is room for further variations on the use of these methods. When Akaike developed his BAYSEA program Aka80 , it essentially forecasted a moving window of data; you could set it to take four or five or more years of data, and it would produce a seasonal adjustment of that set of data, and then move to another interval. Additionally, it would take the center adjustment, from however many overlapping spans, as being the final adjustment; so there would be two years of data in this five year case, in which you would revise the seasonal adjustment. The econometrician David Hendry at Oxford, where I visited recently, is very keen on the idea that econometricians should, in many instances, be using moving windows to do the modeling and analyses of data that they want to do. Akaike did this in BAYSEA, that was a kind of structural modeling setup, but I think there is reason to utilize this approach in other cases. You need more than five years of data to estimate ARIMA coefficients, and perhaps seven or eight years of data to estimate ARIMA coefficients well, and you also need about that much data to estimate coefficients for trading day effects and moving holidays like Easter, so there is some limitation on how small our estimation window can be. But maybe there are some tricks we don’t know about in terms of improving parameter estimates in smaller samples.
I think there are still some interesting options to be explored in seasonal adjustment. I also think that the software that the National Bank of Belgium is developing for the European Statistical Office, which is intended to become an official seasonal adjustment software package for the European Statistical Office, could be of great benefit if it comes out to be as simple to modify and add to as the plan of Jean Palate, the person directing its development at the National Bank of Belgium. New diagnostics and new variations on ARIMA models or other models for seasonal adjustment could be implemented quickly, and tested, and retained if practice shows them to be valuable.
McElroy: On a different note, you have been in Washington, DC many years now. What was the intellectual culture like when you first came here, and how has it changed?
Findley: I think DC has for a very long time been an intellectually exciting place in the general sense, because there is a tremendous amount of scientific research done at the universities and the large industrial consulting firms that work on military projects. There is a large number of chapters of the Institute of Electronic Engineers; the Washington Statistical Society is very large, and has almost weekly seminars. Specifically for seasonal adjustment, there were more people active in seasonal adjustment research at the time I came here—at least outside the Census Bureau, that is to say. David Pierce and Bill Cleveland were at the Federal Reserve Board; Bob McIntyre was there along with some other people, as well as Stuart Scott, Tom Evans and Dick Tiller at the Bureau of Labor Statistics (BLS). So maybe things at BLS are like they were before.
But to speak for the Census Bureau, I think the recent arrival of Bob Groves to be the director and the coming of Rod Little to fill the newly restarted position of Associate Director for Research andMethodology, will be very exciting. These areworld-class statisticians in their various branches of work, both of whom have spent substantial amounts of time at the Census Bureau before, and are going to be very supportive of research of many different kinds, and very knowledgeable in terms of how they make budget decisions regarding research. I believe our time series staff is still quite strong, so I am quite optimistic about the continued stimulating intellectual atmosphere in the Census Bureau.
Holan: You brought up something interesting,namely that you developed a lot of software. Your background is mostly in theoretical mathematics, and then you developed software along the way, and did a lot of applied work. I think, in general, the field of statistics has changed over the last thirty years, with the greater emphasis on computing. Also, certainly upon entering the workplace today, one needs a different skill set than was the case twenty years ago. What do you see are the important things for people to learn in school, in order to be successful in this environment?
Findley: I think I can only speak to what the Census Bureau would like to see in young statisticians: some training in time series analysis, and some knowledge of a programming language—it could be C or something else, but more than just knowledge of a statistical package like SAS. Knowledge of R would be a great asset, because that is probably the most important proto-typing language in statistics now—I certainly think that is true for time series analysis. It would be great if people knew some sampling methodology too, which is taught irregularly at universities, as is time series. Experimental design would be a good thing. We’re always looking for people who can work on experimental design projects that come up at the Census Bureau in various contexts.
McElroy: Well, it’s been good talking to you. I know that some time ago you had a Statistical Science Conversation with Hirotugu Akaike, that you conducted in collaboration with Manny Parzen FinPar95 . Can you tell us a little about that interview?
Findley: It was wonderful to be able to work with Manny. It was my idea to have the interview, but Manny agreed to work with me as soon as I asked him. Manny was the person in the United States who discovered Akaike, who became aware of the work Akaike was publishing in Japanese journals, and of its very high quality and considerable interest. This is discussed in the interview, so I think the interview was substantially richer for Manny’s participation in it. It was a delight to have this kind of collaboration with Manny, whom I’ve known for a long time, and asked for assistance on certain other projects, but never done any joint research with.
I learned some interesting things from the interview. The statement about models being an extremely compressed and portable form of information, is something Akaike said in the interview. Another thing he said, was that he didn’t like vector autoregressive models, at least initially, because it’s so hard to make sense of all the coefficients. But, he discovered they were extremely powerful in applications, so he decided to like them! The other thing he said was that a visit he made to Princeton, where John Tukey was, at Tukey’s invitation, was very influential for him. He had been very theoretically based, his doctorate was in mathematics from the University of Tokyo, and he had done some reading in statistics. However, Akaike said at Princeton he saw Tukey give a lecture on robust methods and outliers. Tukey, who was revered as a mathematician (e.g., Tukey’s Lemma in topology among other contributions) presented methods that seemed very sensible, but which lacked a mathematical foundation. It was very helpful for Akaike to see that this was acceptable; that is, that it seemed a sensible way to practice statistics. I have felt that, if you can’t find an appropriate theory to justify what you’re doing, but it seems to be producing sensible results, don’t give up on the search for a stronger foundation, but don’t give up on the method either!
McElroy: It seems to be a good motto! Anything else you would like to add?
Findley: It’s been very important to whatever success I’ve had at USCB and elsewhere, to have really good colleagues to work with. I think most of us benefit from interactions with colleagues with different backgrounds from ours, but particularly when you are doing applied work and when you are trying to produce software that other people can use, you have to have the right people to work with. It also helps when you are trying to solve a very difficult theoretical problem, like some of the problems I have worked on with Ching-Zong Wei! It’s certainly important to have some luck. Bill Bell was here when I came, Brian Monsell showed up afterward, and there have been other excellent people that came and left over the years. I was lucky that the mathematics department at the University of Tulsa had its particular composition of mathematicians who knew you could become a time series analyst without formal training. But I have to say, I am very grateful for the opportunities the Census Bureau has given me. I have always gotten good support for my work, even things like permission to go off for months to some other place! So it has been a very good place to work, and I have no reason to think that the Statistical Research Division isn’t just as good a place now to work as it was before, when I was here full time.
Holan: Well, thank you for giving us this opportunity to talk with you today.
Findley: Sure.
McElroy: Thank you very much.
Acknowledgments
The authors would like to thank the Editor, Jon Wellner, for providing a suggestion that helped improve this article. Holan’s research was partially supported through the “Summer at Census” research program (2010).
Disclaimer
This paper is released to inform interested parties of ongoing research and to encourage discussion of work in progress. The views expressed are those of the authors and not necessarily those of the U.S. Census Bureau.
References
- (1) {barticle}[mr] \bauthor\bsnmAkaike, \bfnmHirotugu\binitsH. (\byear1980). \btitleSeasonal adjustment by a Bayesian modeling. \bjournalJ. Time Ser. Anal. \bvolume1 \bpages1–13. \biddoi=10.1111/j.1467-9892.1980.tb00296.x, issn=0143-9782, mr=0605571 \bptokimsref \endbibitem
- (2) {bbook}[mr] \bauthor\bsnmAnderson, \bfnmT. W.\binitsT. W. (\byear1971). \btitleThe Statistical Analysis of Time Series. \bpublisherWiley, \baddressNew York. \bidmr=0283939 \bptokimsref \endbibitem
- (3) {barticle}[auto:STB—2012/06/08—12:49:54] \bauthor\bsnmBell, \bfnmW.\binitsW. and \bauthor\bsnmHillmer, \bfnmS.\binitsS. (\byear1984). \btitleIssues involved with the seasonal adjustment of economic time series. \bjournalJ. Bus. Econom. Statist. \bvolume2 \bpages291–320. \bptokimsref \endbibitem
- (4) {bbook}[auto:STB—2012/06/08—12:49:54] \bauthor\bsnmBox, \bfnmG.\binitsG. and \bauthor\bsnmJenkins, \bfnmG.\binitsG. (\byear1976). \btitleTime Series Analysis. \bpublisherHolden-Day, \baddressSan Francisco. \bptokimsref \endbibitem
- (5) {bbook}[mr] \bauthor\bsnmBrillinger, \bfnmDavid R.\binitsD. R. (\byear1975). \btitleTime Series: Data Analysis and Theory. \bpublisherSIAM, \baddressPhiladelphia, PA. \bptnotecheck year\bptokimsref \endbibitem
- (6) {bincollection}[mr] \bauthor\bsnmCantor, \bfnmJames L.\binitsJ. L. and \bauthor\bsnmFindley, \bfnmDavid F.\binitsD. F. (\byear2006). \btitleRecursive estimation of possibly misspecified MA(1) models: Convergence of a general algorithm. In \bbooktitleTime Series and Related Topics, (\beditor\bfnmH. C.\binitsH. C. \bsnmHo, \beditor\bfnmC. K.\binitsC. K. \bsnmIng and \beditor\bfnmT. L.\binitsT. L. \bsnmLai, eds.). \bseriesInstitute of Mathematical Statistics Lecture Notes—Monograph Series \bvolume52 \bpages20–47. \bpublisherIMS, \baddressBeachwood, OH. \biddoi=10.1214/074921706000000932, mr=2427837 \bptnotecheck year\bptokimsref \endbibitem
- (7) {barticle}[auto:STB—2012/06/08—12:49:54] \bauthor\bsnmDurbin, \bfnmJ.\binitsJ. (\byear1960). \btitleThe fitting of time-series models. \bjournalRevue, Institut International de Statistique \bvolume28 \bpages233–243. \bptokimsref \endbibitem
- (8) {bbook}[mr] \beditor\bsnmFindley, \bfnmDavid\binitsD., ed. (\byear1978). \btitleApplied Time Series Analysis. \bpublisherAcademic Press, \baddressNew York. \bidmr=0507851 \bptokimsref \endbibitem
- (9) {bincollection}[mr] \bauthor\bsnmFindley, \bfnmDavid\binitsD. (\byear1981). \btitleGeometrical and lattice versions of Levinson’s general algorithm. In \bbooktitleApplied Time Series Analysis, II (Tulsa, Okla., 1980) \bpages327–354. \bpublisherAcademic Press, \baddressNew York. \bidmr=0651942 \bptokimsref \endbibitem
- (10) {bbook}[mr] \beditor\bsnmFindley, \bfnmDavid\binitsD., ed. (\byear1981). \btitleApplied Time Series Analysis. II. \bpublisherAcademic Press, \baddressNew York. \bidmr=0651933 \bptokimsref \endbibitem
- (11) {bincollection}[auto:STB—2012/06/08—12:49:54] \bauthor\bsnmFindley, \bfnmD.\binitsD. (\byear1988). \btitleAn analysis of AIC for linear stochastic regression and control. In \bbooktitleProceedings of the 1988 American Control Conference \bpages1281–1288. \bptokimsref \endbibitem
- (12) {barticle}[mr] \bauthor\bsnmFindley, \bfnmDavid\binitsD. (\byear1991). \btitleCounterexamples to parsimony and BIC. \bjournalAnn. Inst. Statist. Math. \bvolume43 \bpages505–514. \biddoi=10.1007/BF00053369, issn=0020-3157, mr=1143638 \bptokimsref \endbibitem
- (13) {barticle}[mr] \bauthor\bsnmFindley, \bfnmDavid\binitsD. (\byear1991). \btitleConvergence of finite multistep predictors from incorrect models and its role in model selection. \bjournalNote Mat. \bvolume11 \bpages145–155. \bidissn=1123-2536, mr=1258544 \bptnotecheck year\bptokimsref \endbibitem
- (14) {barticle}[auto:STB—2012/06/08—12:49:54] \bauthor\bsnmFindley, \bfnmD.\binitsD. and \bauthor\bsnmHOOD, \bfnmC.\binitsC. (\byear2000). \btitleX-12-ARIMA and its application to some Italian indicator series. In “Seasonal Adjustment Procedures – Experiences and Perspectives.”. \bjournalAnnali di Statistica Anno 129 Serie X \bvolume20 \bpages249–269. \bptokimsref \endbibitem
- (15) {barticle}[auto:STB—2012/06/08—12:49:54] \bauthor\bsnmFindley, \bfnmD.\binitsD. and \bauthor\bsnmMartin, \bfnmD.\binitsD. (\byear2006). \btitleFrequency domain analyses of SEATS and X-11/12-ARIMA seasonal adjustment filters for short and moderate-length time series. \bjournalJournal of Official Statistics \bvolume22 \bpages1–34. \bptokimsref \endbibitem
- (16) {barticle}[auto:STB—2012/06/08—12:49:54] \bauthor\bsnmFindley, \bfnmD.\binitsD. and \bauthor\bsnmMonsell, \bfnmB.\binitsB. (\byear2009). \btitleModeling stock trading day effects under flow day-of-week constraints. \bjournalJournal of Official Statistics \bvolume25 \bpages415–430. \bptokimsref \endbibitem
- (17) {barticle}[auto:STB—2012/06/08—12:49:54] \bauthor\bsnmFindley, \bfnmD.\binitsD., \bauthor\bsnmMonsell, \bfnmB.\binitsB., \bauthor\bsnmBell, \bfnmW.\binitsW., \bauthor\bsnmOtto, \bfnmM.\binitsM. and \bauthor\bsnmChen, \bfnmB.\binitsB. (\byear1998). \btitleNew capabilities and methods of the X-12-ARIMA seasonal adjustment program. \bjournalJ. Bus. Econom. Statist. \bvolume16 \bpages127–177. \bptokimsref \endbibitem
- (18) {barticle}[auto:STB—2012/06/08—12:49:54] \bauthor\bsnmFindley, \bfnmD.\binitsD. and \bauthor\bsnmParzen, \bfnmE.\binitsE. (\byear1995). \btitleA conversation with Hirotugu Akaike. \bjournalStatist. Sci. \bvolume10 \bpages104–117. \bptokimsref \endbibitem
- (19) {barticle}[mr] \bauthor\bsnmFindley, \bfnmDavid\binitsD., \bauthor\bsnmPötscher, \bfnmBenedikt M.\binitsB. M. and \bauthor\bsnmWei, \bfnmChing-Zong\binitsC.-Z. (\byear2001). \btitleUniform convergence of sample second moments of families of time series arrays. \bjournalAnn. Statist. \bvolume29 \bpages815–838. \biddoi=10.1214/aos/1009210691, issn=0090-5364, mr=1865342 \bptokimsref \endbibitem
- (20) {barticle}[mr] \bauthor\bsnmFindley, \bfnmDavid\binitsD., \bauthor\bsnmPötscher, \bfnmBenedikt M.\binitsB. M. and \bauthor\bsnmWei, \bfnmChing-Zong\binitsC.-Z. (\byear2004). \btitleModeling of time series arrays by multistep prediction or likelihood methods. \bjournalJ. Econometrics \bvolume118 \bpages151–187. \biddoi=10.1016/S0304-4076(03)00139-8, issn=0304-4076, mr=2030971 \bptokimsref \endbibitem
- (21) {barticle}[mr] \bauthor\bsnmFindley, \bfnmDavid\binitsD. and \bauthor\bsnmWei, \bfnmChing-Zong\binitsC.-Z. (\byear2002). \btitleAIC, overfitting principles, and the boundedness of moments of inverse matrices for vector autoregressions and related models. \bjournalJ. Multivariate Anal. \bvolume83 \bpages415–450. \biddoi=10.1006/jmva.2001.2063, issn=0047-259X, mr=1945962 \bptokimsref \endbibitem
- (22) {barticle}[mr] \bauthor\bsnmHillmer, \bfnmC.\binitsC. and \bauthor\bsnmTiao, \bfnmG. C.\binitsG. C. (\byear1982). \btitleAn ARIMA-model-based approach to seasonal adjustment. \bjournalJ. Amer. Statist. Assoc. \bvolume77 \bpages63–70. \bidissn=0162-1459, mr=0648026 \bptokimsref \endbibitem
- (23) {barticle}[mr] \bauthor\bsnmLevinson, \bfnmNorman\binitsN. (\byear1947). \btitleThe Wiener RMS (root mean square) error criterion in filter design and prediction. \bjournalJ. Math. Phys. \bvolume25 \bpages261–278. \bidissn=0097-1421, mr=0019257 \bptnotecheck year\bptokimsref \endbibitem
- (24) {barticle}[mr] \bauthor\bsnmMcElroy, \bfnmTucker S.\binitsT. S. and \bauthor\bsnmFindley, \bfnmDavid F.\binitsD. F. (\byear2010). \btitleSelection between models through multi-step-ahead forecasting. \bjournalJ. Statist. Plann. Inference \bvolume140 \bpages3655–3675. \biddoi=10.1016/j.jspi.2010.04.032, issn=0378-3758, mr=2674155 \bptokimsref \endbibitem
- (25) {bbook}[auto] \bauthor\bsnmRiesz, \bfnmF.\binitsF. and \bauthor\bsnmSz.-Nagy, \bfnmB.\binitsB. (\byear1955). \btitleFunctional Analysis. \bpublisherUnger, \baddressNew York. \bptokimsref \endbibitem
- (26) {bbook}[mr] \bauthor\bsnmRobinson, \bfnmEnders A.\binitsE. A. (\byear1980). \btitlePhysical Applications of Stationary Time-Series. \bpublisherMacmillan Inc., \baddressNew York. \bidmr=0609704 \bptokimsref \endbibitem