MORE REMOTE GLOBULAR CLUSTERS IN THE OUTER HALO OF M31
Abstract
We searched the Sloan Digital Sky Survey for outer halo globular clusters (GCs) around M31. Our search of non-stellar objects, within the limits of and concentrated in some remote areas of the extended halo, to a maximum projected distance of 240 kpc, for a total of approximately . Another , kpc from M31, were surveyed as test areas. In these areas, we identified 39 GCs and 2 GC candidates of the previously known GCs (93% of the“classical GCs” and 40% of the “halo extended clusters”, on the cluster classification scheme of Huxor et al.). For the entire survey, we visually inspected 78,516 objects for morphological evidence of cluster status, and we identified 18 new clusters, and 75 candidate clusters. The new clusters include 15 classical globulars and three clusters of lower density. Six of the clusters reside in the remote areas of the outer halo, beyond projected distances of 100 kpc. Previously, only MGC1 was found beyond this limit at 117 kpc. The farthest cluster discovered in this survey lies at a projected radius of 158 kpc from M31, assuming that the M31 distance is 780 kpc.
1 Introduction
Globular clusters (GCs) are some of the most beautiful objects and are important probes of galaxy evolution. In general, GCs are luminous and compact objects that can be easily identified in nearby galaxies. The stellar population within a typical Milky Way (MW) GC is simple in the sense that it is describable by one age and one chemical composition. Consequently, the abundances of Fe and the other heavy elements in a GC probably indicate the composition of the gas in its host galaxy at the time when the cluster formed. With this assumption, many studies have used measurements of GCs as diagnostics of the ages, metallicites, and kinematics of the stellar populations in Local Group galaxies and in more distant elliptical and spiral galaxies, including ones in the closest galaxy clusters (e.g., Caldwell et al. 2011; see Brodie & Strader 2006 for a review).
For testing the properties of GCs as tracers of the overall evolution and assembly of galaxies, the best galaxy is proving to be M31, the nearest large galaxy to the MW, hosting the most extensive GC system in the Local Group. In recent years, several searches have mapped many new features of the halo of M31 up to an average projected radius of kpc. For example, the Pan Andromeda Archeological Surveys, conducted with the Mega Prime (Mega Cam wide-field camera on the Canada-France-Hawaii Telescope), have discovered 40 new GCs in the outer halo of M31 (Huxor et al., 2008); multiple tidal debris streams spatially associated with GCs (Mackey et al., 2010), and five new dwarf satellite galaxies, Andromeda XXIII-XXVII (Richardson et al., 2011). The Hubble Space Telescope (HST) Advance Camera for Surveys imaging has confirmed the presence of a new population of extended, diffuse GCs in M31 larger for their luminosity than any previously known GCs (Tanvir et al., 2012). M31 is also remarkable in that it contains many GCs in its remote halo that resemble in luminosity and structure the “classical GCs” that populate the inner halos of M31 and the MW (Huxor et al., 2008, 2011). In contrast, the remote GCs in the MW are, with only the exception of giant GC NGC 2419, much sparser and lower in luminosity than the typical classical GC (Huxor et al., 2011).
In this paper we present the results of a new search for GCs, extended to more remote regions of the M31 outer halo, up to a maximum distance of 240 kpc. Table 1 lists some basic properties of the newly discovered clusters.
2 The Search for M31 Remote Clusters
Our search is based on the Sloan Digital Sky Survey (SDSS) images in Data Release 8 (DR8; Aihara et al. (2011)). The most important properties of the SDSS for our study are its large sky coverage, its near uniform resolution ( pixels with a median seeing of in the r-band), and its depth (r=22.2, 95% completeness limit Adelman-McCarthy et al. 2006). Unfortunately, the SDSS footprint does not cover uniformly the sky around M31, which limited the extent of our survey.
We selected our sample from the objects classified as non-stellar by SDSS and therefore included in their galaxy catalogue. GCs are expected to be distributed over specific ranges of absolute magnitude (,Huxor et al. (2008)) and color. For placing corresponding limits on the apparent magnitudes of the M31 clusters, we chose the r-band because GCs are red objects and because the r-band has the best signal to noise ratio of the longer wavelength SDSS bands. As an indicator of GC color, we preferred g-i, because it has a long baseline with good signal-to-noise ratio. By combining the and colors in Figure 1 of Peacock et al. (2011), it is seen that encompasses the full range of the M31 GCs. We opted to use the Petrosian magnitudes provided by SDSS because they (1) include most of the light of an extended source, (2) have high signal-to-noise ratios over the magnitude range, and (3) measure the flux within the same aperture size for all filters.
At the beginning of our search for GCs we queried the SDSS galaxies catalog for extended sources, using the complete expected range of apparent magnitudes for GCs, , assuming a distance of 780 kpc for M31 (McConnachie et al., 2005). After some testing with the confirmed M31 GCs to gain experience with their appearance in the SDSS images, we realized that we were unable to classify routinely as clusters objects fainter than , because it was impossible to distinguish them from background low-surface brightness galaxies, as in the case of HEC2 (Huxor et al., 2008) or from the unresolved compact galaxies, as in the case of B531 (the Revised Bologna Catalog v5, RBCv5; Galleti et al. 2004). We then fixed the range of our cuts at and , aware that we were imposing another limitation on the completeness of our sample. At this time, we did not use ellipticity as a criterion, in order not to eliminate possible GCs that could appear as somewhat elliptical objects because of overlapping images of stars. Even with our cuts, the large area of our survey area () left us with the great majority of the objects in our sample as background contaminants, mostly faint or compact unresolved galaxies, but also some large images of stars due to poor seeing, which were detected as extended sources by SDSS.
We had to visually inspect for morphological evidence of cluster status a sample of 78,516 non-stellar objects according to SDSS. This was accomplished in a series of steps. The coordinates of the objects that met our magnitude and color cuts were loaded into the DR8 Image List tool on the SDSS website. The image cutouts that were returned were then scanned by eye, which rejected the vast majority of objects as not candidate clusters. The cutouts of the objects that were not rejected were studied is some detail, and comparisons were made with the cutouts of known M31 clusters. For the objects that passed this more detailed scrutiny, we downloaded the r-band fits images from the SDSS Web site, and in some cases also the i-band images. These were scrutinized in great detail by setting the scaling and zoom to different levels and by comparison with similar images of known M31 clusters.
As noted by previous surveys (e.g., Battistini et al., 1980), the appearances of the M31 GCs vary with their magnitudes and central concentrations, and also with the plate scale, seeing, and magnitude depth of the images. The following classifications were developed after examining the image cutouts and the r-band fits images from the SDSS of the M31 GCs in the lists of Huxor et al. (2008), with a few additional GCs from the RBCv5. (1) GCs: objects clearly resolved into stars with a concentration in the center or presenting a core with uneven contours and surrounded by a few point sources, that were identified as stars by SDSS photometry. (2) High confidence (HC) Candidate clusters: objects with uneven contours, but less so than category (1), with or without surrounding stars, but still presenting an overall appearance of cluster status when the contrast and scaling were changed. (3) Candidate clusters: objects with a compact shape with no sign of galaxy structure and not associated with galaxies, or objects displaying a diffuse nature, with a presence of point sources that could be stars. We found it more difficult to classify clusters of low central surface brightness. They presented a diffuse appearance, similar to low surface brightness galaxies, unless they showed some resolution into stars. In cases of diffuse objects, we often relied on comparison with the images provided by Huxor et al. (2008) for the diffuse and extended clusters that they found, which they labeled “halo extended clusters” (HEC), and the SDSS images of these clusters. For our classification we prefer to use only the term “diffuse”, without “extended”, because the half-light radii, , that we measured for our clusters of this type (8.6-10.5 pc) are smaller than the ones measured by Tanvir et al. (2012) for the extended clusters ( pc). We are not sure if this is an intrinsic difference of the clusters, or if it is due to the limitation of our measurements (see Section 3).
Figure 1 shows in rectangular coordinates relative to M31 as the origin, the distribution of non-stellar objects that passed our magnitude and color cuts in the survey areas covered by SDSS. These encompass a total area of . The central and middle areas within and , which span kpc in projected distance from the center of M31, were selected to test the efficacy of our search criteria for GCs.
These test areas contain 51 objects that are listed as confirmed GCs in the RBCv5 ( and or and ). Forty-six are “classical GCs” () in the terminology of Huxor et al. (2008), and 5 are classified as “extended clusters” (). Classical GCs have relatively bright central surface brightnesses and typically pc, whereas extended clusters have very faint central surface brightnesses () and (Tanvir et al., 2012). Forty-four or of the classical GCs and 2 or of the extended clusters are in the SDSS galaxy catalogue and passed our color and magnitude cuts. The 2 missing classical GCs were not identified as objects by the SDSS. They lie relatively close to M31 where the stellar density is very high. Since our survey fields have much lower densities than these fields, we will assume in the following that the SDSS is complete to our magnitude limit. Only two of the five extended clusters in the test areas are brighter than our magnitude limit. Both were identified as star clusters by our examination of the SDSS images, which suggests that our efficacy for identifying extended clusters is . The visual examination of the SDSS images of the 44 classical GCs contained in our test areas yielded 39 definite clusters (), two candidate clusters (), and rejected three as probably galaxies (). H17 (see image in Huxor et al., 2008) is one of the three rejected clusters, which we could not distinguish from compact galaxies. If the assignment of at least cluster candidate status is considered success, then these results suggest that the efficacy of our search techniques is for classical GCs and for clusters of all types. Since this seemed adequate, we proceeded to search areas of the remote halo of M31.
The vast majority of the objects that we examined were rejected because they did not meet our criteria for either GCs or cluster candidates (see above). After cross-checking with the RBCv5 and removing previously identified objects, we were left with 18 new clusters and 75 new candidate clusters, of which 23 are classified as High Confidence Candidates.
3 Results and Discussion
The new 18 clusters discovered in our search are listed in Table 1; 15 are classical GCs and three are diffuse. Also listed are the foreground extinction corrected r and g-i, obtained from the Petrosian magnitudes and the interstellar extinctions from Schlegel, Finkbeiner,& Davis (1997) that are listed by SDSS for each object. The Petrosian magnitudes are expected to include about 90% of the cluster light. The extinctions, which are from dust maps, indicate that the MW extinction is modest in the directions of the clusters (). We caution, however, that these maps do not resolve the small-scale variations in extinction that are found in the remote halo of M31(see Mackey et al., 2009), and it is possible that the clusters with the smallest projected galactocentric distances, , may suffer some additional extinction from dust in M31. Also listed in Table 1 are the values of , , and the r band absolute magnitudes, , which were calculated assuming a distance of 780 kpc (McConnachie et al., 2005).
The half-light radii are our estimates from the radial profiles that SDSS provides for each object in their PhotoProfile catalog. This catalog tabulates the azimuthally averaged mean flux in concentric annuli (see Stoughton et al., 2002), which we used to calculate the cumulative distribution of the flux with radius and the average surface brightness in magnitudes . in the annuli. We fitted a cubic spline to the cumulative distribution and adopted the radius that contains 0.5 of the total flux as . We also examined a plot of surface brightness against radius for each object, which indicated that the values for SDSS2 and SDSS7 are more uncertain than the others. To check our procedures, we determined values of for the eight GCs with SDSS data that were included in the study by Tanvir et al. (2012), who measured from HST observations. Although the SDSS profiles are shallow () in comparison to the HST ones (), they yielded estimates of that were within 15% of the ones determined empirically by Tanvir et al. (2012) for the six GCs with pc. The values that we obtained for the remaining two, which are large extended clusters, are about 40% smaller than the empirical measurements by Tanvir et al. (2012) and about 20% smaller than their values from King model fits. Since our sample of clusters does not contain such large, low surface brightness objects, the values in Table 1 should provide a rough measure of the sizes of the clusters.
The new clusters appear to be below average to average in luminosity, except for SDSS11, a classical GC, which exhibits an absolute r band magnitude of -8.9, a half-light radius of 4.0 pc and a projected galactocentric distance of 44 kpc from M31. The half-light radii of the clusters span from 4.0 pc to 10.5 pc. The diffuse clusters are among the most extended of the group, but are less extended than the ones studied by Tanvir et al. (2012), which could be a result of the limits imposed by our selection criteria. Our search routine recovered the brightest clusters of the Huxor et al. (2008) sample of extended clusters within the SDSS footprint, but it missed the faintest ones. These objects appear as faint smudges on SDSS images that are easily confused with low surface brightness galaxies.
Under the assumption that the new GCs are all very old, their spread in color suggests that they span a wide range in metal abundance, which from Figure 1 of Peacock et al. (2011) we roughly estimate as . The clusters with kpc are on average redder and hence probably more metal-rich than the ones with kpc. We caution, however, that the reddening values of the clusters are uncertain (see above).
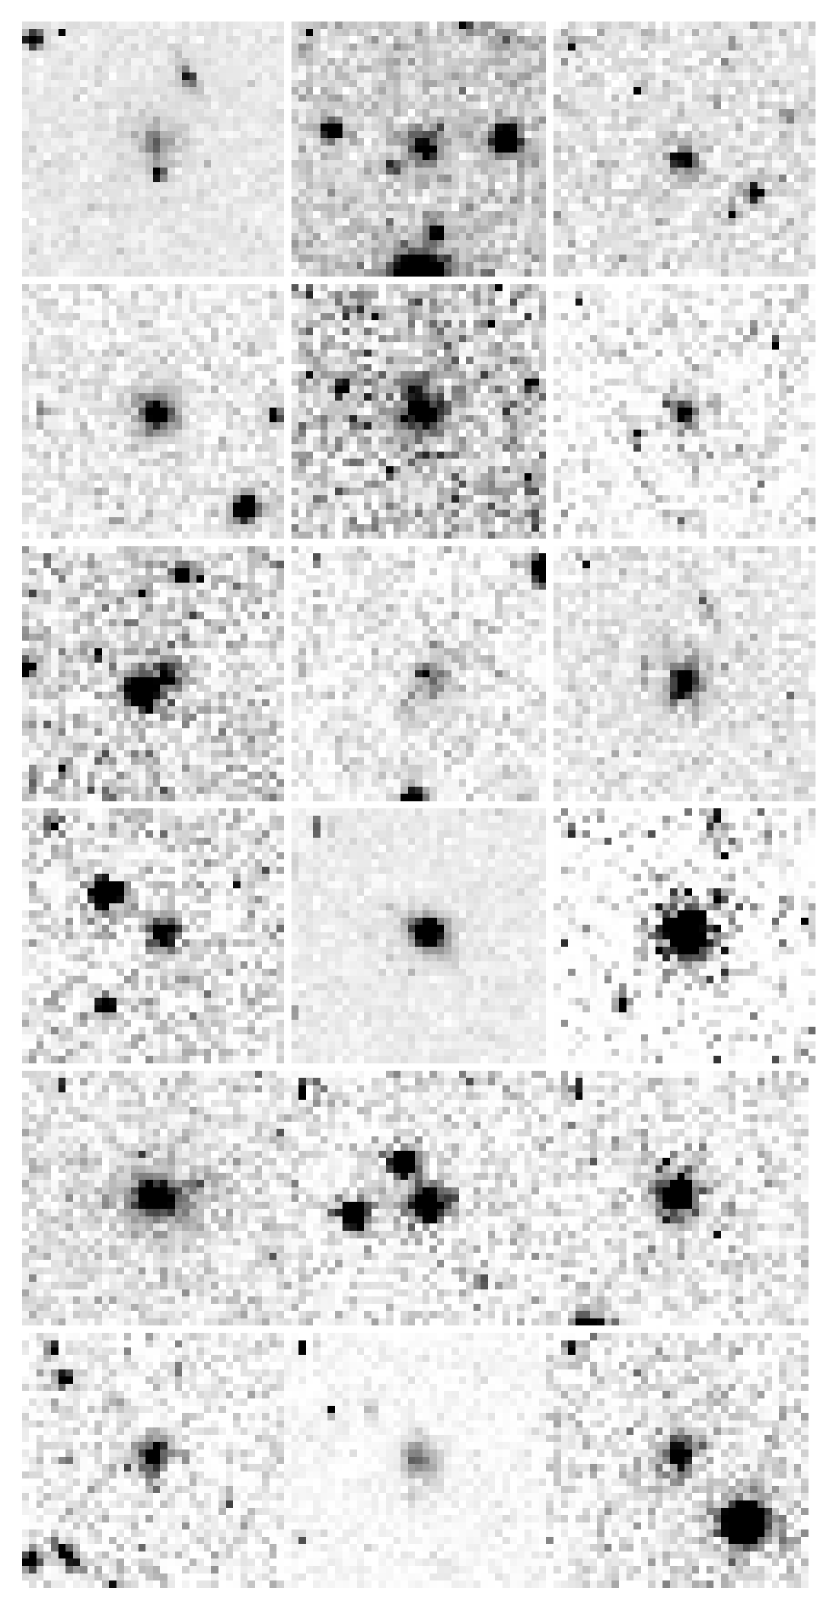
Figure 2 displays the r-band images of the objects that we classify as clusters, which were cropped from the fits files that we downloaded from the SDSS. Cluster SDSS7 is the faint object that is touching on the West the brighter object B320D, which is listed in the RBCv5 as a galaxy. Although we did not discover any clusters resembling the extended clusters discussed above, Figure 2 shows that the new clusters exhibit a wide range in brightness, central concentration, and degree to which they are resolved into stars. This last property may be due to the range in distances from us, which for the clusters most remote from M31 are expected to vary by kpc around a mean of kpc.
The spatial distribution of the new GCs is shown in Figure 3. There are six most remote GCs, with kpc, and the farthest one is at kpc, presenting a diffuse nature with and . Two of these remote clusters display a shorter projected distance to M33 than to M31. One of these clusters, SDSS13, lies from the And II dwarf spheroidal galaxy, which is, however, sufficiently far that they may be unrelated.
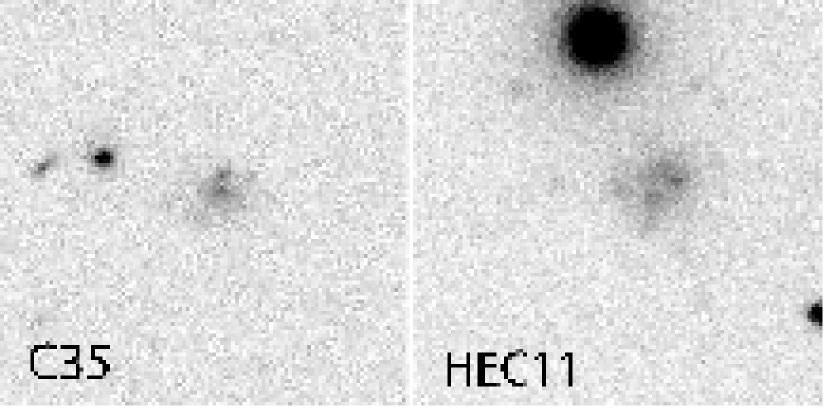
Table 2 lists the 75 candidate clusters, highlighting the 23 that we judged with higher confidence. Several of this last group display a diffuse nature. In Figure 4 we show a comparison between an HC candidate cluster C35 of Table 2, and the extended cluster HEC11 (Huxor et al., 2008), as an example of our classification criteria for HC candidate clusters of diffuse type. As Figure 4 shows, the r-band SDSS images of C35 and HEC11 are similar in appearance, but there is not an unambiguous sign that C35 is on the verge of resolving into stars. For this reason it not listed in Table 1 as a cluster. We list C35 and our other candidate clusters in Table 2 in order to assist other observers who have the higher resolution data necessary to make a definitive statement about their cluster status.
The newly discovered clusters represent only 0.02% of the total number of objects visually inspected in this survey. If we combine them with the 75 candidate clusters, even though the majority of these candidates may not be clusters, we reach 0.09% of the total, an extremely small number of positive results among a vast population of faint contaminant galaxies or ambiguous objects that could not be resolved in the SDSS imaging. In any case the results of our search for GCs in more remote areas of M31 outer halo have provided evidence for their existence up to kpc of projected galactocentric distance. It is possible that other GCs reside in the areas of our survey but were outside of our selection and classification limits. It is also possible that other GCs reside beyond the edges of our regions. A second more complete survey is already underway and the results will be published in an upcoming paper.
References
- Adelman-McCarthy et al. (2006) Adelman-McCarthy, J. K., Agöeros, M. A., Allam, S. S., et al. 2006, ApJS, 162, 38
- Aihara et al. (2011) Aihara, H., Prieto, C. A., An, D., et al. 2011,ApJS,193, 29
- Battistini et al. (1980) Battistini, P., Bonoli, F., Braccesi, A., et al. 1980, A&AS, 42, 357
- Brodie & Strader (2006) Brodie, J. P. & Strader, J. 2006, ARA&A, 44, 193
- Caldwell et al. (2011) Caldwell, N., Schiavon, R., Morrison, H., Rose, J. A., & Harding, P. 2011, AJ, 141, 61
- Galleti et al. (2004) Galleti, S., Federici, L., Bellazzini, M., Fusi Pecci, F., & Macrina, S. 2004, A&A, 416, 917
- Huxor et al. (2011) Huxor, A. P., Ferguson, A. M. N., Tanvir, N. R., et al. 2011, MNRAS, 414, 770
- Huxor et al. (2008) Huxor, A. P., Tanvir, N. R., Ferguson, A. M. N., et al. 2008, MNRAS, 385, 1989
- Mackey et al. (2009) Mackey, A. D., Ferguson, A. M. N., Irwin, M. J., et al. 2009,MNRAS,401, 533
- Mackey et al. (2010) Mackey, A. D., Huxor, A. P., Ferguson, A. M. N., et al. 2010, ApJ717, L11.
- McConnachie et al. (2005) McConnachie, A. W., Irwin, M. J., Ferguson, A. M. N., et al. 2005, MNRAS, 356, 979
- Peacock et al. (2011) Peacock, M. B., Zepf, S. P., Maccarone, T. J., & Kundu, A. 2011, ApJ, 737, 5
- Richardson et al. (2011) Richardson, J. C., Irwin, M., McConnachie, A. W., et al. 2011, ApJ, 732, 76
- Schlegel, Finkbeiner,& Davis (1997) Schlegel, D. J., Finkbeiner, D. P. & Davis, M. 1997, ApJ, 500, 525
- Stoughton et al. (2002) Stoughton, C., Lupton, R. H., Bernardi, M. et al. 2002, AJ, 123, 485
- Tanvir et al. (2012) Tanvir, N. R., Mackey, A. D., Ferguson, A. M. N., et al. 2012, MNRAS, 422, 162


| ID | RA(2000) | Dec(2000) | |||||
|---|---|---|---|---|---|---|---|
| (kpc) | (pc) | ||||||
| SDSS1ddfootnotemark: | 00:36:01.8 | 40:29:50 | 17.35 | 1.14 | 20 | 10.5 | -7.1 |
| SDSS2 | 00:38:26.9 | 40:12:35 | 18.03 | 0.81 | 18 | 6.1: | -6.4 |
| SDSS3 | 00:39:13.1 | 41:42:08 | 18.19 | 1.02 | 11 | 5.9 | -6.3 |
| SDSS4 | 00:41:18.0 | 42:46:16 | 17.73 | 1.05 | 21 | 7.2 | -6.7 |
| SDSS5 | 00:41:47.2 | 41:44:10 | 17.50 | 1.01 | 7 | 10.5 | -7.0 |
| SDSS6 | 00:42:27.6 | 39:55:28 | 18.40 | 0.96 | 18 | 7.1 | -6.1 |
| SDSS7 | 00:47:41.1 | 42:04:17 | 19.02 | 1.07 | 17 | 5.8: | -5.4 |
| SDSS8ddfootnotemark: | 00:50:36.3 | 42:31:50 | 18.17 | 0.48 | 26 | 9.1 | -6.3 |
| SDSS9 | 00:53:39.6 | 42:35:15 | 17.14 | 0.69 | 33 | 7.2 | -7.3 |
| SDSS10 | 00:55:28.1 | 43:59:31 | 18.62 | 0.58 | 49 | 5.1 | -5.8 |
| SDSS11 | 00:58:56.4 | 42:27:38 | 15.68 | 0.70 | 44 | 4.0 | -8.9 |
| SDSS12 | 01:12:47.0 | 42:25:25 | 16.85 | 0.68 | 78 | 5.0 | -7.6 |
| SDSS13 | 01:16:41.7 | 33:19:25 | 17.00 | 0.48 | 141 | 10.0 | -7.5 |
| SDSS14 | 01:22:20.7 | 35:11:35 | 17.79 | 0.92 | 134 | 8.2 | -6.7 |
| SDSS15 | 01:23:03.5 | 41:55:11 | 16.85 | 0.71 | 103 | 4.0 | -7.6 |
| SDSS16 | 01:29:02.2 | 40:47:09 | 18.17 | 0.80 | 119 | 6.6 | -6.3 |
| SDSS17ddfootnotemark: | 23:41:50.0 | 44:50:07 | 17.46 | 0.44 | 158 | 8.6 | -7.0 |
| SDSS18 | 23:49:09.7 | 40:27:30 | 18.15 | 0.82 | 137 | 7.1 | -6.3 |
Note. — Identification name used in this work, coordinates, Petrosian magnitude and color corrected for extinction, projected galactocentric distance, half-light radius, absolute magnitude at M31’s distance. ddfootnotemark: Diffuse cluster.
| ID | RA(2000) | Dec(2000) | ID | RA(2000) | Dec(2000) | ||
|---|---|---|---|---|---|---|---|
| C11d1dfootnotemark: | 00:00:37.9 | 32:25:04 | 18.74 | C39 | 00:52:34.6 | 43:18:25 | 19.64 |
| C2 | 00:08:19.0 | 34:28:07 | 17.77 | C40 | 00:54:06.3 | 29:55:18 | 18.45 |
| C3 | 00:08:34.5 | 34:37:38 | 16.21 | C41 | 01:00:12.7 | 34:00:43 | 18.54 |
| C4 | 00:11:46.6 | 32:48:12 | 17.09 | C42 | 01:02:32.1 | 25:00:07 | 18.13 |
| C5 | 00:13:41.4 | 31:16:35 | 18.20 | C43 | 01:03:15.6 | 29:28:34 | 17.69 |
| C6 | 00:15:04.9 | 32:02:12 | 18.32 | C44 | 01:04:13.4 | 28:35:24 | 18.06 |
| C711footnotemark: | 00:23:07.6 | 27:30:47 | 17.58 | C45 | 01:05:43.0 | 30:56:43 | 17.35 |
| C8 | 00:26:35.6 | 26:58:31 | 17.31 | C46 | 01:06:06.6 | 27:45:30 | 18.75 |
| C9 | 00:32:16.5 | 25:16:56 | 18.04 | C47 | 01:06:14.8 | 34:01:15 | 17.73 |
| C10 | 00:33:59.7 | 28:42:30 | 17.93 | C48 | 01:06:40.5 | 32:29:59 | 18.05 |
| C1111footnotemark: | 00:36:18.6 | 28:19:04 | 17.65 | C49 | 01:07:24.8 | 29:07:34 | 17.73 |
| C12 | 00:37:37.5 | 25:08:45 | 17.13 | C501d1dfootnotemark: | 01:08:33.5 | 33:47:10 | 17.96 |
| C13 | 00:38:13.4 | 29:39:15 | 17.80 | C51 | 01:09:40.6 | 34:14:13 | 16.87 |
| C1411footnotemark: | 00:39:32.3 | 40:51:17 | 17.85 | C52 | 01:10:50.8 | 44:44:38 | 17.38 |
| C151d1dfootnotemark: | 00:40:09.5 | 39:55:30 | 17.34 | C53 | 01:13:22.3 | 25:22:37 | 17.56 |
| C161d1dfootnotemark: | 00:40:14.0 | 39:02:33 | 18.67 | C54 | 01:13:54.4 | 28:46:06 | 18.11 |
| C17 | 00:40:31.9 | 38:11:12 | 18.11 | C55 | 01:14:29.6 | 46:06:07 | 17.07 |
| C1811footnotemark: | 00:41:38.9 | 37:19:34 | 17.79 | C5611footnotemark: | 01:17:36.0 | 46:11:18 | 18.42 |
| C19 | 00:42:05.4 | 29:35:02 | 18.81 | C57 | 01:18:09.8 | 29:14:09 | 18.01 |
| C20 | 00:42:09.2 | 38:56:15 | 17.81 | C58 | 01:19:43.8 | 33:09:20 | 18.24 |
| C211d1dfootnotemark: | 00:42:54.5 | 29:39:34 | 18.61 | C5911footnotemark: | 01:22:56.7 | 42:14:39 | 19.23 |
| C2211footnotemark: | 00:43:03.7 | 32:08:37 | 18.56 | C601d1dfootnotemark: | 01:26:10.8 | 43:49:11 | 18.43 |
| C23 | 00:43:32.0 | 33:10:04 | 17.33 | C61 | 01:27:37.6 | 38:07:05 | 16.64 |
| C2411footnotemark: | 00:43:44.3 | 31:41:24 | 18.79 | C621d1dfootnotemark: | 01:27:47.6 | 40:40:48 | 18.66 |
| C251d1dfootnotemark: | 00:43:57.2 | 26:58:46 | 18.84 | C631d1dfootnotemark: | 01:28:38.6 | 44:00:47 | 17.76 |
| C2611footnotemark: | 00:44:01.0 | 30:42:01 | 17.72 | C64 | 01:30:27.4 | 48:45:15 | 18.41 |
| C27 | 00:45:40.2 | 37:47:11 | 17.95 | C6511footnotemark: | 01:31:17.4 | 45:43:43 | 18.54 |
| C28 | 00:45:57.0 | 25:01:44 | 17.63 | C66 | 01:32:45.8 | 42:57:32 | 17.65 |
| C29 | 00:47:32.6 | 28:03:56 | 18.23 | C67 | 01:33:59.1 | 42:38:02 | 17.63 |
| C30 | 00:48:25.4 | 29:16:03 | 17.42 | C68 | 01:34:06.0 | 45:43:32 | 17.05 |
| C3111footnotemark: | 00:49:33.1 | 34:52:00 | 18.76 | C69 | 01:34:39.5 | 44:05:41 | 18.35 |
| C32 | 00:49:37.5 | 33:44:54 | 16.79 | C70 | 01:36:14.1 | 45:37:35 | 17.21 |
| C33 | 00:50:22.5 | 41:51:35 | 17.38 | C71 | 23:40:21.5 | 46:00:22 | 18.53 |
| C34 | 00:51:12.0 | 43:33:35 | 17.54 | C72 | 23:41:09.4 | 47:54:19 | 17.25 |
| C351d1dfootnotemark: | 00:51:24.2 | 27:19:04 | 18.80 | C73 | 23:44:01.5 | 38:57:20 | 18.86 |
| C36 | 00:51:32.6 | 41:57:24 | 17.11 | C7411footnotemark: | 23:46:49.9 | 45:14:50 | 17.95 |
| C37 | 00:51:47.3 | 41:37:32 | 16.92 | C7511footnotemark: | 23:48:40.9 | 39:37:45 | 17.79 |
| C38 | 00:51:59.0 | 27:30:20 | 18.71 |
Note. — 11footnotemark: High confidence candidate ddfootnotemark: Diffuse candidate