Obscured star formation in Ly blobs at
Abstract
We present results from the AzTEC/ASTE 1.1-mm imaging survey of 35 Ly blobs (LABs) found in the SSA22 protocluster at . These 1.1-mm data reach an r.m.s. noise level of 0.7–1 mJy beam-1, making this the largest millimetre-wave survey of LABs to date. No significant () emission is found in any of individual 35 LABs, and from this, we estimate 3 upper limits on the far-infrared luminosity of . Stacking analysis reveals that the 1.1-mm flux density averaged over the LABs is mJy (3), which places a constraint of . This indicates that earlier 850- measurements of the LABs may have overestimated their flux densities. Our results suggest that LABs on average have little ultra-luminous obscured star-formation, in contrast to a long-believed picture that LABs undergo an intense episode of dusty star-formation activities with star-formation rates of yr-1. Observations with ALMA are needed to directly study the obscured part of star-formation activity in the LABs.
keywords:
galaxies: evolution – galaxies: formation – galaxies: high-redshift – galaxies: starburst – submillimetre.1 Introduction
Ly blobs (LABs) are characterized by extended (20–300 kpc) Ly nebulae that are often found in overdense regions at high redshift. The origin of Ly nebulosity, however, is mysterious. There are possible explanations for the origin: The scenario that was first proposed is that the Ly nebulae are produced by mechanical feedback (or ‘superwind’) or photo-ionisation from active galactic nuclei (AGN) and/or massive star-formation activities (Taniguchi & Shioya, 2000; Taniguchi, Shioya, & Kakazu, 2001; Ohyama et al., 2003; Mori & Umemura, 2006). In fact, ultraviolet (UV) continuum and/or 24-µm emission, the latter arising from starburst/AGN heating of dust, are often detected in LABs (Steidel et al., 2000; Matsuda et al., 2004), which can provide the sufficient number of ionising photons (Webb et al., 2009; Geach et al., 2009; Colbert et al., 2011) to account for the Ly luminosities ( erg s-1, e.g., Matsuda et al., 2004, 2011; Saito et al., 2006, 2008). The large velocity width of the Ly emission (550 km s-1, Matsuda et al., 2006) can also be accounted for by the superwind scenario. On the other hand, a sizable number of LABs which lack evidence of such apparent heating sources have been reported. This fact imposes an alternative scenario in which the origin of Ly nebulae is attributed to cooling radiation from primeval hydrogen gas which accretes on to massive dark haloes (a.k.a. cold accretion; e.g., Fardal et al., 2001; Nilsson et al., 2006; Smith et al., 2008), although there remains the possibility that the ionising sources are hidden by the interstellar medium (ISM) located along the line of sight.
Observations of obscured star-formation and/or AGN are therefore necessary to properly understand the origins of the Ly nebulosity. Many attempts to detect the interstellar cold dust and molecular gas in LABs at millimetre (mm) and sub-mm wavelengths have been carried out (Chapman et al., 2001, 2004; Geach et al., 2005; Matsuda et al., 2007; Beelen et al., 2008; Yang et al., 2012). However, whether LABs have intense star-formation activities that are capable of producing and maintaining the Ly haloes is still controversial.
In this paper, we present the results from our unbiased 1.1-mm survey of 35 LABs at found in optical narrow-band filter observations (Steidel et al., 2000; Matsuda et al., 2004) toward the SSA22 field, which is known for having an overdensity of Ly emitters (LAEs) at (Hayashino et al., 2004). This is the largest mm survey of LABs to date, for which we can study the obscured star formation of these systems. The structure of this paper is as follows. In § 2, we describe our 1.1-mm observations and data reduction. § 3 describes the results. Finally, we have brief discussions and a summary in § 4. Throughout this paper, we assume a concordance cosmology with , , km s-1 Mpc-1, where 1′′ corresponds to a physical scale of 7.64 kpc at .
2 Observations
The data were taken with the AzTEC 1.1-mm camera (Wilson et al., 2008) installed on ASTE (Ezawa et al., 2004) located at Pampa la Bola, Atacama desert, Chile. The data taken during July–September 2007 is described in Tamura et al. (2009). In addition to the 2007 data, we added new data taken in 2008 that almost tripple the survey area to 0.27 deg2. The complete description will be given elsewhere (Tamura et al., in preparation).
The reduction procedure is described in Scott et al. (2008) and Downes et al. (2012). The time-stream data were intensively cleaned using a principal component analysis (PCA) algorithm, and then mapped. The full width at half maximum (FWHM) of the point response function is 34′′, corresponding to 260 kpc in physical scale at . The pointing was checked every 1 hr. Uranus and Neptune were used for flux calibration, yielding an absolute accuracy better than 10 percent. The resulting r.m.s. noise over the region covering 0.27 deg2 is 0.7–1.2 mJy beam-1 ( mJy beam-1 for 30 out of the 35 LABs). Note that stacking analysis for Spitzer/MIPS, IRAC, and VLA sources in SSA22 shows no systematic error in astrometry down to better than 4′′. Submillimeter Array (SMA) 860- imaging of the brightest 1.1-mm source, SSA22-AzTEC1 (Tamura et al., 2010), also supports this.
| Name | 1.1 mm results | Other results | ||
|---|---|---|---|---|
| S/N | 111Observed by SCUBA (Geach et al., 2005). The LABs detected at 850 µm with are indicated in bold-face type. | |||
| (mJy) | (mJy) | (mJy) | ||
| LAB1222The upper limits of mJy (Matsuda et al., 2007), mJy and mJy (Yang et al., 2012) are reported. | 1.97 | 0.74 | 2.7 | |
| LAB2 | 0.76 | |||
| LAB3 | 0.73 | |||
| LAB4 | 0.11 | 0.74 | 0.1 | |
| LAB5 | 0.34 | 0.74 | 0.5 | |
| LAB6 | 0.07 | 1.14 | 0.1 | |
| LAB7 | 0.74 | |||
| LAB8 | 0.67 | 0.74 | 0.9 | |
| LAB9 | 0.07 | 0.74 | 0.1 | |
| LAB10 | 1.20 | 0.84 | 1.4 | |
| LAB11 | 0.61 | 0.73 | 0.8 | |
| LAB12 | 0.30 | 0.74 | 0.4 | |
| LAB13 | 0.73 | … | ||
| LAB14 | 2.43 | 0.76 | 3.2 | |
| LAB15 | 0.74 | … | ||
| LAB16 | 0.34 | 0.74 | 0.5 | |
| LAB17 | 1.41 | 1.19 | 1.2 | … |
| LAB18-a | 1.53 | 0.73 | 2.1 | |
| LAB18-b | 2.33 | 0.73 | 3.2 | |
| LAB19 | 0.74 | |||
| LAB20 | 0.75 | |||
| LAB21 | 0.75 | … | ||
| LAB22 | 1.04 | 0.74 | 1.4 | … |
| LAB23 | 0.80 | … | ||
| LAB24 | 0.03 | 0.72 | 0.0 | … |
| LAB25 | 0.01 | 0.73 | 1.4 | |
| LAB26 | 0.74 | |||
| LAB27 | 0.18 | 0.77 | 0.2 | |
| LAB28 | 0.76 | … | ||
| LAB29 | 0.91 | … | ||
| LAB30 | 0.74 | 0.9 | ||
| LAB31 | 0.74 | |||
| LAB32 | 0.74 | |||
| LAB33 | 0.04 | 0.73 | 0.1 | |
| LAB34 | 1.01 | 0.93 | 1.1 | … |
| LAB35 | 0.73 | |||
| Mean | 333The upper limit. | … | … | |
3 Results
In this section, we first discuss tentative detections of 1.1 mm emission from individual LABs in § 3.1. We then consider a statistical detection of the average 1.1 mm properties of the LABs in § 3.2
3.1 1.1 mm emission of individual LABs
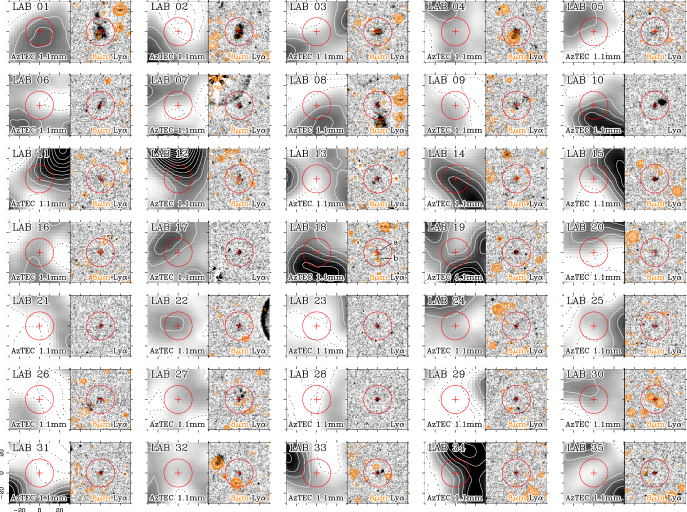
We do not find significant () 1.1-mm emission for any of the 35 LABs, as shown in Figure 1 and Table 1, which lists the 1.1-mm flux density measured at the locations of the LABs. Although the peak of Ly emission may not always coincide with the 1.1-mm counterpart, the offset can be negligible because the Ly extent is well within the beam (). If we assume a dust temperature of K and a dust emissivity index of , the 3 upper limit places a constraint on far-infrared (FIR) luminosity of for the LABs. This limit corresponds to a star-formation rate (SFR) of yr-1, which suggests that LABs do not have intense dust-obscured star-formation activity found in sub-mm galaxies (SMGs, Blain et al., 2002, for a review). Given that our 1.1-mm map reveals SMGs over the SSA22 region (Tamura et al., in prep.), none of which coincide with the LABs, this result strongly suggests that the LAB population is essentially different from the SMG population.
We note that SPIRE/Herschel data that have recently been taken toward SSA22 (P.I.: Y. Matsuda) are in good agreement with the 1.1-mm results. The 35 LABs have no SPIRE 500- counterpart. While low-S/N 250 enhancements are seen at the positions of a few LABs, the flux densities rapidly dim toward longer wavelengths, implying that the dust emission seen at 250 is due to high dust temperatures and/or low- contaminants. However, identification of exact 250 counterparts is beyond the scope of the present paper.
In the rest of this section, we discuss three tentative () detections of the 1.1 mm emission from three of the LABs.
SSA22-LAB1 — LAB1 was originally discovered by an optical narrow-band filter survey towards SSA22 (Steidel et al., 2000), and is one of the most-studied LABs in the mm and sub-mm. Subsequent imaging and photometric observations with the Submillimetre Common-User Bolometer Array (SCUBA, Holland et al., 1999) on the James Clerk Maxwell Telescope (JCMT) had revealed a luminous 850-µm source at the position of LAB1 with mJy (Chapman et al., 2001, 2004; Geach et al., 2005). However, the SMA 880-µm imaging found no emission, suggesting that the spatial extent of the sub-mm emission of LAB1 should be larger than (Matsuda et al., 2007). Very recently, Yang et al. (2012) have reported a non-detection of mm and sub-mm emission, suggesting that there is no dusty starburst associated with the LAB as reported by Chapman et al. (2001, 2004) and Geach et al. (2005). Our new 1.1-mm map shows only a marginal enhancement of 1.9 mJy beam-1 (2.7) relative to the noise. These low resolution, single-dish observations cast doubt on the presence of an extended dust component that could account for the SMA non-detection.
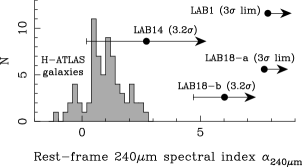
Furthermore, the 850-to-1100 µm flux ratio would be , which is quite high compared with a typical starburst galaxies. The 850–1100 band corresponds to the rest-frame wavelengths of 210–270 for a object. So, the 1.1-mm upper limit of 2.2 mJy places a constraint on the rest-frame spectral index at 444This defines the slope of a spectrum such that . to or higher. In Figure 2 we show a histogram of measured in 70 (ultra-)luminous infrared galaxies (U/LIRGs) with spectroscopic redshifts of = 0.2–0.3. The U/LIRGs are catalogued in the Herschel-ATLAS Science Demonstration Phase (SDP, Eales et al., 2010; Pascale et al., 2011; Rigby et al., 2011; Smith et al., 2011) database555www.h-atlas.org/public-data/., and all detected at 250 and 350 at . For = 0.2–0.3 objects, the SPIRE 250–350 bands sample the rest-frame part of the SEDs. The mean H-ATLAS spectral index inferred from the 250-to-350 flux ratios is (the error bar is from the standard deviation), which turns to be lower than expected in the Rayleigh-Jeans regime (This is simply because we are looking at the waveband close to the dust emission peak). The spectral index of LAB1 is extremely steep compared with the H-ATLAS indices, suggesting that the earlier SCUBA measurement remarkably overestimates the 850 flux density. On the other hand, our result is consistent with other recent non-detections with the SMA, LABOCA/APEX, and PdBI (Matsuda et al., 2007; Yang et al., 2012).
SSA22-LAB14 — The enhancement is seen at the location of LAB14 (see Fig. 1), which is 25′′ north-eastward from the SMG, SSA22-AzTEC69 (S/N = 4.1, Tamura et al. in preparation). The 1.1-mm flux density at the LAB14 position is mJy beam-1 although heavy blending with SSA22-AzTEC69 makes it difficult to accurately measure the 1.1-mm flux density. Note that it is unlikely that SSA22-AzTEC69 is the mm counterpart to LAB14 since a Monte Carlo simulation (the method is given in Scott et al., 2008) shows a low probability () that a S/N = 4 source is detected away from its original position. LAB14 has been detected at 850 (SMM J221735.84+001558.9, mJy, Chapman et al., 2005; Geach et al., 2005). The 850-to-1100 µm flux ratio would be 2.0 if assuming mJy. This yields , which is consistent with those found in the H-ATLAS galaxies (Fig. 2), although the 1.1-mm flux is tentative.
SSA22-LAB18 — A SCUBA detection has been reported for this LAB ( mJy, Geach et al., 2005). It has two IRAC counterparts, LAB18-a and LAB18-b (Webb et al., 2009). The former coincides with the Ly peak and has a 24 counterpart, whereas the latter has a hard X-ray source (Geach et al., 2009) but no 24- counterpart. We find an enhancement of 1.5 mJy (2.1) and 2.3 mJy (3.2) at the positions of LAB18-a and b, respectively, but the two objects are likely blended by a nearby 1.1-mm source with S/N 4, located south of LAB18-a (or south of LAB18-b). The 850-to-1100 µm flux ratio of LAB18-a is if taking the 3 upper limit, while that of LAB18-b is if the flux density would be mJy, although the source blending likely boosts the 1.1-mm flux density. The spectral indices at are and for LAB18-a and b, respectively. Again, the indices are substantially deviated from the H-ATLAS distribution (Fig. 2), implying that the SCUBA measurement might overestimate the 850- flux. Note that the southernmost 1.1-mm source is not likely to be the counterpart because the Monte Carlo simulation suggests a low probability ().
3.2 Stacking analysis
Stacking analysis, a pixel-to-pixel weighted-mean of 2-dimensional images around objects of interest, is often used to statistically detect very faint emission features that are common among the objects. In order to measure the average 1.1-mm flux density of LABs, we stack the 1.1-mm images around the positions of (i) all of the LABs in SSA22, and (ii) the five SCUBA-detected LABs, for which Geach et al. (2005) have reported positive detections at 850 . Note that only LABs that are away from any of mm-bright () point sources (Tamura et al. in preparation) are considered to eliminate the blending of the nearby bright sources; this leaves 32 (91 percent) of the 35 LABs666LAB14, 18 and 34 are masked. and 3 of the 5 SCUBA-detected LABs777LAB14 and 18 are masked.. The PCA cleaning process used in AzTEC reduction filters out low spatial frequency components of the map, resulting in axisymmetric negative sidelobes ( percent of the maximum) around a bright source. The sidelobes systematically offset the zero point of a stacked image. In this analysis, we first deconvolved the 1.1-mm image with a point response function (details are given in Downes et al., 2012) using the CLEAN algorithm (Högbom, 1974). The CLEAN-ed images that are cut out around the positions of the 32 LABs are weighted according to the local noise level, and then averaged. The 1 noise level is estimated by calculating , where is the local r.m.s. noise level of the 1.1-mm image around the position of the -th LAB. We verify that the average (i.e., stacked) flux density of model sources is correctly reproduced by Monte Carlo simulations in which 32 model point sources are placed in the CLEAN-ed image and then the image is stacked at the positions of those model sources (Ikarashi et al., in preparation).
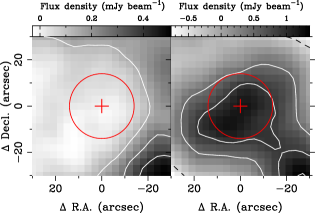
In Figure 3 (left panel) we show the results of the stacking analysis for the 32 LABs; the mm emission is not statistically detected. The weighted mean of the 1.1-mm flux density constrains the typical 1.1-mm flux density, and thus the , for LABs. We put the 3 upper limit of mJy, which corresponds to and if assuming K, and the dust emissivity m2 kg-1 (Hildebrand, 1983). As shown in Figure 2, a realistic is likely in the range between and 3, which makes the 850-to-1100 flux ratio of 0.8 to 2.2. The 1.1-mm upper limit thus corresponds to 0.3–0.9 mJy at 850 . This is below the mean 850 flux density of all the LABs observed by SCUBA ( mJy, Geach et al., 2005), but is still consistent with a mean 850 flux of mJy derived only for the LABs which are not individually detected at 850 (Geach et al., 2005). The right panel of Figure 3 shows the 1.1-mm stacked image for the SCUBA-detected LABs. The noise level is 0.44 mJy beam-1. We do not significantly detect 1.1-mm emission in the SCUBA-LABs, however, we see a small 2.3 peak. We derive a 3 upper limit of mJy, yielding and if assuming K, and m2 kg-1.
4 Discussions and conclusions
We have conducted 1.1-mm observations with AzTEC/ASTE to map the SSA22 field, which is known for having an overdensity of LABs, as well as LAEs. None of the individual 35 LABs have been detected at 1.1 mm, though LAB14 has a marginal signal (). Our stacking analysis for 32 LABs fails to statistically detect the 1.1 mm emission ( mJy, 3), suggesting that LABs on average have little ultra-luminous obscured star-formation ( [3], if assuming K and ), unlike a long-believed picture that many LABs undergo intense dusty star-formation with SFRs of yr-1 (Chapman et al., 2001, 2004; Geach et al., 2005).
We compile the results of previous mm/sub-mm observations of LABs ( kpc) at various redshifts (Smail et al., 2003; Greve et al., 2007; Matsuda et al., 2007; Beelen et al., 2008; Saito et al., 2008; Smith et al., 2008; Ouchi et al., 2009; Bussmann et al., 2009; Yang et al., 2012; Walter et al., 2012, and this work), and find that the detection rate of mm and sub-mm emission in individual LABs is 4/48 (8.3 percent) (Smail et al., 2003; Greve et al., 2007; Beelen et al., 2008; Yang et al., 2012, for sub-mm–detected LABs) though the sensitivities are not uniform. This value is lower than previously suggested (5/25 = 20 percent, Geach et al., 2005), but at least a small fraction (10 percent) of LABs may undergo obscured starbursts. Although the bulk of LABs appear not to have starbursts as seen in SMGs, massive (1010–10) stellar components are broadly seen within the Ly haloes (Geach et al., 2007; Uchimoto et al., 2008; Smith et al., 2008; Ouchi et al., 2009).
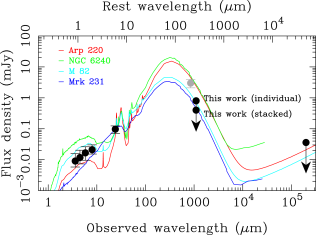
Moreover, 4 of 26 (15 percent) and 5 of 29 (17 percent) of the LABs in SSA22 have 24 and X-ray sources, respectively (Webb et al., 2009; Geach et al., 2009), suggesting that 15–20 percent of LABs may host obscured star-formation and/or AGN activities, regardless of whether they are detected at 1.1 mm. Figure 4 shows the composite mid-IR to radio SED of the 24- detected LABs (LAB1, LAB14, LAB16, and LAB18-a, Webb et al., 2009). Two of them (LAB14 and LAB18) are detected in the X-rays (Geach et al., 2009). We also show SEDs of local starburst galaxies Arp 220, NGC 6240, M 82 (Silva et al., 1998), and a nearby IR-luminous quasar Mrk 231 (Berta, 2005). The FIR luminosities of Arp 220, NGC 6240, M 82 and Mrk 231 are , , and (Sanders et al., 2003), respectively. The template SEDs are redshifted to and normalized by the mean 24- flux of the four LABs. M 82 and Mrk 231 have warmer dust than Arp 220 and NGC 6240, and this is why the (sub-)mm fluxes of the M 82 and Mrk 231 templates are lower than the others. The 1.1-mm upper limits are better consistent with the extrapolation of the M82 and Mrk 231 SEDs than Arp 220 and NGC6240. This suggests that the 24- objects within the four LABs are powered by star formation and/or AGN activities that are enough to maintain the dust temperatures high, but lack a large reservoir of cooler gas and dust which is often seen in SMGs (, e.g., Kovács et al., 2006).
These evidences may imply that some LABs are at a phase where the extreme starburst phase has just been quenched for some reason, for example, by dissociation of molecular clouds by a superwind from a nuclear starburst and/or AGN. On the other hand, percent of LABs do not host any bright UV continuum sources in the halo (e.g., Matsuda et al., 2004; Nilsson et al., 2006); such LABs without UV continuum sources may result from cooling radiation of cold streams as suggested by many authors (e.g., Nilsson et al., 2006).
Although the non-detections reported here put a strong constraint on the obscured SFR of the LABs, they do not rule out any possibilities for the formation mechanisms of Ly nebulosity. If all of the Ly emission observed in the LABs is attributed to ionising photons from young massive stars, the Ly luminosities correspond to SFRs of –100 yr-1 following the expression erg s-1 (Osterbrock & Ferland, 1989; Kennicutt, 1998). Our constraint on the FIR luminosity () suggests that SFR obscured by dust is less than 80 yr-1, following Kennicutt (1998). This limit is comparable to the Ly-derived SFR, but is not small enough to fully rule out the possibility that the Ly nebulosity is produced by feedback from massive star-formation activity. Smith et al. (2008) claimed that their non-detection of 1.2 mm emission in a LAB ( erg s-1), which limits the SFR to yr-1 (assuming K and ), rules out the photoionisation scenario in favor of the cold accretion scenario. We consider, however, that the interpretation still leaves room for reconsideration, since only an SFR of 21 yr-1 is able to produce the Ly luminosity of the LAB and so the SFR limit ( yr-1) from the 1.2-mm measurement is not enough to exclude the photoionisation scenario.
Obviously, one of the reasons why the formation mechanism of LABs is so ambiguous is that we do not have a complete picture of obscured star-formation activity within LABs. The sensitivity of the AzTEC/ASTE imaging survey presented in this work is confusion limited, and higher resolution imaging with higher sensitivity such as possible with ALMA is needed to give a better understanding of the formation mechanism of LABs.
Acknowledgments
We would like to acknowledge to the AzTEC/ASTE team who made the observations possible. We thank T. Yamada and T. Hayashino for providing the Subaru images. We would also like to thank R. Ivison for providing the new VLA image. YT is supported by JSPS Grant-in-Aid for Research Activity Start-up (no. 23840007). KSS is supported by the National Radio Astronomy Observatory, which is a facility of the National Science Foundation operated under cooperative agreement by Associated Universities, Inc. BH is supported by Research Fellowship for Young Scientists from JSPS. AzTEC/ASTE observations were partly supported by KAKENHI (no. 19403005, 20001003). The ASTE project is driven by Nobeyama Radio Observatory (NRO), a branch of NAOJ, in collaboration with University of Chile, and Japanese institutes including University of Tokyo, Nagoya University, Osaka Prefecture University, Ibaraki University and Hokkaido University. The Herschel-ATLAS is a project with Herschel, which is an ESA space observatory with science instruments provided by European-led principal investigator consortia and with important participation from NASA. The H-ATLAS website is http://www.h-atlas.org/.
References
- Beelen et al. (2008) Beelen A., et al., 2008, A&A, 485, 645
- Berta (2005) Berta S., 2005, PhDT,
- Blain et al. (2002) Blain A. W., Smail I., Ivison R. J., Kneib J.-P., Frayer D. T., 2002, PhR, 369, 111
- Bussmann et al. (2009) Bussmann R. S., et al., 2009, ApJ, 705, 184
- Chapman et al. (2001) Chapman S. C., et al., 2001, ApJ, 548, L17
- Chapman et al. (2004) Chapman S. C., Scott D., Windhorst R. A., Frayer D. T., Borys C., Lewis G. F., Ivison R. J., 2004, ApJ, 606, 85
- Chapman et al. (2005) Chapman S. C., et al., 2005, ApJ, 622, 772
- Colbert et al. (2011) Colbert J. W., Scarlata C., Teplitz H., Francis P., Palunas P., Williger G. M., Woodgate B., 2011, ApJ, 728, 59
- Downes et al. (2012) Downes T. P., Welch D., Scott K. S., Austermann J., Wilson G. W., Yun M. S., 2012, MNRAS, 2815
- Eales et al. (2010) Eales S., et al., 2010, PASP, 122, 499
- Ezawa et al. (2004) Ezawa H., Kawabe R., Kohno K., Yamamoto S., 2004, SPIE, 5489, 763
- Fardal et al. (2001) Fardal M. A., Katz N., Gardner J. P., Hernquist L., Weinberg D. H., Davé R., 2001, ApJ, 562, 605
- Geach et al. (2005) Geach J. E., et al., 2005, MNRAS, 363, 1398
- Geach et al. (2007) Geach J. E., Smail I., Chapman S. C., Alexander D. M., Blain A. W., Stott J. P., Ivison R. J., 2007, ApJ, 655, L9
- Geach et al. (2009) Geach J. E., et al., 2009, ApJ, 700, 1
- Greve et al. (2007) Greve T. R., Stern D., Ivison R. J., De Breuck C., Kovács A., Bertoldi F., 2007, MNRAS, 382, 48
- Hayashino et al. (2004) Hayashino T., et al., 2004, AJ, 128, 2073
- Hildebrand (1983) Hildebrand R. H., 1983, QJRAS, 24, 267
- Högbom (1974) Högbom J. A., 1974, A&AS, 15, 417
- Holland et al. (1999) Holland W. S., et al., 1999, MNRAS, 303, 659
- Kennicutt (1998) Kennicutt R. C., Jr., 1998, ARA&A, 36, 189
- Kovács et al. (2006) Kovács A., Chapman S. C., Dowell C. D., Blain A. W., Ivison R. J., Smail I., Phillips T. G., 2006, ApJ, 650, 592
- Matsuda et al. (2004) Matsuda Y., et al., 2004, AJ, 128, 569
- Matsuda et al. (2006) Matsuda Y., Yamada T., Hayashino T., Yamauchi R., Nakamura Y., 2006, ApJ, 640, L123
- Matsuda et al. (2007) Matsuda Y., et al., 2007, ApJ, 667, 667
- Matsuda et al. (2011) Matsuda Y., et al., 2011, MNRAS, 410, L13
- Mori & Umemura (2006) Mori M., Umemura M., 2006, Natur, 440, 644
- Nilsson et al. (2006) Nilsson K. K., Fynbo J. P. U., Møller P., Sommer-Larsen J., Ledoux C., 2006, A&A, 452, L23
- Ohyama et al. (2003) Ohyama Y., et al., 2003, ApJ, 591, L9
- Osterbrock & Ferland (1989) Osterbrock D. E. & Ferland G. J., 1989, Astrophysics of Gaseous Nebulae and Active Galactic Nuclei. University Science Books, Mill Valley.
- Ouchi et al. (2009) Ouchi M., et al., 2009, ApJ, 696, 1164
- Pascale et al. (2011) Pascale E., et al., 2011, MNRAS, 415, 911
- Rigby et al. (2011) Rigby E. E., et al. 2011, MNRAS, 415, 2336
- Saito et al. (2006) Saito T., et al.., 2006, ApJ, 648, 54
- Saito et al. (2008) Saito T., et al., 2008, ApJ, 675, 1076
- Sanders et al. (2003) Sanders D. B., Mazzarella J. M., Kim D.-C., Surace J. A., Soifer B. T., 2003, AJ, 126, 1607
- Scott et al. (2008) Scott K. S., et al., 2008, MNRAS, 385, 2225
- Silva et al. (1998) Silva L., Granato G. L., Bressan A., Danese L., 1998, ApJ, 509, 103
- Smail et al. (2003) Smail I., et al., 2003, ApJ, 583, 551
- Smith et al. (2008) Smith D. J. B., Jarvis M. J., Lacy M., Martínez-Sansigre A., 2008, MNRAS, 389, 799
- Smith et al. (2011) Smith D. J. B., et al., 2011, MNRAS, 416, 857
- Steidel et al. (2000) Steidel C. C., Adelberger K. L., Shapley A. E., Pettini M., Dickinson M., Giavalisco M., 2000, ApJ, 532, 170
- Tamura et al. (2009) Tamura Y., et al., 2009, Natur, 459, 61
- Tamura et al. (2010) Tamura Y., et al., 2010, ApJ, 724, 1270
- Taniguchi & Shioya (2000) Taniguchi Y., Shioya Y., 2000, ApJ, 532, L13
- Taniguchi, Shioya, & Kakazu (2001) Taniguchi Y., Shioya Y., Kakazu Y., 2001, ApJ, 562, L15
- Uchimoto et al. (2008) Uchimoto Y. K., et al., 2008, PASJ, 60, 683
- Walter et al. (2012) Walter F., et al., 2012, ApJ, 752, 93
- Webb et al. (2009) Webb T. M. A., et al., 2009, ApJ, 692, 1561
- Wilson et al. (2008) Wilson G. W., et al., 2008, MNRAS, 386, 807
- Yang et al. (2012) Yang Y., et al., 2012, ApJ, 744, 178