A search for Hi 21cm absorption towards a radio-selected quasar sample II: a new low spin temperature DLA at high redshift
Abstract
We report results from a deep search for redshifted Hi 21cm absorption from eight damped Lyman- absorbers (DLAs) detected in our earlier optical survey for DLAs towards radio-loud quasars. Hi 21cm absorption was detected from the DLA towards TXS2039+187, only the sixth case of such a detection at , while upper limits on the Hi 21cm optical depth were obtained in six other DLAs at . Our detection of Hi 21cm absorption in the eighth system, at towards TXS0311+430, has been reported earlier. We also present high spatial resolution images of the background quasars at frequencies close to the redshifted Hi 21cm line frequency, allowing us to estimate the covering factor of each DLA, and then determine its spin temperature . For three non-detections of Hi 21cm absorption, we obtain strong lower limits on the spin temperature, K, similar to the bulk of the high- DLA population; three other DLAs yield weak lower limits, K. However, for the two DLAs with detections of Hi 21cm absorption, the derived spin temperatures are both low K for the DLA towards TXS2039+187 and K for the DLA towards TXS0311+430. These are the first two DLAs at with values comparable to those obtained in local spiral galaxies. Based on the observed correlations between spin temperature and metallicity and velocity spread and metallicity in DLAs, we suggest that the hosts of the two absorbers are likely to be massive, high-metallicity galaxies.
keywords:
ISM: general – ISM: evolution – ISM: individual – radio lines: ISM1 Introduction
Selected through quasar absorption surveys, and with neutral hydrogen (H i) column densities cm-2, damped Lyman- absorbers (DLAs) are the high-redshift analogues of gas-rich galaxies in the local Universe. The nature of high- DLAs and their redshift evolution have long been subjects of much interest (e.g. Wolfe et al., 2005). Unfortunately, our information about these systems is mostly based on absorption studies, as it has proved very difficult to detect the absorber hosts in the presence of the bright background quasar (although see Fumagalli et al., 2010; Péroux et al., 2012; Noterdaeme et al., 2012; Krogager et al., 2012). Absorption studies only sample a narrow pencil beam through the intervening galaxy and hence often lend themselves to ambiguous interpretation. Further, the strong low-ionization metal lines commonly detected in DLAs rarely provide direct information about local physical conditions (e.g. density, temperature, pressure) in the interstellar medium (ISM) of the absorbers. Such information is only available for a few DLAs, systems with simple velocity structure (e.g. Pettini & Bowen, 2001; Carswell et al., 2012), molecular hydrogen (H2) absorption (e.g. Ledoux et al., 2003; Srianand et al., 2005), neutral carbon absorption (e.g. Jorgenson et al., 2009; Carswell et al., 2011), Siii* absorption (Howk et al., 2005), etc. As a result, despite years of detailed studies, our understanding of the host galaxies of high- DLAs remains quite limited.
For DLAs occulting radio-loud quasars, a comparison between the H i column density measured from the Lyman- absorption profile and the H i 21 cm equivalent width can be used to obtain the spin temperature () of the neutral gas (e.g. Kanekar & Briggs, 2004). This provides information about the distribution of H i in different phases of the neutral ISM, and is thus one of the few direct tracers of local conditions in DLAs. Of course, such studies require the assumption that the H i column density towards the optical quasar is the same as that towards the radio source. While the latter is usually far more extended than the optical quasar, especially at low frequencies, GHz, very long baseline interferometry (VLBI) studies at frequencies similar to the redshifted H i 21 cm line frequency allow one to estimate the fraction of radio flux density arising from the compact radio core, and thus the low-frequency covering factor of the DLA (e.g. Wolfe et al., 1976; Briggs & Wolfe, 1983; Kanekar et al., 2009a). Estimating the DLA spin temperature thus requires three measurements: (1) the H i column density from the Lyman- line, (2) the H i 21 cm optical depth, and (3) the covering factor from low-frequency VLBI studies (which also requires unambiguous identification of the radio quasar core). Note that this is still based on the assumption that the H i column density measured towards the optical quasar is the same as towards the radio quasar core (i.e. over a spatial extent of a few hundred parsec at the absorber redshift Kanekar et al., 2009a). Comparisons between H i column densities measured from the Lyman- profile and from H i 21 cm emission studies along similar sightlines in the Galaxy have found very similar values, with a mean ratio of unity and a dispersion of % (Wakker et al., 2011). A similar comparison in the DLA towards SBS 1549+593 also yielded good agreement between the H i columns estimated from the two very different methods (Bowen et al., 2001; Chengalur & Kanekar, 2002).
Unfortunately, the number of high- absorbers with spin temperature estimates is still quite small. While more than a thousand DLAs are now known at (e.g. Prochaska et al., 2005; Prochaska & Wolfe, 2009; Noterdaeme et al., 2009), there were, prior to this survey, only four DLAs with detections of H i 21 cm absorption at these redshifts (Wolfe et al., 1985; Kanekar et al., 2006; Kanekar et al., 2007; Srianand et al., 2010), besides about twenty non-detections of H i 21 cm absorption giving strong lower limits on the spin temperature (e.g. Carilli et al., 1996; Kanekar & Chengalur, 2003; Kanekar et al., 2009b; Srianand et al., 2012). The main reason for the lack of estimates in high- DLAs is that very few DLAs are known towards bright radio-loud quasars. To address this issue, we have carried out an optical survey of 45 quasars selected on the basis of their low-frequency flux density; this resulted in the detection of eight new DLAs at (Ellison et al., 2008). Our first detection of H i 21 cm absorption from this sample was reported in York et al. (2007); here, we present results from a search for redshifted H i 21 cm absorption in the full sample, which has yielded the first two low spin temperature DLAs at high redshifts.


| TXS | Beam | RMS | SVLBA | Angular size | Spatial extent | |||||
|---|---|---|---|---|---|---|---|---|---|---|
| name | MHz | MHz | mas mas | mJy bm-1 | Jy | Jy | mas mas | pc pc | ||
| 0620+389 | 2.031 | 468.63 | 1400 | 5.1 | 0.64 | 0.81 | 0.79 | |||
| 2039+187 | 2.192 | 444.99 | 327 | 11 | 0.68 | 1.92 | 0.35a | |||
| 0.39 | ||||||||||
| 1048+347 | 2.241 | 438.26 | 327 | 2.7 | 0.40 | 0.58 | 0.69 | |||
| 0311+430 | 2.289 | 431.87 | 327 | 14 | 3.12 | 5.96 | 0.52a | |||
| 1.21 | ||||||||||
| 0229+230 | 2.620 | 392.38 | 327 | 1.7 | 0.18 | 0.59 | 0.30a | |||
| 0.19 | ||||||||||
| 0229+230 | 2.683 | 385.67 | 327 | 1.7 | 0.18 | 0.59 | 0.30a | |||
| 0.19 | ||||||||||
| 2039+187 | 2.752 | 378.58 | 327 | 11 | 0.68 | 1.92 | 0.35a | |||
| 0.39 | ||||||||||
| 1239+376 | 3.411 | 322.01 | 327 | 3.8 | 0.34 | 0.62 | 0.54 |
Notes: a Note that the more compact component was identified as the radio core in all five cases where a 2-Gaussian model was fit to the VLBA image. The covering factors for the DLAs towards TXS0229+230 and TXS2039+187 assume that only the radio core is covered. If the second VLBA component is also covered by the foreground absorber, the covering factors would be (TXS2039+187), (TXS0229+230) and (TXS0311+430). In the case of TXS0311+430, the second VLBA component is located to the south-west, corresponding to a distance of kpc away at the DLA redshift. This is unlikely to be covered by the foreground galaxy, unless it is a large disk.
2 The Observations
Our search for redshifted H i 21 cm absorption in the eight DLAs of our sample (with two sightlines, towards TXS0229+230 and TXS2039+187, containing two DLAs; see Table 1) was carried out with the Green Bank Telescope (GBT; six DLAs), the Giant Metrewave Radio Telescope (GMRT; 1 DLA) and the Westerbork Synthesis Radio Telescope (WSRT; 1 DLA). The GBT observations (proposals AGBT06B-042, AGBT07B-008, AGBT08A-076 and AGBT11B-221) were carried out between 2007 and 2011, using the PF1-450 MHz and PF1-342 MHz receivers, 2 linear polarizations and the Spectral Processor. A 2.5 MHz band, sub-divided into 1024 channels, was used for all sources except TXS0229+230, whose two DLAs were observed simultaneously, using two 2.5 MHz bands, each sub-divided into 512 channels. This yielded a velocity resolution of km s-1, after Hanning smoothing and resampling. Standard position-switching, with On and Off times of 5 minutes each, was used for calibration, with system temperatures measured using a blinking noise diode. The two DLAs (towards TXS0311+430 and TXS2039+187) with absorption features near the expected line frequency were re-observed on multiple occasions with a bandwidth of 1.25 MHz. In both cases, the reality of the H i 21 cm absorption was confirmed by the detection of the doppler shift due to the Earth’s motion between the different runs.
The GMRT observations of TXS1239+376 were carried out in February 2011; earlier runs in 2007 and 2009 were found to be affected by weak radio frequency interference (RFI) and will not be discussed further. A total of 28 antennas were available for the observations, which used the GMRT Software Backend and a bandwidth of 2.08 MHz, sub-divided into 512 channels; this gave a velocity resolution of 7.6 km s-1, after Hanning smoothing and resampling. The calibrators 3C147 and 3C286 were used to calibrate the flux density scale, the system gain and the system bandpass.
Finally, the DLA toward TXS2039+187 was observed with the WSRT, in September 2008, with a bandwidth of 2.5 MHz and 2048 channels (i.e. a velocity resolution of 1.9 km s-1 after Hanning smoothing and resampling). The flux density scale and system bandpass were calibrated with observations of 3C286 and 3C48.
We also used the Very Long Baseline Array (VLBA) to obtain high-resolution images of the radio continuum emission of the six background quasars of our sample, to estimate the absorber covering factor at a frequency close to that of the redshifted H i 21 cm line. Five quasars were observed with the VLBA 327 MHz receivers in 2008 and 2009 (proposal BK153), using a bandwidth 12 MHz, sub-divided into 32 spectral channels and with 2 polarizations, 2-bit sampling and on-source times of hours. A strong fringe finder (3C454.3, 3C84, 3C147, 3C286 or 3C345) was observed during each run for bandpass calibration; phase referencing was not used. For TXS0620+389, we reduced an archival VLBA 1420 MHz dataset from 2002; this had a bandwidth of 8 MHz, sub-divided into 16 channels, with 2 polarizations and an on-source time of 8 minutes.
| TXS | NHI | Time | ||||||||
|---|---|---|---|---|---|---|---|---|---|---|
| name | cm-2 | MHz | Hrs | km s-1 | km s-1 | K | ||||
| 0620+389 | 3.46 | 2.031 | 468.63 | 0.8 (GBT) | 3.1 | 6.7 | 0.79 | |||
| 2039+187 | 3.05 | 2.192 | 444.99 | 2.2 (GBT) | 1.6 | 5.7 | 0.35 | |||
| 1048+347 | 2.52 | 2.241 | 438.26 | 2.5 (GBT) | 3.3 | 2.5 | 0.69 | |||
| 0311+430 | 2.87 | 2.289 | 431.87 | 2.0 (GBT) | 1.7 | 1.7 | 0.52 | |||
| 0229+230 | 3.42 | 2.620 | 392.38 | 3.3 (GBT) | 7.5 | 7.8 | 0.30 | |||
| 0229+230 | 3.42 | 2.683 | 385.67 | 3.3 (GBT) | 7.6 | 8.8 | 0.30 | |||
| 2039+187 | 3.05 | 2.752 | 378.58 | 12 (WSRT) | 1.9 | 5.4 | 0.35 | |||
| 1239+376 | 3.81 | 3.411 | 322.01 | 22 (GMRT) | 7.6 | 0.8 | 0.54 |
Notes: The spin temperatures of the last column assume the DLA covering factors listed in the penultimate column; see Table 1 and the main text for discussion of the DLAs towards the extended sources TXS0229+230, TXS0311+430 and TXS2039+187.
3 Data analysis and results
All GBT data were analysed using the AIPS++ single-dish package DISH. After initial editing to excise RFI and Spectral Processor failures, the spectra were calibrated and averaged together to measure the quasar flux density. For each 10-second spectrum, a second-order spectral baseline was then fit to line- and RFI-free channels and subtracted out, during the process of calibration. The residual spectra were then averaged together with weights determined by the measured system temperatures. In a few cases, a first- or second-order polynomial was fit to, and subtracted from, this average spectrum to obtain the final H i 21 cm spectrum.
The GMRT, WSRT and VLBA data were analysed in “classic” AIPS. Data rendered unusable by various issues (e.g. dead antennas, correlator problems, RFI, etc) were first edited out, and standard calibration procedures then used to obtain the antenna-based complex gains. For each source, a number of channels were averaged to produce a “channel-0” dataset, and a series of self-calibration and imaging procedures used to iteratively determine the antenna gains and the final image, via standard procedures. 3-D imaging techniques were used for the GMRT data, sub-dividing the field into 37 facets to correct for the non-coplanarity of the array. For the GMRT and WSRT data, the continuum image was next subtracted out from the calibrated visibility data, after which a first-order polynomial was fit to the visibility spectra on each interferometer baseline and subtracted out. The residual U-V data were then shifted to the barycentric frame and imaged in all channels to obtain the final spectral cube. A cut through this cube at the quasar location yielded the H i 21 cm spectrum, after subtracting out a second-order baseline. The calibration steps for the VLBA data included ionospheric corrections and fringe-fitting for the delay rates, as well as the use of online measurements of the antenna gains and system temperatures to calibrate the flux density scale. The smaller number of VLBA antennas and the relatively poor ionospheric stability (due to which only 5-6 antennas could typically be retained) meant that the final VLBA images were produced with phase self-calibration alone. The task JMFIT was used to measure the source flux density from these images, fitting an elliptical gaussian model to the radio core emission. For three sources, the entire VLBA emission was found to be compact, with a single gaussian sufficient to model the emission. Extended emission was detected in the remaining three sources, TXS0229+230, TXS2039+187 and TXS0311+430, and a 2-gaussian model was hence used here. In the case of the first two, the extended radio structure is adjacent to the core emission; it is hence possible that the foreground DLAs also cover the extended emission. Conversely, in the case of TXS0311+430, there is a second radio component located to the southwest of the core emission, i.e. kpc at the DLA redshift; the foreground DLA is unlikely to cover this component unless the absorption arises in a large disk galaxy. We also note, in passing, that the core of TXS0311+430 also shows evidence for weak extended emission. However, the poor U-V coverage implies that such extended features may arise close to bright continuum sources due to deconvolution errors. We have hence fit a single gaussian component to the core emission of TXS0311+430, with a second gaussian fitted to the south-western radio component. The VLBA images of the six background quasar cores are displayed in Fig. 1, in order of increasing DLA redshift; further, a wide-field image of TXS0311+430, showing the southwest component, is shown in Fig. 2. Note that, for the three sources with a 2-component Gaussian model, the more compact source component was identified with the radio core.

The VLBA results are summarized in Table 1; the columns of this table are: (1) the quasar name, (2) the DLA redshift, (3) the redshifted H i 21 cm line frequency, (4) the VLBA observing frequency (MHz), (5) the synthesized beam (in mas mas), (6) the root-mean-square (RMS) noise (in mJy beam-1), (7) the integrated flux density (, in Jy) of the Gaussian components fit to the VLBA image, obtained using JMFIT, (8) the total source flux density at the VLBA frequency, obtained either from direct measurements or by extrapolating from measurements at other frequencies [e.g. at 365 MHz (Douglas et al., 1996) and 1400 MHz (Condon et al., 1998)], (9) the deconvolved angular size of the fitted components (in mas mas), (10) the spatial extent of the core emission at the absorber redshift (in pc pc), and (11) the covering factor of the foreground DLA, obtained by taking the ratio of the core flux density to the total source flux density .
We note that it is difficult to estimate errors on the covering factor as the total flux density and VLBA measurements were not carried out simultaneously. Further, it should be emphasized that the deconvolved angular sizes (and hence, the estimates of the spatial extent of the core radio emission) are upper limits, as any residual phase errors would contribute to increasing the measured angular size. The spatial extent of the radio core at the absorber redshift is kpc in all cases, significantly smaller than the size of a galaxy.
Our estimates of the covering factor assume that the absorber only covers the compact VLBA core and does not cover any part of the extended radio emission. In the case of TXS0311+430, TXS2039+187 and TXS0229+230, which have extended structure in the VLBA images (on angular scales of , or kpc at the DLA redshift), it is possible that the foreground absorber may cover some of the extended emission, implying a higher covering factor. Our covering factor estimates for these DLAs should hence be treated as lower limits.
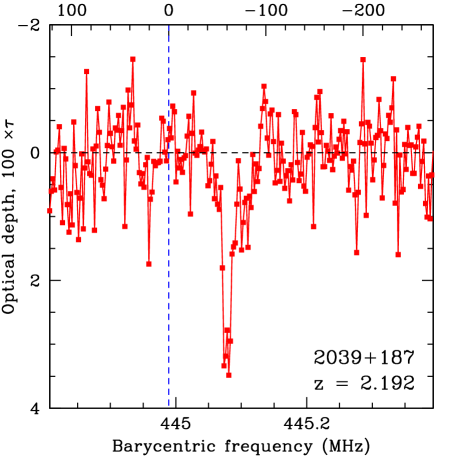
The DLAs at towards TXS2039+187 and towards TXS0311+430 showed strong H i 21 cm absorption features on multiple observing runs; the latter detection was reported, and discussed in detail, by York et al. (2007), and will not be described here. The H i 21 cm spectrum from the DLA towards TXS2039+187 is shown in Fig. 3; this has an integrated H i 21 cm optical depth of km s-1, and a velocity spread (between nulls) of 55 km s-1. The peak H i 21 cm absorption redshift in this system () lies between the metal-line and Ly- absorption redshifts ( and ), although the errors on the latter are large due to the low resolution of the present optical spectrum. It would be interesting to test whether there is indeed a velocity offset between the H i 21 cm and metal absorption, through a higher-resolution optical spectrum.
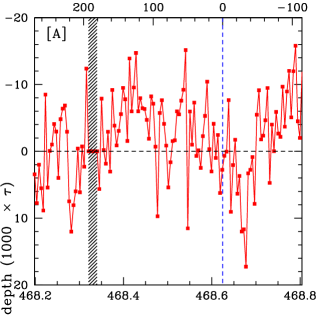
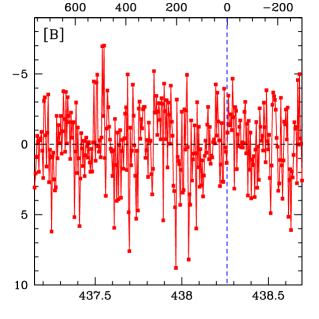
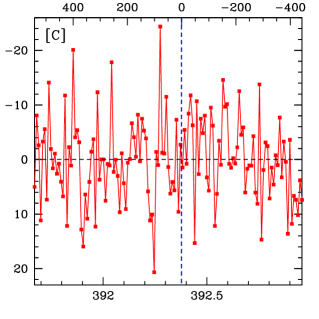
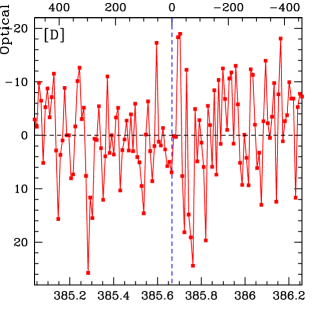
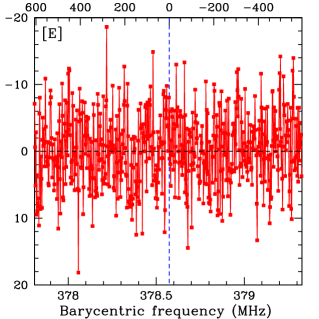
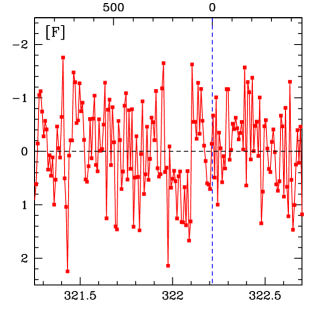
The spectra of the remaining six DLAs are shown in Fig. 4, in order of increasing redshift. While weak absorption features are visible near the expected redshifted H i 21 cm line frequency in the spectra of TXS0620+389 and TXS1239+376, these are not statistically significant ( and , respectively), on smoothing to a resolution comparable to the width of the feature. A Kolmogorov-Smirnov rank-1 test finds the spectra consistent with a normal distribution, as would be expected from random noise. However, if one fits a linear baseline to the spectrum of the DLA towards TXS0620+389 (after excluding the putative feature), and subtracts it out, the statistical significance of the feature increases to . Unfortunately, there is very little spectral baseline at frequencies above 468.7 MHz and it is hence not possible to rule out the possibility that the apparent linear baseline arises from a ripple in the spectrum. We have hence conservatively chosen to quote a upper limit on the H i 21 cm optical depth of the DLA, based on the spectrum in Fig. 4[A]. The other four DLAs showed no discernible absorption at or near the redshifted H i 21 cm line frequency.
Srianand et al. (2012) have previously reported a GMRT non-detection of H i 21 cm absorption from the DLA towards TXS1239+376. However, our longer integration time with the GMRT has allowed us to reach a deeper sensitivity. We also present an updated covering factor of from our 327 MHz VLBA image, while Srianand et al. (2012) previously estimated from a 1.4 GHz VLBA image. The difference is likely to be because compact radio cores typically have inverted spectra due to synchrotron self-absorption, while extended radio structures have steep spectra and hence contribute a larger fraction of the emission at lower frequencies. This emphasizes the need for VLBI estimates of the covering factor at frequencies close to the redshifted H i 21 cm line frequency. Consequently, we caution that our 1.4 GHz VLBA estimate of the covering factor of the DLA towards TXS0620+389 may be an over-estimate. All other DLAs of our sample have their covering factors measured at 327 MHz, within a factor of 1.5 of the redshifted H i 21 cm line frequency.
Our final results are summarized in Table 2 whose columns contain: (1) the quasar name, (2) the quasar redshift, (3) the DLA redshift, (4) the H i column density, , from the Lyman- absorption line (Ellison et al., 2008), (5) the redshifted H i 21 cm line frequency, in MHz, (6) the on-source time, in hours, with the telescope in parenthesis, (7) the velocity resolution , in km s-1, (8) the root-mean-square noise (RMS) at this resolution, in optical depth units, (9) the integrated H i 21 cm optical depth , or, for non-detections, the upper limit on , in km s-1, (10) the covering factor , and (11) the spin temperature , or, for non-detections, the lower limit on , in K, computed from the expression . For non-detections, the line profile was assumed to be a Gaussian with full-width-at-half-maximum (FWHM)=15 km s-1, similar to the widths of individual spectral components in redshifted H i 21 cm absorbers, with the RMS noise computed at a velocity resolution of km s-1. This yields a conservative upper limit to the integrated H i 21 cm optical depth; note that the line FWHM for cold gas (kinetic temperature K) due to thermal broadening is km s-1.
For six DLAs of the sample, our non-detections of H i 21 cm absorption imply that we only obtain lower limits to the spin temperature. Three of these have weak lower limits on the spin temperature, K, while the remaining three have high lower limits, K, similar to values obtained so far in the bulk of the high- DLA population (e.g. Kanekar & Chengalur 2003; Kanekar et al. 2009b). However, the two DLAs of the sample with detections of H i 21 cm absorption, at towards TXS2039+187 and towards TXS0311+430, both have low spin temperatures, K and K, respectively. These are the first two DLAs with low spin temperatures ( K) at . Indeed, the spin temperature of the DLA towards TXS0311+430 is the lowest obtained to date for any DLA, independent of redshift!
We note that the spin temperatures for the DLAs towards TXS2039+187, TXS0229+230 and TXS0311+430 assume that the DLAs cover only the radio core, i.e. covering factors of (TXS2039+187), (TXS0229+230) and (TXS0311+430). If the foreground DLAs cover the entire flux density detected in the VLBA images, the spin temperature limits would be K ( towards TXS0229+230), ( DLA towards TXS0229+230) and K ( DLA towards TXS2039+187). The spin temperature of the DLA towards TXS2039+187 would be K while that of the DLA towards TXS0311+430 would be K.
Finally, we cannot formally rule out the possibility that both VLBA components detected in the image of TXS0311+430 are actually compact steep-spectrum lobes and that the sightline towards the optical QSO lies in between the two lobes. If so, the spin temperature estimate for this sightline could be incorrect, as the H i column density determined towards the optical QSO need not be the same as that towards either of the radio lobes.
4 Discussion
The high derived spin temperatures in high- DLAs have been a puzzle ever since the first H i 21 cm absorption studies of DLAs at (Wolfe & Davis, 1979; Wolfe et al., 1981). Sightlines in the Milky Way and local spirals typically show low spin temperatures: more than 80% of the sightlines through the Milky Way and M31 in the sample of Braun & Walterbos (1992) have K. Similarly, even high-latitude Milky Way sightlines with H i column densities above the DLA threshold typically have K (Kanekar et al., 2011). In the case of DLAs, both high and low spin temperatures have been found in DLAs at (e.g. le Brun et al., 1997; Lane et al., 1998; Chengalur & Kanekar, 1999; Kanekar & Chengalur, 2001; Ellison et al., 2012). In contrast, until the present sample, every DLA at had K, with the vast majority having K (Wolfe & Davis, 1979; Wolfe et al., 1981; Wolfe et al., 1985; Carilli et al., 1996; Briggs et al., 1997; Kanekar & Chengalur, 2003; Kanekar et al., 2006; Kanekar et al., 2007; Srianand et al., 2010; Srianand et al., 2012).
Curran et al. (2005) emphasized that the high estimates in high- DLAs could arise because the low-frequency radio emission of the quasar is extended and hence not entirely covered by the foreground DLA. This is because most earlier studies of high- DLAs measured the ratio , rather than itself. However, the low-frequency covering factors of a sample of high- DLAs were recently measured using very long baseline interferometric studies of the background radio quasars, and found to be in all cases (Kanekar et al., 2009a). Further, these authors found no difference between the distributions of the covering factors of the low- and high- DLA samples. This implies that low covering factors are not the cause of the high values obtained in high- DLAs. Note that the VLBA measurements of the covering factor of the DLAs of the present sample obtained in all cases.
The simplest interpretation of the high spin temperatures obtained in high- DLAs is that the neutral hydrogen in the absorbers is mostly in the warm phase (the warm neutral medium; WNM), with very little cold H i (Carilli et al., 1996; Chengalur & Kanekar, 2000; Kanekar & Chengalur, 2003; Kanekar et al., 2009b). A plausible explanation for this is a paucity of cooling avenues in the absorbers, due to their low metallicity (Kanekar & Chengalur, 2001). In support of this hypothesis, a predicted anti-correlation between DLA metallicity and spin temperature has been recently discovered, with high values prevalent in low-metallicity DLAs and low values in high-metallicity systems (Kanekar et al., 2009b; Ellison et al., 2012). Note that Carswell et al. (2012) obtain a high WNM fraction in a low-metallicity DLA, at towards QSO2206199. Given the above anti-correlation, high-metallicity DLAs would be expected to have sizeable fractions of cold H i, and hence low spin temperatures, even at high redshifts. However, although about 10% of DLAs at have high metallicities ([Z/H] ; e.g. Prochaska et al. 2007), low spin temperatures have not hitherto been obtained at high redshifts. On the other hand, we note that high metallicity DLAs do indeed show a higher probability of detection of H2 absorption (e.g. Petitjean et al., 2006; Noterdaeme et al., 2008), consistent with the hypothesis that such DLAs have significant cold neutral medium (CNM) fractions.
The absorbers towards TXS2039+187 and TXS0311+430 are the first two DLAs at with low spin temperatures, K. While the detection of H i 21 cm absorption in the latter system was reported by York et al. (2007), no VLBI studies of the background quasar were available then. York et al. (2007) hence used a GMRT 602 MHz image to estimate a covering factor of . Our VLBA observations yield the lower limit on the covering factor, assuming that the core alone is covered by the foreground absorber, and confirm the low estimated spin temperature in this DLA. We note that the spin temperature estimate in this DLA is lower by a factor of than the original estimate of York et al. (2007), emphasizing the need for VLBA imaging studies at frequencies close to the redshifted H i 21 cm line frequency.
The low values in the DLAs towards TXS2039+187 and TXS0311+430 indicate that the two absorbers are likely to contain significant fractions of the cold neutral medium, % of the total H i content (as is the column-density weighted harmonic mean of spin temperatures in different phases along the sightline; e.g. Kanekar & Briggs 2004). The anti-correlation between spin temperature and metallicity (Kanekar et al., 2009b; Ellison et al., 2012) implies that both these DLAs should have high metallicities, [Z/H] ; conversely, the DLAs with high spin temperatures would be expected to have low metallicities, [Z/H] . As expected, the absorber towards TXS0311+430 has [Si/H] , among the highest metallicities of DLAs at (York et al., 2007; Ellison et al., 2008), while, in the case of the system towards TXS2039+187, Ellison et al. (2008) obtain [Si/H] . As noted by Ellison et al. (2008), both of these estimates are lower limits as they are based on low-resolution () spectra and assume that the Siii-1808 absorption lines are unsaturated. It would be interesting to accurately determine the metallicity of the DLA towards TXS2039+187 from a high-resolution spectrum.
If the two DLAs do indeed have high metallicities, the correlation between velocity spread and metallicity found in high- DLAs (Ledoux et al., 2006; Prochaska et al., 2008), interpreted as arising due to an underlying mass-metallicity relation, suggests that the two absorbers are likely to be massive galaxies. Note that the velocity spread (between nulls) of the H i 21 cm absorption in TXS0311+430 is indeed quite large, km s-1, as would be expected of a large galaxy; it is thus plausible that the absorber also covers the south-west VLBA component. If so, it might be possible to map the H i 21 cm absorption against the VLBA structure and directly estimate the transverse extent of the DLA (e.g. Kanekar & Briggs, 2004; Kanekar & Chengalur, 2005). Conversely, the H i 21 cm absorption towards TXS2039+187 has a velocity spread of only km s-1; if this is a massive galaxy, it is likely to be a relatively face-on system. Follow-up imaging studies of the host galaxies of the two DLAs will be of much interest.
In summary, we report a deep search for redshifted H i 21 cm absorption in eight DLAs at , with the GBT, the GMRT and the WSRT, allied with low-frequency VLBA imaging of the quasar radio emission to determine the DLA covering factors. High spin temperature limits, K, were obtained in three absorbers, and weak lower limits, K, in three systems. We report a new detection of H i 21 cm absorption in the DLA towards TXS2039+187, only the sixth case of H i 21 cm absorption in DLAs at . The detection of H i 21 cm absorption in the eighth DLA, at towards TXS0311+430, was earlier reported by York et al. (2007), but our new low-frequency covering factor measurement allows a better estimate of the DLA spin temperature. These are the first two DLAs at with low spin temperatures, K. The fraction of DLAs with low spin temperatures (%) at is similar to that of DLAs with high metallicity, [Z/H] (%). This supports the hypothesis that the high spin temperatures of most high- DLAs arise because the low absorber metallicities imply fewer routes for gas cooling.
Acknowledgements
We thank the staff of the GMRT, the GBT, the VLBA and the WSRT, who have made these observations possible. The GMRT is run by the National Centre for Radio Astrophysics of the Tata Institute of Fundamental Research. The WSRT is operated by ASTRON (the Netherlands Institute for Radio Astronomy), with support from the Netherlands Foundation for Scientific Research (NWO). The NRAO is a facility of the National Science Foundation operated under cooperative agreement by Associated Universities, Inc.. NK acknowledges support from the Department of Science and Technology through a Ramanujan Fellowship. We thank an anonymous referee for comments and suggestions that have improved this manuscript.
References
- Bowen et al. (2001) Bowen D. V., Tripp T. M., Jenkins E. B., 2001, AJ, 121, 1456
- Braun & Walterbos (1992) Braun R., Walterbos R., 1992, ApJ, 386, 120
- Briggs et al. (1997) Briggs F. H., Brinks E., Wolfe A. M., 1997, AJ, 113, 467
- Briggs & Wolfe (1983) Briggs F. H., Wolfe A. M., 1983, ApJ, 268, 76
- Carilli et al. (1996) Carilli C. L., Lane W. M., de Bruyn A. G., Braun R., Miley G. K., 1996, AJ, 111, 1830
- Carswell et al. (2012) Carswell R. F., Becker G. D., Jorgenson R. A., Murphy M. T., Wolfe A. M., 2012, MNRAS, 422, 1700
- Carswell et al. (2011) Carswell R. F., Jorgenson R. A., Wolfe A. M., Murphy M. T., 2011, MNRAS, 411, 2319
- Chengalur & Kanekar (1999) Chengalur J. N., Kanekar N., 1999, MNRAS, 302, L29
- Chengalur & Kanekar (2000) Chengalur J. N., Kanekar N., 2000, MNRAS, 318, 303
- Chengalur & Kanekar (2002) Chengalur J. N., Kanekar N., 2002, A&A, 388, 383
- Condon et al. (1998) Condon J. J., Cotton W. D., Greisen E. W., Yin Q. F., Perley R. A., Taylor G. B., Broderick J. J., 1998, AJ, 115, 1693
- Curran et al. (2005) Curran S. J., Murphy M. T., Pihlström Y. M., Webb J. K., Purcell C. R., 2005, MNRAS, 356, 1509
- Douglas et al. (1996) Douglas J. N., Bash F. N., Bozyan F. A., Torrence G. W., Wolfe C., 1996, AJ, 111, 1945
- Ellison et al. (2012) Ellison S. L., Kanekar N., Prochaska J. X., Momjian E., Worseck G., 2012, MNRAS, 424, 293
- Ellison et al. (2008) Ellison S. L., York B. A., Pettini M., Kanekar N., 2008, MNRAS, 388, 1349
- Fumagalli et al. (2010) Fumagalli M., O’Meara J. M., Prochaska J. X., Kanekar N., 2010, MNRAS, 408, 362
- Howk et al. (2005) Howk J. C., Wolfe A. M., Prochaska J. X., 2005, ApJ, 622, L81
- Jorgenson et al. (2009) Jorgenson R. A., Wolfe A. M., Prochaska J. X., Carswell R. F., 2009, ApJ, 704, 247
- Kanekar et al. (2011) Kanekar N., Braun R., Roy N., 2011, ApJ, 737, L33
- Kanekar & Briggs (2004) Kanekar N., Briggs F. H., 2004, New Astr. Rev, 48, 1259
- Kanekar & Chengalur (2001) Kanekar N., Chengalur J. N., 2001, A&A, 369, 42
- Kanekar & Chengalur (2003) Kanekar N., Chengalur J. N., 2003, A&A, 399, 857
- Kanekar & Chengalur (2005) Kanekar N., Chengalur J. N., 2005, in Williams P., Shu C.-G., Menard B., eds, IAU Colloq. 199: Probing Galaxies through Quasar Absorption Lines Cambridge University Press, Cambridge, p. 156
- Kanekar et al. (2007) Kanekar N., Chengalur J. N., Lane W. M., 2007, MNRAS, 375, 1528
- Kanekar et al. (2009a) Kanekar N., Lane W. M., Momjian E., Briggs F. H., Chengalur J. N., 2009a, MNRAS, 394, L61
- Kanekar et al. (2009b) Kanekar N., Smette A., Briggs F. H., Chengalur J. N., 2009b, ApJ, 705, L40
- Kanekar et al. (2006) Kanekar N., Subrahmanyan R., Ellison S. L., Lane W. M., Chengalur J. N., 2006, MNRAS, 370, L46
- Krogager et al. (2012) Krogager J.-K., Fynbo J. P. U., Møller P., Ledoux C., Noterdaeme P., Christensen L., Milvang-Jensen B., Sparre M., 2012, MNRAS, 424, L1
- Lane et al. (1998) Lane W., Smette A., Briggs F., Rao S., Turnshek D., Meylan G., 1998, AJ, 116, 26
- le Brun et al. (1997) le Brun V., Bergeron J., Boissé P., Deharveng J.-M., 1997, A&A, 321, 733
- Ledoux et al. (2006) Ledoux C., Petitjean P., Fynbo J. P. U., Møller P., Srianand R., 2006, A&A, 457, 71
- Ledoux et al. (2003) Ledoux C., Petitjean P., Srianand R., 2003, MNRAS, 346, 209
- Noterdaeme et al. (2012) Noterdaeme P., Laursen P., Petitjean P., Vergani S. D., Maureira M.-J., Ledoux C., Fynbo J. P. U., López S., Srianand R., 2012, A&A, 547, L1
- Noterdaeme et al. (2008) Noterdaeme P., Ledoux C., Petitjean P., Srianand R., 2008, A&A, 481, 327
- Noterdaeme et al. (2009) Noterdaeme P., Petitjean P., Ledoux C., Srianand R., 2009, A&A, 505, 1087
- Péroux et al. (2012) Péroux C., Bouché N., Kulkarni V. P., York D. G., Vladilo G., 2012, MNRAS, 419, 3060
- Petitjean et al. (2006) Petitjean P., Ledoux C., Noterdaeme P., Srianand R., 2006, A&A, 456, L9
- Pettini & Bowen (2001) Pettini M., Bowen D. V., 2001, ApJ, 560, 41
- Prochaska et al. (2008) Prochaska J. X., Chen H.-W., Wolfe A. M., Dessauges-Zavadsky M., Bloom J. S., 2008, ApJ, 672, 59
- Prochaska et al. (2005) Prochaska J. X., Herbert-Fort S., Wolfe A. M., 2005, ApJ, 635, 123
- Prochaska & Wolfe (2009) Prochaska J. X., Wolfe A. M., 2009, ApJ, 696, 1543
- Prochaska et al. (2007) Prochaska J. X., Wolfe A. M., Howk J. C., Gawiser E., Burles S. M., Cooke J., 2007, ApJS, 171, 29
- Srianand et al. (2010) Srianand R., Gupta N., Petitjean P., Noterdaeme P., Ledoux C., 2010, MNRAS, 405, 1888
- Srianand et al. (2012) Srianand R., Gupta N., Petitjean P., Noterdaeme P., Ledoux C., Salter C. J., Saikia D. J., 2012, MNRAS, 421, 651
- Srianand et al. (2005) Srianand R., Petitjean P., Ledoux C., Ferland G., Shaw G., 2005, MNRAS, 362, 549
- Wakker et al. (2011) Wakker B. P., Lockman F. J., Brown J. M., 2011, ApJ, 728, 159
- Wolfe et al. (1981) Wolfe A. M., Briggs F. H., Jauncey D. L., 1981, ApJ, 248, 460
- Wolfe et al. (1985) Wolfe A. M., Briggs F. H., Turnshek D. A., Davis M. M., Smith H. E., Cohen R. D., 1985, ApJ, 294, L67
- Wolfe et al. (1976) Wolfe A. M., Broderick J. J., Condon J. J., Johnston K. J., 1976, ApJ, 208, L47
- Wolfe & Davis (1979) Wolfe A. M., Davis M. M., 1979, AJ, 84, 699
- Wolfe et al. (2005) Wolfe A. M., Gawiser E., Prochaska J. X., 2005, ARA&A, 43, 861
- York et al. (2007) York B. A., Kanekar N., Ellison S. L., Pettini M., 2007, MNRAS, 382, L53