Feedback-regulated star formation in molecular clouds and galactic discs
Abstract
We present a two-zone theory for feedback-regulated star formation in galactic discs, consistently connecting the galaxy-averaged star formation law with star formation proceeding in giant molecular clouds (GMCs). Our focus is on galaxies with gas surface density M⊙ pc-2, where the interstellar medium (ISM) can be assumed to be fully molecular. This regime includes most star formation in the Universe and our basic framework can be extended to other galaxies. In our theory, the galactic disc consists of Toomre-mass GMCs embedded in a volume-filling ISM. Radiation pressure on dust disperses GMCs and most supernovae explode in the volume-filling medium. A galaxy-averaged star formation law is derived by balancing the momentum input from supernova feedback with the vertical gravitational weight of the disc gas. This star formation law is in good agreement with observations for a CO conversion factor depending continuously on . We argue that the galaxy-averaged star formation efficiency per free fall time, , is only a weak function of the efficiency with which GMCs convert their gas into stars, . This is possible because the rate limiting step for star formation is the rate at which GMCs form: for large efficiency of star formation in GMCs, the Toomre parameter obtains a value slightly above unity so that the GMC formation rate is consistent with the galaxy-averaged star formation law. We contrast our results with other theories of turbulence-regulated star formation and discuss predictions of our model. Using a compilation of data from the literature, we show that the galaxy-averaged star formation efficiency per free fall time is non-universal and increases with increasing gas fraction, as predicted by our model. We also predict that the fraction of the disc gas mass in bound GMCs decreases for increasing values of the GMC star formation efficiency. This is qualitatively consistent with the smooth molecular gas distribution inferred in local ultra-luminous infrared galaxies and the small mass fraction in giant clumps in high-redshift galaxies.
keywords:
Galaxies: formation, evolution, ISM, starburst, high-redshift – stars: formation1 Introduction
1.1 Observations of star formation in galactic discs and giant molecular clouds
Galaxies turn their gas into stars remarkably slowly. Averaged over galactic discs, only of the gas mass is converted into stars per free fall time in ordinary galaxies (Kennicutt 1998; Genzel et al. 2010). A similar result is found when the average is limited to spatial scales pc within galaxies (e.g., Kennicutt et al. 2007; Bigiel et al. 2008; Blanc et al. 2009). However, star formation is not this slow down to arbitrary scales.
In their study of local molecular clouds, Evans et al. (2009) found that the clouds lay a factor of above the relationship between star formation rate surface density () and gas surface density () measured by Kennicutt (1998) on galactic scales (hereafter, the Kennicutt-Schmidt [KS] law).111We note that different slopes have been inferred observationally for the star formation law (e.g., Bigiel et al. 2008). Unless otherwise noted, in this paper we use the term KS law to refer generically to the star formation law averaged over large portions of galactic discs, rather than a specific measurement. More generally, observations of nearby Galactic clouds indicate that such an elevated relation is commonly found above a gas surface density threshold M⊙ pc-2 (e.g., Lada et al. 2010; Heiderman et al. 2010). Interestingly, this gas surface density threshold is comparable to the characteristic surface density of molecular clouds in the Milky Way and other nearby dwarf and spiral galaxies (e.g., Larson 1981; Solomon et al. 1987; Bolatto et al. 2008). It is thus likely that these departures from the standard KS relation on small scales correspond to the transition to gravitationally-bound objects. This interpretation, rather than one directly tied to , is appealing because the disc-averaged relation for external galaxies with M⊙ pc-2 (including local and high-redshift starburst galaxies) does not show the same elevation.222In §4, we compile observations of versus , showing that there is no significant trend.
Focusing on the most luminous Galactic free-free sources, Murray (2011) inferred the star formation rate per free fall time
| (1) |
in giant molecular clouds (GMCs), where is the free fall time of the GMC, is the star formation rate, and is the total GMC mass (including stars). Weighted by ionizing luminosity, Murray (2011) finds .333This average does not include a large number of more quiescent GMCs, which can have a significantly lower instantaneous . One interpretation for the wide range of values is that it is time-dependent, with peaking near the end of the life of the GMC as it is being disrupted by stellar feedback (Murray & Chang 2012). Regardless of the precise interpretation, the observations described by Murray (2011) demonstrate that GMCs hosting of the current star formation rate in the Milky Way have well in excess of the galaxy-averaged value. This is much larger than the Galactic average, . The difference is significant because most star formation in the Milky Way is observed to occur in a relatively small number of massive GMCs (Williams & McKee 1997; Murray & Rahman 2010). In general, star formation correlates strongly with molecular gas but not atomic gas (e.g., Wong & Blitz 2002; Schruba et al. 2011) and the mass spectrum of molecular clouds in nearby galaxies is sufficiently shallow that the mass is concentrated in the most massive objects (e.g., Williams & McKee 1997; Rosolowsky 2005).
Thus, a central problem in understanding what regulates star formation in galaxies is to reconcile the slowness of star formation as observed on galactic scales with the higher rate at which (at least some) massive GMCs are inferred to form stars. Theoretical studies of star formation in galaxies have generally not addressed this because they have focused either on averages over entire or substantial portions of galactic discs (as in the KS law) or on the physics of individual GMCs.
1.2 Theories of galactic star formation
We review in this section some of the previous results most directly relevant to our work.
Thompson et al. (2005) developed a one-zone model of starburst discs supported by radiation pressure on dust. Murray et al. (2010) presented a complementary study of the disruption of GMCs by stellar feedback, showing that radiation pressure is likely the main process by which GMCs are disrupted, at least in high-density galaxies where competing mechanisms like photoionization and supernovae (SNe) become inefficient. In particular, Murray et al. (2010) showed that in the limit in which GMCs are optically thick to reprocessed far infrared (FIR) radiation, a fraction
| (2) |
as high as of the initial GMC gas mass is converted into stars in its lifetime. Murray et al. (2010) noted that this large integrated GMC efficiency needed to be reconciled with galaxy-averaged constraints from the observed KS law.
Ostriker & Shetty (2011) also focused on the starburst case. These authors argued that while radiation pressure may in fact disrupt GMCs, SNe provide the dominant vertical support in galactic discs, except in the very innermost regions. By balancing the gravitational weight of the disc gas with the momentum flux from SN feedback, they derived a simple expression for the KS law in good agreement with measurements, provided that the CO intensity () to molecular gas surface density () conversion factor () varies continuously with . Earlier work by Ostriker et al. (2010) considered the complementary regime where M⊙ pc-2, which we do not consider in this work.
Krumholz et al. (2009b) presented a theory of the KS law, covering both M⊙ pc-2 and M⊙ pc-2, predicting the star formation rate as a function of observed galaxy properties. This theory is based on the fact that star formation proceeds in molecular gas and builds on the theory of Krumholz & McKee (2005) in which the slowness of star formation in molecular clouds follows from the properties of supersonic turbulence. However, the model of Krumholz et al. (2009b) leaves some important questions open. In particular, it assumes but does not explain how the gas is assembled into GMCs with virial parameter . Furthermore, the theory of Krumholz & McKee (2005) does not specify how the turbulence is driven and maintained. According to the theory of Krumholz et al. (2009b), the slowness of star formation averaged over galaxies derives from its slowness within GMCs. The predictions of that theory also depend on the assumed fraction of the galaxy mass bound into GMCs. In this paper, we derive the GMC mass fraction and argue that the star formation rate of galaxies does not depend sensitively on how rapidly or efficiently gas turns into stars once it is assembled in GMCs. Rather, the critical factor is the strength of stellar feedback relative to the gravity of the galactic disc; the formation rate of GMCs from the disc adjusts itself so that the disc-averaged star formation law is realized largely independent of sub-GMC physics.
1.3 This work
A key element of many star formation theories is the gravitational instability of galactic discs. Gravitational instability, however, can only be a part of a successful theory of star formation in galaxies. Left unimpeded, gravitational collapse would convert all of the gas in a galaxy into stars in about one dynamical time, , in stark contrast with observations. In dense galaxies that are primarily molecular, we believe that stellar feedback is the main factor regulating star formation. Our goal here is thus to develop a model for star formation in GMCs and the resulting galaxy-averaged star formation law based on self-regulation by stellar feedback.
Our work builds on previous models of galactic discs supported by feedback-driven turbulence (e.g., Silk 1997; Thompson et al. 2005; Ostriker & Shetty 2011) and of GMC evolution (e.g., Matzner 2002; Krumholz & Matzner 2009; Murray et al. 2010). In particular, our principal contribution is to show explicitly how the disc-averaged and GMC feedback regulations, which appear to imply different star formation efficiencies on galactic and GMC scales, can be consistently understood in a unified framework. This allows us to generalize the disc-averaged star formation law predicted by feedback regulation to the case in which the disc has a Toomre parameter deviating from unity (§3.1) and to predict for the mass fraction of gas in gravitationally-bound clouds as a function of galaxy surface density (§3.3). We also compile observational evidence that the disc-averaged star formation efficiency scales with gas mass fraction of the galaxy (§4.3), supporting the predictions of our feedback-regulated theory, but in tension with models in which the star formation efficiency is a nearly universal constant (e.g., Krumholz & McKee 2005; Krumholz et al. 2009b).
We concentrate on the high gas surface density case ( M⊙ pc-2) to avoid effects related to the conversion of atomic to molecular gas. Since gas is expected to be essentially purely molecular in such discs, we treat the interstellar medium (ISM) as a single-phase turbulent medium. This regime includes local merging galaxies (e.g., Downes & Solomon 1998), ordinary star-forming galaxies at redshift (where the star formation rate is elevated at a fixed stellar mass; e.g., Erb et al. 2006; Daddi et al. 2007; Genzel et al. 2010), and high-redshift sub-millimeter galaxies (e.g., Tacconi et al. 2008). These systems are among the primary targets for new and upcoming observatories sensitive to the gas content of galaxies, including the Herschel Space Observatory,444http://herschel.esac.esa.int the Jansky Very Large Array (JVLA),555http://www.vla.nrao.edu the Atacama Large Millimeter Array (ALMA),666http://www.almaobservatory.org and the Cerro Chajnantor Atacama Telescope (CCAT).777http://www.ccatobservatory.org Since approximately half of all stars formed before and in halos of mass comparable to those currently probed by observation (e.g., Behroozi et al. 2012), our model in fact applies to most star formation in the Universe. The high gas surface density regime is also relevant for the inner regions of ordinary galaxies like the Milky Way and to the fueling of central massive black holes.
In §2, we define a two-zone galactic disc model, consisting of GMCs and a volume-filling inter-cloud medium. In §3, we balance the momentum returned by stellar feedback and the weight of the disc to derive an average relation as a function of the momentum per stellar mass formed () and the parameter of the disc. In this section, we also derive consistency requirements between the efficiencies of star formation in GMCs and the overall galactic disc, and . We show that is primarily a function of the gas fraction, the circular velocity of the galaxy, and the effective in the volume-filing medium. There is also a dependence on , but it is generally surprisingly weak. This is because the disc-averaged regulates itself to a value that can significantly exceed the threshold for marginal stability (). This enables the GMC formation rate to adjust itself to yield a consistent relationship between and . A comparison with observations in §4 shows that our model agrees well with measurements of the galaxy-averaged KS law, the turbulent gas velocity dispersions in galaxies, and the fraction of the disc gas mass collapsed in GMCs. We conclude in §5. Table 1 summarize symbols used in this paper.
While the high surface density limit simplifies the theoretical treatment by avoiding explicit consideration of a multiphase atomic and molecular ISM, the main points of this paper regarding the interplay between GMCs and the rest of the galactic disc likely apply to galaxies with lower surface density as well. In particular, while lower gas surface density galaxies can maintain important multiphase structure in their ISM and are subject to a different set of feedback processes, we expect that the formation rate of GMCs is also the rate limiting step in other galaxies that are supported stellar feedback. This is supported by numerical simulations of galaxies including Milky Way and Small Magellanic Cloud analogs in which the disc-averaged star formation law is insensitive to the small-scale star formation prescription (Hopkins et al. 2011). Similarly, we carry out our numerical calculations assuming that supernovae dominate feedback in the volume-filling medium and that radiation pressure on dust disrupts GMCs, our current best model for galaxies with gas surface density M⊙ pc-2 (Appendix A). However, many of our results can be extended to other feedback mechanisms (such as photoionization or cosmic rays; e.g. McKee 1989, Socrates et al. 2008) by appropriate choices for and .
2 Two-zone disc model
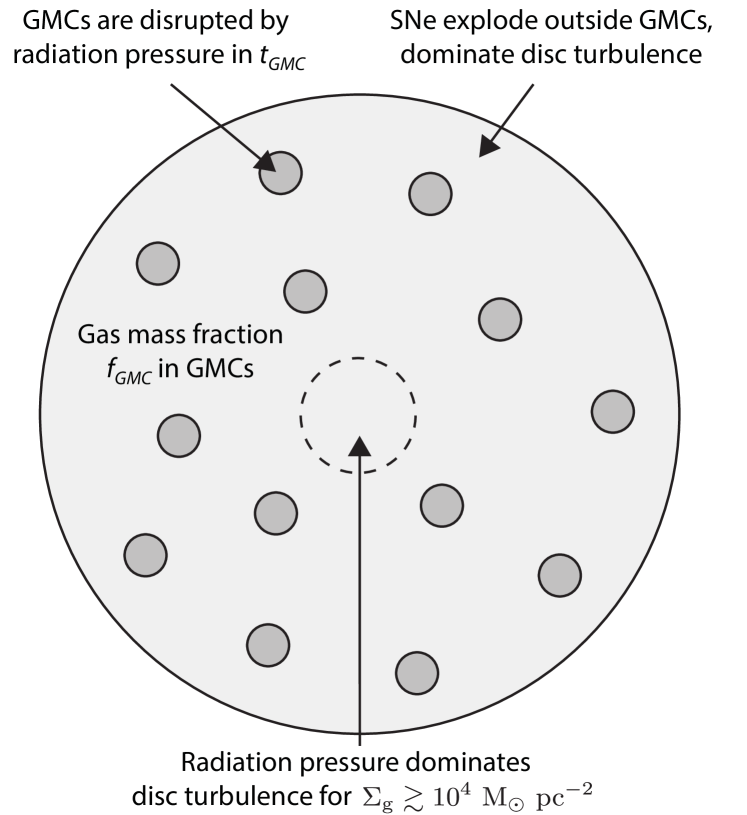
We consider a two-zone model, consisting of a volume-filling background disc in which gravitationally-bound GMCs are embedded.888In the Milky Way, gravitationally-bound clouds roughly coincide with molecular clouds. In denser galaxies which are the focus of this paper, the gas is assumed to be completely molecular. We use the term GMC to refer to gravitationally-bound clouds even though their chemical composition does not necessarily differ from the volume-filling medium. According to our definition, the self-gravity of GMCs exceeds their internal pressure. For any effective equation of state in which the pressure increases with average density, this implies that the gravity of GMCs also exceeds the external pressure acting on them. The GMCs are thus treated as collapsed entities that are hydrodynamically decoupled from the background disc before they are dispersed by stellar feedback. Figure 1 shows a schematic of our two-zone disc model.
When comparing our results to observations, it is important to distinguish between GMCs as gravitationally-bound clouds and the stage in their evolution during which they may exist as more compact quasi-virialized objects. The mean density of the quasi-virialized state, which follows an initial period of gravitational collapse, exceeds the mean density of the cloud when it first becomes gravitationally bound. Similarly, the lifetime as a gravitationally-bound cloud is longer than that in the quasi-virialized state. In this work, we generally define GMC properties in terms of their longer existence as gravitationally-bound clouds. This frees the model of assumptions regarding how the properties of the quasi-virial equilibrium are related to galaxy properties. For purely molecular galaxies, gravitational boundedness is also a well-defined criterion for GMCs. However, GMCs defined in this way do not in general correspond exactly to the density peaks traced by molecular gas in the Milky Way (e.g., Dame et al. 2001), which can have an envelope of atomic gas that is gravitationally-bound but not fully virialized (e.g., Vázquez-Semadeni et al. 2010).
| Symbol | Definition | Eq. |
|---|---|---|
| Star formation efficiency per free fall time of GMCs | 1 | |
| Integrated star formation efficiency of GMCs | 2 | |
| Star formation efficiency per free fall time in the galactic disc | 20 | |
| Velocity dispersion of isothermal galactic potential, corresponding to circular velocity | 3 | |
| Epicyclic frequency of the disc | 6 | |
| Gas disc scale height | 5 | |
| Gas mass in the disc | 3 | |
| , | Total and gas mass surface densities | 3 |
| Star formation rate surface density | 17, 18 | |
| Gas mass fraction | 8, 9 | |
| , | Mean gas density | 4, 7 |
| Turbulent gas velocity dispersion | 9 | |
| Turbulent gas pressure | 4 | |
| , | Mach number of the turbulence on the outer scale and for mode | 54 |
| , | Toomre stability parameter of the disc and smoothed on scale | 6 |
| Factor if potential is dominated by stars+dark matter and if the gas disc dominates | 4 | |
| , | Free fall time and free fall time evaluated using mean gas density in the disc | 12, 13 |
| Momentum returned by stellar feedback in ISM per stellar mass formed | 17, 18 | |
| Dimensionless parameters encapsulating uncertainties in relation | 19 | |
| , | GMC lifetime and dimensionless GMC lifetime in units of | 23, 26 |
| Fraction of disc gas mass in GMCs | 23 | |
| Instantaneous fraction of disc gas mass in gravitationally-unstable density fluctuations | 28 | |
| , | Parameters of power-law approximation for | 28 |
| , | Conversion from CO intensity to gas surface density and column density | 39 |
2.1 Background disc
Our background disc model is similar to the one introduced by Thompson et al. (2005). The disc is modeled using a radius-dependent mean gas density (including the GMC contribution). As a simple model for galaxies with flat rotation curve, we assume that the disc is in radial centrifugal balance in an isothermal potential with velocity dispersion and angular frequency . The circular velocity is then . The total mass enclosed within radius is and the corresponding surface density is
| (3) |
The gas mass fraction is .
In general, the vertical component of the hydrostatic equilibrium equation in cylindrical coordinates is , where is the gravitational potential. For a thin disc in a spherical gravitational potential, this is , where is the effective gas pressure. This can be approximated as
| (4) |
where is the disc scale height and is a constant. In the limit in which the self-gravity of the thin disc is dominant and , the solution is similar but with . Assuming that turbulence dominates the effective gas pressure,999For a molecular medium at temperature K, the sound speed is only km s-1, much smaller than observed turbulent velocity dispersions km s-1 (e.g., Downes & Solomon 1998; Genzel et al. 2011). In the Milky Way, magnetic fields and cosmic rays each contribute comparably to turbulence to the total pressure of the ISM (e.g., Boulares & Cox 1990). Using observations of radio supernova remnants (SNR), Thompson et al. (2009) show that the magnetic pressure is likely a small fraction of the total ISM pressure for starbursts with M⊙ pc-2. Cosmic ray models predict and ray observations indicate that cosmic rays are also dynamically unimportant for the gas surface densities considered here (Lacki et al. 2010; Lacki et al. 2011). , where is the turbulent velocity on the scale . The corresponding Mach number is , where is the sound speed of the gas. Equation (4) implies that
| (5) |
There is strong observational evidence that star-forming discs self-regulate to sustain a Toomre (1964) parameter
| (6) |
where is the epicyclic frequency (e.g., Quirk 1972; Kennicutt 1989; Martin & Kennicutt 2001). This can be understood intuitively from the fact that galactic discs tend to cool until , at which point they become gravitationally unstable and form stars. Stellar feedback then drives turbulence in the disc, ensuring that does not drop significantly below unity. We will show in this paper that even when stellar feedback can regulate the disc to , significant deviations such that are expected and are important for regulating the galactic star formation rate. Note that in our model, is evaluated using quantities averaged over the entire disc, including the gas in GMCs.
Real galactic discs consist not only of gas, but also of stars and dark matter, each of which has a different surface density and velocity dispersion. When the gas turbulent velocity dispersion is much smaller than the stellar velocity dispersion, the results of Rafikov (2001) imply that the effective criterion for the gas only in equation (6) is a good approximation to the stability of the disc. In the limit in which gas and stars have comparable velocity dispersions and surface densities, gas and stars contribute similarly to the disc instability. This limit may be realized in some cases of interest to us, for example in the central regions of galaxy mergers (Downes & Solomon 1998). The stability criterion would then be modified by a factor of . A more accurate theory would take this into account, but at the level of our analysis we prefer to use the simpler gas criterion in equation (6).
2.2 Giant molecular clouds
As mentioned in the introduction, most star formation in galaxies occurs in a relatively small number of massive GMCs. We identify the mass of these most massive GMCs with the Toomre mass of the disc (e.g., Goldreich & Lynden-Bell 1965),
| (11) | ||||
where we have scaled the parameters to values characteristic of local ULIRGs. The Toomre-mass GMCs are initially self-gravitating but are eventually dispersed by feedback from massive stars forming in them (e.g., Matzner 2002; Murray et al. 2010). We assume that all stars form in GMCs of Toomre mass and denote the fraction of the disc gas mass stored in gravitationally-bound GMCs at any given time by : .
In general, the free fall time in a region of mean density is
| (12) | ||||
Since the mean density of a GMC in quasi-virial equilibrium exceeds the mean density in the disc, the free fall time of the GMC in that state is shorter than the free fall time in the disc. In the Milky Way, quasi-virialized GMCs are over-dense with respect to the disc by a factor , so that their internal free fall time is shorter than the free fall time in the disc by a factor . The lifetime of quasi-virialized GMCs before they are dispersed by feedback is likely a few internal free fall times (e.g., Murray & Chang 2012), comparable to or less than the free fall time at mean disc density, . Since is also the time scale for formation of the GMC from the disc (for ), the GMC lifetime as a gravitationally-bound entity .
Using equation (7) for the mean gas density in the disc,
| (13) | ||||
The short dynamical times in dense starburst discs imply that massive stars can outlive their parent GMC. We expand on this point in Appendix A in the context of which feedback processes disrupt GMCs and which processes drive turbulence in the volume-filling ISM.
3 Connecting disc and GMC star formation
We now connect star formation in GMCs and the disc-averaged star formation law. We first derive a general expression for the disc-averaged KS law based on vertical hydrostatic equilibrium in the disc (§3.1), discuss the relationship to the turbulent gas velocity dispersion (§3.2), and show how the implied disc-averaged star formation efficiency is related to the integrated star formation efficiency and lifetime of GMCs (§3.3).
We express our results here in terms of a fiducial value for km s-1 (the effective momentum injected by stellar feedback per stellar mass formed) appropriate for SN feedback under typical conditions. We motivate this choice and discuss how depends on the ambient conditions (including the importance of radiation pressure) further in Appendix A.
3.1 The disc-averaged star formation law
The general requirement that the turbulent pressure balances the gravitational weight of the overlying gas in the disc is
| (14) |
This expression follows from hydrostatic equilibrium and the definition of , and the pre-factor depends on the assumption of an isothermal potential. Equation (14) holds for any value of or . A similar equilibrium relation was derived by Thompson et al. (2005) and Ostriker & Shetty (2011).
In general, the total turbulent pressure results from a combination of stellar feedback and all other processes that drive turbulence:
| (15) |
The second term, , may include contributions from the magneto-rotational instability (MRI; e.g., Piontek & Ostriker 2005), the thermal instability (e.g., Kritsuk & Norman 2002), the release of gravitational potential energy as gas accretes onto the galaxy from the intergalactic medium (e.g., Genel et al. 2012) or as gas is transported inward by internal galactic torques (e.g., Krumholz & Burkert 2010).
We focus on the case in which stellar feedback dominates turbulence, . Then can be derived by equating the rate of energy injection per unit volume, , with the total turbulent energy dissipation rate, . The energy injection rate , where is a velocity term used to convert momentum to kinetic energy injection. If isolated SNe dominate the feedback, is the supernova remnant (SNR) velocity at the stage used to evaluate . We define this stage such that , which for SNRs corresponds to when the remnants effectively merge with the ISM. In general, can also be determined by other processes, such as photoionization in lower- galaxies (e.g., McKee 1989; Ostriker et al. 2010) or radiation pressure on dust in higher- galaxies (Thompson et al. 2005 and Appendix A).
Numerical simulations show that turbulence dissipates in approximately one flow crossing time,
| (16) |
where and is the size of the largest eddies (e.g., Stone et al. 1998; Mac Low 1999). This expression is valid for hydrodynamic and magnetohydrodynamic turbulence, both subsonic and supersonic. The turbulent energy dissipation rate is thus and we can solve for :
| (17) |
In the above equation, we defined and introduced a term , where the factor of accounts for cancelation of momentum in the disc plane and parameterizes the uncertainty in it (Ostriker & Shetty 2011). We also defined as the fraction of the input momentum that is lost to a galactic wind, rather than contributing directly to the vertical pressure support in the disc.
The dependence on in equation (17) illustrates the dependence on the details of how turbulence is driven. For example, if turbulence is driven by individual SNe and the ambient density is very large, then it is possible that . In this limit the turbulent energy is efficiently radiated away and SNe are relatively inefficient. On the other hand, SNe could cluster and merge in super-bubbles of scale before achieving pressure equilibrium with the ambient ISM.
Equating equations (14) and (17), we obtain the star formation law
| (18) | ||||
where
| (19) |
encapsulates uncertain factors of order unity. This star formation law derives from feedback-driven turbulence support, as in Thompson et al. (2005), but we find a different normalization because of how we treat supernova feedback (see Appendix A). Equation (18) is consistent with the derivation of Ostriker & Shetty (2011).
3.2 Relation between turbulent gas velocity dispersion and star formation efficiency
We can also write the star formation law by defining a disc-averaged star formation efficiency per free fall time, , as in the usual KS law:
| (20) |
Using the definition of (eq. 12) and expressing the mean density using the vertical balance equation (14), the star formation law becomes
| (21) |
We can further use equation (18) to eliminate and solve for the turbulent velocity:
| (22) | ||||
(see also Thompson et al. 2005; Ostriker & Shetty 2011). This result implies that the turbulent velocity dispersion is constant at fixed , even if the supernova rate varies by orders of magnitude with the star formation rate, in agreement with the numerical simulations of Joung et al. (2009). In §4.4, we show that the elevated turbulent velocity dispersions observed in local ULIRGs and in high-redshift star-forming galaxies can be explained by the dependence of on the product , which we discuss next.
3.3 Consistency with star formation in GMCs
Consider the total mass of stars formed in a time interval of duration , . This can be written in two ways:
| (23) |
and
| (24) |
The right-hand side of equation (23) is simply the number of GMC generations in one times the stellar mass formed in GMCs in one generation, while equation (24) follows directly from the definition of .101010In equations (23) and (24), the time interval is arbitrary and was chosen to simplify the algebra that follows. It is assumed that the GMC lifetime is at least one free fall time at the density threshold for gravitational instability, which ensures that the turbulence re-arranges itself rapidly enough that the number of GMC generations in a given time interval is determined by the GMC lifetime, rather than the time scale for new density fluctuations to begin gravitational collapse to a GMC. As before, and are the disc gas mass fraction in GMCs and the total GMC lifetime, where GMCs are defined as gravitationally-bound clouds (see §2). Since we assume all star formation occurs in GMCs, we can equate these two expressions to find
| (25) |
where
| (26) |
is the GMC lifetime as a fraction of the disc free fall time. We argued in §2.2 that . By definition,
| (27) |
The numerator is the rate at which gas is processed by GMCs, i.e. either turned into stars or returned to the ISM. The denominator is proportional to the rate at which gas from the disc is incorporated into bound GMCs, . More precisely, the GMC formation rate is determined by the rate at which turbulent fluctuations become gravitationally unstable,
| (28) |
where is the fraction of the gas mass in the disc that is unstable to gravitational collapse at any time. We have identified the time scale for the turbulence to rearrange itself and for new GMCs to collapse with the flow crossing time and introduced the dimensionless parameter to parameterize the uncertainty in the scaling. Using equations (10) and (13), we find that , where
| (29) |
and thus
| (30) |
The collapse fraction depends on the Mach number of the turbulence (through the PDF of gas density fluctuations), the epicyclic frequency of the disc (which determines the rotational support on scales ), and the disc parameter (which quantifies the stability to gravitational collapse). It also in general depends on the excitation of spiral structure and other large-scale disc disturbances by internal dynamics or interactions with external perturbers.
If , the disc is Toomre-unstable and . For , a quiescent disc supported by thermal pressure would be stable and . However, a realistic galactic disc is subject to turbulent fluctuations, so that even if when evaluated using averaged properties (e.g., over a ring of finite width in the galaxy), random fluctuations imply a certain probability that at some locations. Spatially-resolved spectroscopy of star-forming galaxies in fact indicate that the locations of star-forming clumps correspond to local minima in , where , while often exceeds unity outside the clumps (Genzel et al. 2011).111111Since the H observations trace star formation, these maps likely miss a substantial area where .
In Appendix C, we provide a simple heuristic derivation for and summarize the more detailed calculation from Hopkins (2012a). However, these results are sensitive to the amplitude of fluctuations on a smoothing scale (identified with GMCs) and are subject to significant uncertainties because the properties of the large-scale turbulence depend on the mechanism driving the turbulence and the effects of disc rotation. Here, we carry out analytic estimates using a parameterization of that captures its essential behavior:
| (31) |
The results of Appendix C suggest that reasonable parameters are and , for Mach numbers , respectively.
If GMCs are in steady state in the sense that they process gas at the same rate as they are supplied with gas, . This is likely usually a reasonable assumption in practice, because we expect the lifetimes of GMCs to be comparable to the free fall time of their host disc (), and the latter is a lower bound for the time scale over which the host disc changes. Then
| (32) |
and thus equation (25) implies
| (33) |
Using (eq. 9), equations (22), (31) and (33) can be combined to eliminate and solve for :
| (34) |
(This solution assumes that is a constant; for the case of a pure gas disc with no external potential, (§2) and the solution involves an additional power of .) We can use this solution to directly relate the galaxy-averaged and GMC star formation efficiencies:
| (35) | ||||
The limit , in which the probability of GMC formation is suppressed very rapidly as exceeds unity, is particularly enlightening. Then,
| (36) |
and
| (37) |
In this limit, in which approaches exactly unity, the galaxy-averaged star formation efficiency per free fall time is set by the dimensionless ratio , a proxy for the ratio of the strength of gravity to the strength of feedback. Perhaps most importantly, in the limit, is completely independent of how efficiently gas is converted into stars once collapsed in GMCs. The rate limiting step for star formation in this case is the rate at which GMCs form in the galactic disc. For , (eq. 9) and thus is also proportional to the ratio .
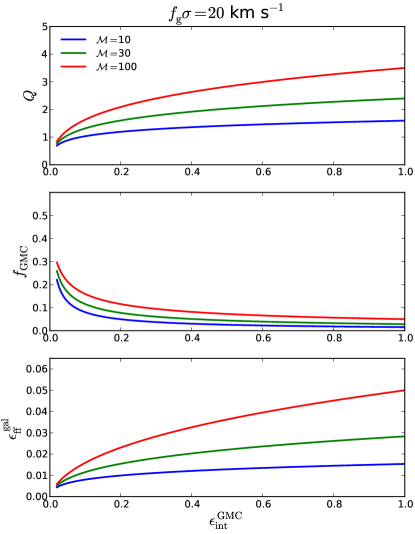
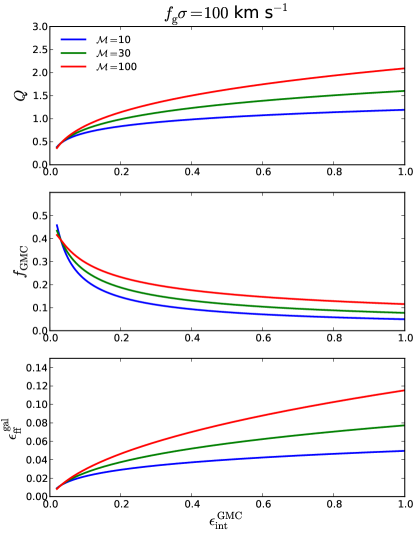
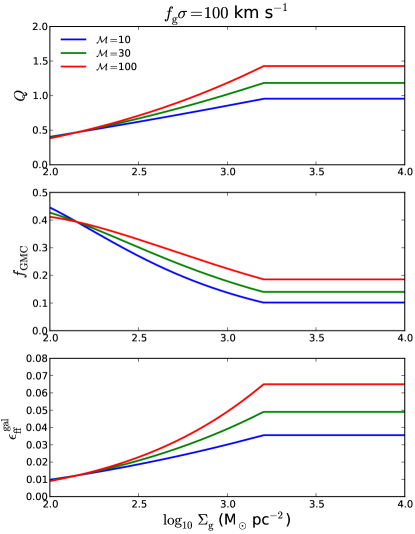
For finite , is regulated to a value that can exceed unity and there is a weak dependence of on . This is illustrated in Figure 2, in which we show equilibrium solutions for , , and (simultaneously satisfying eq. 9, 22, and 33) as a function of obtained using equation (60) for the collapsed fraction as a function of instead of the power-law approximation in eq. (31). The equilibrium solutions assume a constant (; see §2.2). The left panel in Figure 2 is representative of a low-mass or gas-poor galaxy with km s-1 and the panel on the right is illustrative of a massive gas-rich system (such as an ULIRG or a high-redshift star-forming galaxy) with km s-1. In the limit , GMCs do not form any stars and the assumptions of our model break down. We thus show the equilibrium solutions only for , the minimum efficiency implied by equation (38) below for M⊙ pc-2. The disc-averaged star formation efficiency per free fall time increases slowly with the integrated GMC star formation efficiency, while decreases. For example, for a Mach number , increases by a factor when increases by a factor of from to . This is realized by the global parameter increasing above the classical stability threshold of unity, so that GMCs form only where turbulent fluctuations cause the self-gravity of the gas to exceed its turbulent and rotational support. Figure 2 also shows that for small , the star formation rate is too low to support the disc to and the disc settles to a .
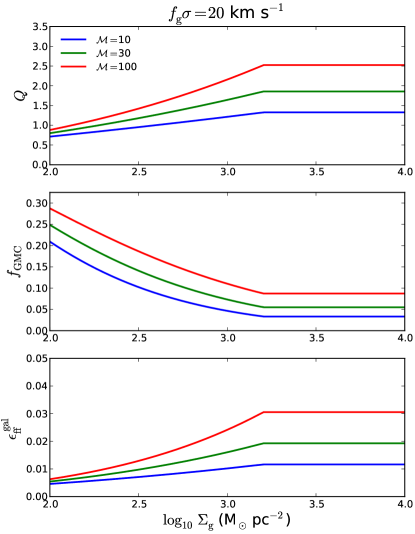
In Figure 3, we show the same equilibrium solutions but as a function of for a simple model of how depends on for GMC disruption by radiation pressure on dust. Specifically, we assume
| (38) |
based on the scaling arguments and 1-D numerical models of Murray et al. (2010). These authors showed that for GMCs that are optically thin to far-infrared radiation (where is the GMC surface density), reaching a constant as GMCs become optically thick to far-infrared photons. Here, we identify with , the mean gas surface density in the galaxy, and adopt a light-to-mass ratio cm2 s-3. In this case, Figure 3 shows that increases by a factor of a few with ranging from to M⊙ pc-2, but that decreases with over this range. The flattening at M⊙ pc-2 is caused by the saturation of in the optically thick limit. We return to the prediction of decreasing with increasing in §4.5.
4 COMPARISON WITH OBSERVATIONS
4.1 CO conversion factor
One complication in comparing star formation models to observations arises because the molecular gas mass is usually estimated using CO emission lines that are optically thick. Furthermore, the CO mass is a small fraction of the total molecular mass and is therefore only an indirect tracer. The conversion factor between CO intensity and molecular gas column density depends on several factors, including the gas density, gas metallicity, gas temperature, gas turbulent velocity dispersion, and the ambient radiation field (e.g., Maloney & Black 1988; Glover & Mac Low 2011; Shetty et al. 2011; Genzel et al. 2012; Narayanan et al. 2012; Feldmann et al. 2012). An equivalent factor is related to by , where has units of cm-2/(K km s-1) and has units of M⊙ pc-2/(K km s-1).
In the local Universe, observations find a nearly constant for ordinary galaxies, including the Milky Way (e.g., Strong & Mattox 1996; Dame et al. 2001; Blitz et al. 2007). For local ULIRGs associated with galaxy mergers, a significantly lower conversion factor is inferred on the basis that a Milky Way-like factor would imply a gas mass exceeding the dynamical mass of the galaxy (Solomon et al. 1997). On the other hand, rises at low metallicities such as in the Small Magellanic Cloud (Blitz et al. 2007) and for high-redshift galaxies below a critical stellar mass (Genzel et al. 2012), probably because CO molecules are photo-dissociated by the UV radiation field as the attenuation by dust decreases (e.g., van Dishoeck & Black 1986; Wolfire et al. 2010).
The CO conversion factor is important for our comparison to observations because different assumptions lead to different relations and galaxy-averaged star formation efficiencies . One common assumption, adopted for example in the observational study of Genzel et al. (2010), is that of a bimodal conversion factor for non-mergers and for mergers. This assumption leads to a relation that is also bimodal, with mergers occupying an elevated locus. A similar result was found by Daddi et al. (2010a). Theoretical considerations have led other authors to propose an factor that depends smoothly on galaxy properties. Ostriker & Shetty (2011) suggested that should depend primarily on . Interpolating between (non-merger value) at M⊙ pc-2 and (merger value) at M⊙ pc-2 with a power-law, they propose that
| (39) |
Using this expression, they showed that the merger and non-merger galaxies in the Genzel et al. (2010) sample align on an uni-modal relation. In this picture, mergers have lower because they have higher characteristic .
Narayanan et al. (2012) performed radiative transfer calculations on simulations of merging and non-merging galaxies and predicted the dependence of on galaxy properties. Based on these calculations, these authors also advocate an that varies smoothly with galaxy properties, rather than a bimodal distribution between mergers and non-mergers. For solar metallicity, the calculations of Narayanan et al. (2012) yield a dependence on close to the empirical fit of Ostriker & Shetty (2011) in equation (39). Narayanan et al. (2012) also show, in agreement with Ostriker & Shetty (2011), that assuming a smoothly-varying as predicted by their analysis leads to a relation that has a smaller scatter than when assuming a bimodal model. They further argue that the scatter is reduced even for a range of galaxies excluding mergers, so that the smaller scatter is not simply due to using an unimodal , indicating that the dependence on is important.
A recent observational study using dust masses to estimate the gas masses of galaxies (Magdis et al. 2012) infers CO conversion factors consistent with the metallicity-dependent theoretical prediction of Narayanan et al. (2012) within uncertainties. This is the case even though the factor of ordinary high-redshift star forming galaxies is also formally consistent with a standard Milky Way value, owing to two factors. First, while ordinary high-redshift star forming galaxies have elevated star formation rates relative to local galaxies, their star formation is typically more spatially-extended than that in local mergers, so that the gas surface densities are often not as high as those of local mergers. Second, high-redshift galaxies generally have lower metallicity , which Narayanan et al. (2012) predict implies a larger at fixed .
In light of these considerations, we use an depending smoothly on as in equation (39) in our analysis.


4.2 Disc-averaged star formation law
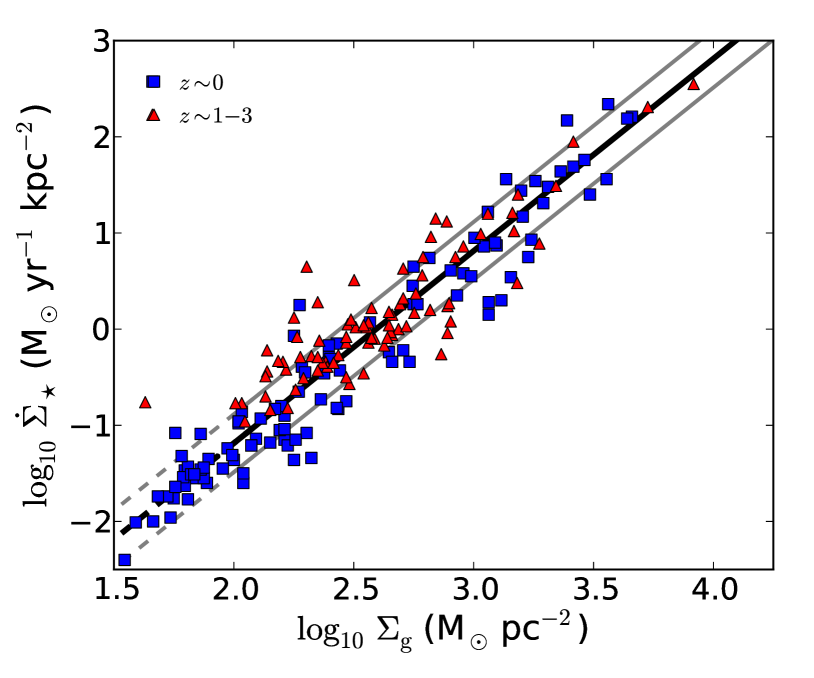
In Figure 4, we plot versus for the data compiled by Genzel et al. (2010), supplemented by a larger sample of star-forming galaxies from Tacconi et al. (2012). This compilation includes both ordinary and merging galaxies. In accordance with the range of applicability of our model, we focus on data for galaxies with M⊙ pc-2 and assume that all gas is molecular. We convert the gas surface densities from those reported by Genzel et al. (2010) and Tacconi et al. (2012) (who assume a bimodal ) to values obtained using equation (39). Figure 4 shows the data points converted in this way lie on a well-defined unimodal relation.
On this plot, we also show the model prediction in equation (18). We set in this comparison and also hold fixed to the fiducial value of km s-1. Departures from these assumptions are encapsulated in the dimensionless factor ; a good match to the data is obtained for . The fact that a good fit is found for a constant is consistent with the weak dependence of the momentum input by SNe on ambient density and turbulent gas velocity dispersion discussed in Appendix A. Interestingly, the star formation law that fits the M⊙ pc-2 data also fits the data well for as low as M⊙ pc-2, suggesting that our model may apply somewhat more broadly. Parallel grey lines indicate the range expected for gas-rich galaxies (see Fig. 2).
At very high gas surface densities, supernovae become increasingly ineffective due to radiative losses while radiation pressure on dust becomes more important in the volume-filling ISM (Appendix A). In the limit of the disc being optically thick to reprocessed infrared photons, , so we expect a flattening to . This is not visible in Figure 4 because of the paucity of the data points for M⊙ pc-2 (eq. 50) but is relevant for galactic nuclei (Thompson et al. 2005). Observations of a sample of local active galactic nuclei by Hicks et al. (2009) in fact support such a flattening in the relation at M⊙ pc-2.
4.3 Disc-averaged star formation efficiency
It is also useful to compare the star formation efficiency per free fall time in the disc predicted by equation (35) to the observations. We again compare with the galaxies compiled by Genzel et al. (2010) and Tacconi et al. (2012), but restrict ourselves to systems with M⊙ pc-2 in the rest of this section. Genzel et al. (2010) and Tacconi et al. (2012) calculate the star formation efficiency relative to the dynamical time of the disc, defined as , where is the half-light radius and is the maximum circular velocity. Since our star formation efficiency is defined relative to the free fall time in the disc (20), we multiply the values reported by these authors by a factor of 1.14 to use a consistent time scale (this is the ratio evaluated using eq. (13), for ).
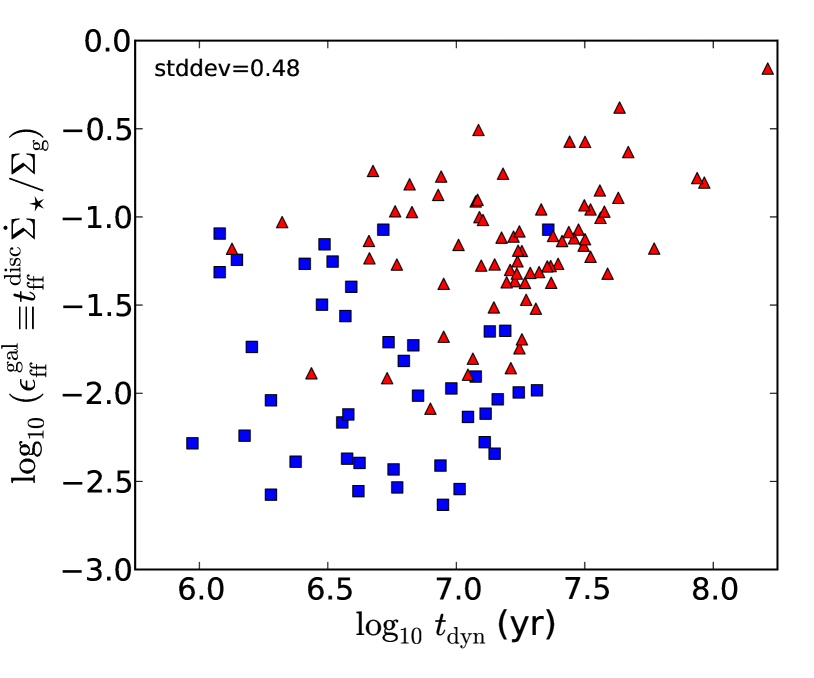
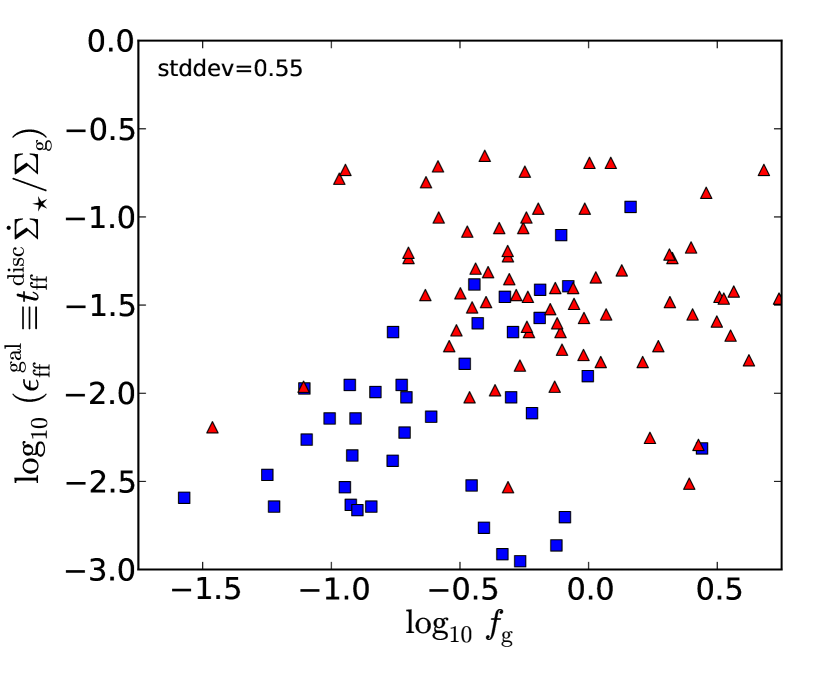
We compare the observationally inferred against several independent variables in order to investigate the relative scatter of different relations. In Figure 5, we show as a function of the observationally-inferred , , , and . The isothermal potential velocity dispersion is estimated as , where is the maximum observed circular velocity. The gas mass fraction is estimated from the observations as
| (40) |
where is the half-light radius. This follows from the definition and the simple dynamical model in §2.1. This approach is not guaranteed to yield an observationally-estimated , as must be the case physically. Figure 5 shows that it results in a subset of galaxies with inferred . We attribute this primarily to scatter due to observational uncertainties in the parameters entering in equation (40) and to the simplified dynamical model used. This small subset of galaxies with does not significantly affect our discussion. We emphasize that it is not due to our assumption of an factor varying continuously with . Adopting a bimodal with ordinary star-forming galaxies at high redshift having a Milky Way-like value as in some other studies (e.g., Daddi et al. 2010b; Genzel et al. 2010; Tacconi et al. 2012) increases the inferred gas mass for such galaxies and thus increases the number of systems with . This is shown in Figure 6, which shows the same data as in the upper right panel of Figure 5 but assuming a bi-modal for mergers and non-mergers, as in Genzel et al. (2010) and Tacconi et al. (2012), rather than the continuous from equation (39).
For each relation in Figure 5, we show in the top left corner of the panel the statistic stddev calculated by first fitting a linear relation in log-log space, then evaluating the standard deviation of the data points from the best fit. The uncertainty on the data points (not shown) is dominated by systematics; since it is difficult to estimate accurately, we assign equal weight to each data point.
The smallest scatter for the comparison of as a function of a single independent variable in Figure 5 is relative to , for which there is a monotonically increasing relation with stddev=0.39. Since depends on , one may worry that a spurious trend between and could result from scatter in the observational estimates. In Appendix D, we consider a model prediction equivalent to equation (37) (showing that for ), but expressed in terms of quantities that are measured independently of each other. The agreement between the data and the model prediction confirms that the observed trend of increasing with increasing is physical. For the other variables (, , and ), the scatter is larger stddev=0.48-0.54. Figure 6 also shows that the scatter in versus is substantially increased when a bimodal is assumed (stddev=0.55). This is, we believe, independent evidence that a continuous (as in eq. 39) is a better approximation. Regardless of whether a continuous or bimodal is adopted, the inferred values of vary by more than a factor of 100 for the molecule-rich galaxies in the sample considered. We return to this point in §5.2.
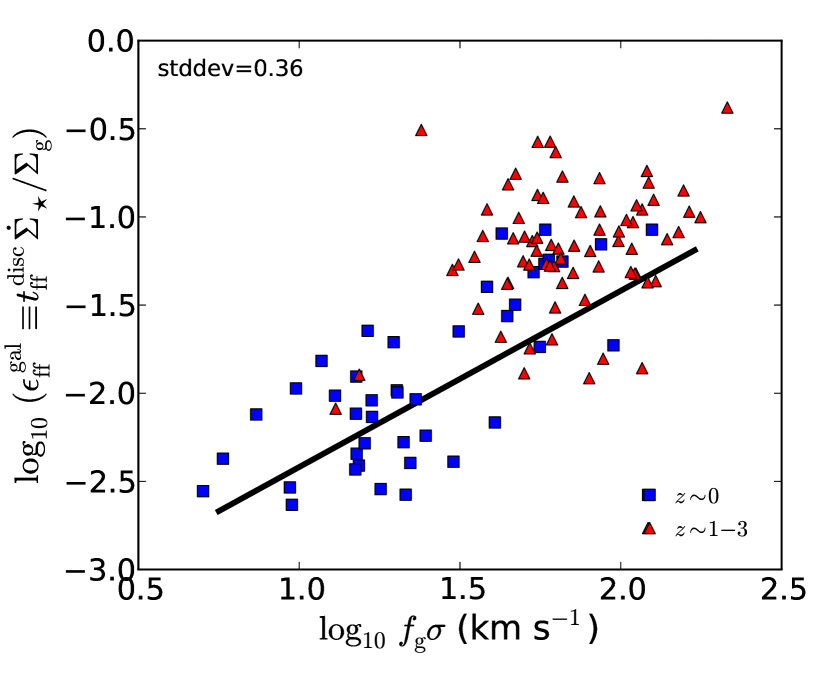
In Figure 7, we show similar comparisons but as a function of combinations of , , and . The left panel shows as a function of (stddev=0.36). The solid line in this panel is the theoretical prediction in equation (37), valid in the limit , for , km s-1, and (as in Figure 4). The agreement between the prediction and the data (both in normalization and in slope) is reasonable given the uncertainties in the data and the simplifications made in deriving this theoretical prediction. Moreover, this agreement emphasizes that the large scatter in versus in Figure 5 is not simply scatter about a universal value of . Rather, the scatter is significantly reduced when the dependence of on is accounted for. For finite , as must be the case in reality, the upturn from this simple prediction at large suggested by the data might be explained by an increase of with (see Fig. 3) or a decrease of with gas density, both of which are expected theoretically. The right hand panel of Figure 7 shows as a function of the best-fit linear combination of and . The best fit depends weakly on and the stddev=0.34 statistic is marginally improved relative to the fit with respect to alone, indicating that is the most important parameter.
While the simple GMC disruption model in equation (38) predicts a modest increase of with at fixed (see Fig. 3), a trend of with is not apparent in Figure 5. However, the predicted trend as a function of is weak relative to the scatter in the data points in Figure 5. More importantly, the trend is only predicted at fixed , while the data points cover dex in . The prediction of increasing with also relies on the accuracy of the GMC disruption model, which equation (38) undoubtedly oversimplifies. The more robust and general prediction of our feedback-regulated model of star formation is that scales with (eq. 37), which the data support (Fig. 7).
4.4 Turbulent velocity dispersion
Our theory also predicts the turbulent velocity dispersion as a function of galaxy properties. In the limit , and equation (9) implies that
| (41) |
Since different galaxies have different , we expect to vary from galaxy to galaxy. This is supported by observations. In particular, local ULIRGs have km s-1 and , so that equation (41) implies that km s-1 in such systems, comparable to what is inferred observationally (Downes & Solomon 1998). High-redshift () star-forming galaxies have comparably large gas fractions (e.g., Daddi et al. 2010b; Tacconi et al. 2010) and are also inferred to have velocity dispersions that are elevated (Cresci et al. 2009; Genzel et al. 2011) relative to local spirals, which have km s-1 (Dib et al. 2006).
In the limit , our model also predicts (eq. 22), a result previously noted by Ostriker & Shetty (2011). However, Ostriker & Shetty (2011) assumed a constant value motivated by a combination of observations (Krumholz & Tan 2007; Bigiel et al. 2008; Evans et al. 2009; Blanc et al. 2009) and numerical simulations of turbulent gas (Krumholz & McKee 2005; Shetty & Ostriker 2012). In contrast, we predict that both and scale with and that neither quantity is universal, in agreement with Thompson et al. (2005).
4.5 Fraction of disc gas mass in GMCs
A key aspect of the physical picture presented here is that, viewed from the GMC perspective, the star formation rate is determined primarily by the rate at which GMCs form in galactic discs and is nearly independent of sub-GMC scale physics. In particular, provided that (see eq. 31), the galactic star formation efficiency per free fall time depends only weakly on the efficiency with which GMCs turn their gas into stars (). This is possible because for any the GMC formation rate adjusts so as to maintain the value of set by the balance between momentum injection from stellar feedback and the gravitational weight of the disc gas at the mid-plane (eq. 18). For any model of the dependence of the GMC lifetime and on galaxy properties, this translates into a prediction for , the mass fraction of the disc gas collapsed into gravitationally-bound GMCs at any given time (see Fig. 2 and 3 for specific examples).
As discussed in §2, GMCs are defined in our model as gravitationally-bound clouds. This definition does not necessarily coincide with clouds identified based on their molecular gas content in the Milky Way or other Local Group galaxies. The properties of GMCs defined in this way also differ from clouds identified in quasi-virial equilibrium. In general, the mass fraction of gas in gravitationally-bound GMCs is greater than the mass fraction in quasi-virialized clouds, and their lifetime as gravitationally-bound clouds is also longer than the lifetime as a quasi-virialized clouds. In a purely molecular ISM, gravitational boundedness provides a well-defined criterion for identifying GMCs. When observations only permit measurement of the mass fraction in a more advanced state of gravitational collapse, our predictions for should however be interpreted as upper limits to the mass fraction in such dense clouds. It is worth noting that (or a variant) is often an input into analytic models, but in this work we derive and show how it depends on galaxy properties.121212Other models make predictions for the partition of the gas mass in atomic and molecular phases (e.g., Krumholz et al. 2009a), but do not distinguish between gravitationally bound and unbound gas in purely molecular media as our model does (see also Ostriker et al. 2010).
We consider now the simple scenario described more quantitatively in §3.3 and Figure 3, in which the GMC lifetime scales with the disc free fall time and GMCs are dispersed by radiation pressure on dust. In this scenario, saturates at a value as GMCs become optically thick to far-infrared photons. Quantitatively, this argument depends on the detailed properties of GMCs and how effectively re-processed far-infrared radiation is trapped by scattering on dust grains. Thanks to its scaling with , radiation pressure on dust is the only known stellar feedback process potentially capable of disrupting GMCs in the densest starbursts such as Arp 220. Thus, if radiation pressure on dust were less effective than estimated by Murray et al. (2010) (e.g., Krumholz & Thompson 2012), then GMCs in luminous starbursts would likely have even larger .131313Powerful outflows from star-forming clumps have been detected in high-redshift star-forming galaxies (Genzel et al. 2011; Newman et al. 2012), suggesting that stellar feedback is effective at dispersing them. Winds driven by young super star clusters are also observed to unbind cluster gas in the prototypical merging galaxies NGC 4038/4039 (the Antennae; Gilbert & Graham 2007). A robust prediction is therefore that in luminous starbursts should exceed the Milky Way value (e.g., Williams & McKee 1997; Murray 2011) by a factor .
Consider the example of the local ULIRG Arp 220 ( M⊙; Scoville et al. 1997). We fiducially assume and estimate using the data compiled in Genzel et al. (2010). For this galaxy, the GMC disruption theory of Murray et al. (2010) predicts . Therefore, equation (25) implies , in agreement with the more accurate numerical solutions in Figure 3.
Interestingly, high-resolution aperture synthesis CO observations of the nuclear gas disc in Arp 220 indicate a high area filling factor , suggesting that the molecular gas is more uniformly distributed than in less extreme systems (Scoville et al. 1997). In contrast, the volume-filling factor of molecular clouds in the inner Galaxy is (Roman-Duval et al. 2010; Kennicutt & Evans 2012) and is much lower in the rest of the Milky Way. The apparently-smooth CO-emitting gas distribution in ULIRGs in general has been interpreted to be connected to the smaller conversion factor in those systems (e.g., Solomon et al. 1997; Downes & Solomon 1998), in qualitative agreement with the prediction that is relatively small. It must be noted, though, that there is a possible alternative interpretation. In the central pc of ULIRGs, the mean gas density is typically cm-3 (see eq. 7) and nearly all the gas is in molecular form. Thus, even if a dominant mass fraction of the gas is collapsed in gravitationally-bound GMCs (), it is conceivable that the CO-emitting area filling factor appears unusually large simply because of the inter-cloud medium is sufficiently dense to be optically thick. More detailed modeling is needed to distinguish these possibilities observationally.
High-redshift () star-forming galaxies, with circular velocities and gas fractions comparable to local ULIRGs, also appear to have relatively low . Generally, is not directly measured since most existing observations instead trace the star formation rate or stellar mass of high-redshift galaxies. Estimates based on cosmological simulations suggest (Ceverino et al. 2010), although in our picture this quantity is sensitive to feedback parameters, which are highly uncertain in existing simulations. Recent observations with the Hubble Space Telescope however indicate that at most a fraction of the total stellar mass of such galaxies is contained in clumps. Integral field measurements by Genzel et al. (2011) furthermore find no prominent kinematical imprint at the locations of star-forming clumps, indicating that they cannot be dominant by mass.
The nuclei of local gas-rich spirals offer another promising opportunity to test our predictions. Galactic nuclei can have gas surface densities M⊙ pc-2 and have the advantage of being numerous in the nearby Universe. They can thus be observed at spatial resolution sufficient to resolve their molecular clouds. Rosolowsky & Blitz (2005) observed the nucleus of M64, where M⊙ pc-2 over a kpc diameter region. In spatially-resolved studies like this one, optically thick emission from 12CO can be used to infer to total gas mass, while transitions of molecules such as 13CO (only marginally optically thick) and HCN (with a critical density for the transition of cm-3) can be used to identify the locations of GMCs. The masses of GMCs can then be derived from measurements of their velocity dispersions and radii. In the future, such studies could be extended to statistical samples using existing interferometers such as the Combined Array for Research in Millimeter-wave Astronomy (CARMA)141414http://www.mmarray.org/ and ALMA.
Independent support for our physical picture is provided by numerical simulations. Dobbs et al. (2011) performed simulations of galactic discs with supernova feedback and varied the feedback energy per molecular gas mass formed via their parameter. In an experiment in which was increased from 0.05 to 0.2, the fraction of disc gas mass contained in GMCs is reduced by a factor of approximately two. For a fixed gas mass in which the feedback kinetic energy is injected, the momentum returned per GMC mass formed scales as in the simulations of Dobbs et al. (2011). Thus, the experiment of Dobbs et al. (2011) is consistent with the prediction in equation (25) that should be reduced .
5 DISCUSSION
5.1 Summary of the main results
We presented a physical picture connecting star formation in giant molecular clouds with the global star formation rate in galaxies. We focused on galaxies with gas surface density M⊙ pc-2 to simplify the theoretical treatment by avoiding explicit consideration of a multiphase (atomic and molecular) ISM; we expect, however, that our qualitative points apply to galaxies with lower surface density as well. The high gas surface density regime includes local starbursts, most star-forming galaxies at redshift , and the nuclei of nearby ordinary galaxies. Our theory builds on previous models of star formation which focused on feedback on scales of galactic discs (e.g., Silk 1997; Thompson et al. 2005; Ostriker & Shetty 2011) or GMCs (e.g., Matzner 2002; Krumholz & Matzner 2009; Murray et al. 2010). In particular, our model explicitly determines the relationship between the formation and destruction of GMCs and the galaxy-averaged star formation rate.
In our theory, the star formation rate of a galaxy and thus the star formation efficiency per free fall time is set largely by the balance between the gravity acting on the disc gas and the strength of stellar feedback in the bulk of the ISM (see also Thompson et al. 2005; Ostriker & Shetty 2011). If supernovae dominate the turbulence in the volume-filling ISM, this yields a star formation law (eq. 18). The integrated efficiency with which GMCs convert their gas into stars, , also enters into the galaxy-averaged star formation rate but only weakly (in spite of the fact that we assume that all star formation occurs in GMCs). This is possible because the formation rate of GMCs adjusts itself to ensure that a relation set by vertical hydrostatic equilibrium in the disc is satisfied, for any reasonable scenario of sub-GMC physics. This is realized via the Toomre parameter, which can obtain values above the classical stability threshold of unity so that the GMC formation rate is regulated. Our physical model is consistent with numerical simulations that find that the star formation rate of galaxies is not sensitive to the small-scale star formation law (e.g., Hopkins et al. 2011; Shetty & Ostriker 2012).
A key implication of our results is that in very dense galaxies where stellar feedback in GMCs is relatively ineffective and high efficiencies of star formation in GMCs, , are expected (e.g., Murray et al. 2010), the star formation efficiency of GMCs can exceed the galaxy-averaged star formation efficiency by a substantial factor. As a result, the low observed star formation efficiency of galaxies does not depend fundamentally on star formation being slow within GMCs (although this can be the case in some galaxies). While this fact is implicit in feedback-regulated models on galactic scales (e.g., Thompson et al. 2005; Ostriker & Shetty 2011), in this work we explicitly derived the quantitative relationship between the disc-averaged and GMC star formation efficiencies.
Our theory makes several predictions. In the limit in which the GMC formation rate is rapidly suppressed as the Toomre parameter of the disc exceeds unity (; see eq. 31), they are:
-
1.
The galaxy-averaged star formation efficiency per free fall time , as implied by hydrostatic equilibrium.
-
2.
The turbulent gas velocity dispersion as a result of the regulation to .
-
3.
The fraction of the disc gas mass collapsed in gravitationally-bound GMCs in order to satisfy the star formation law set by hydrostatic equilibrium in the disc.
In §4.3, we provide strong observational evidence that , in agreement with the first prediction (Fig. 7). The second prediction regarding the velocity dispersion depends only on and is thus very robust. It explains why gas-rich systems like local ULIRGs and high-redshift star-forming galaxies have velocity dispersions km s-1 (e.g., Downes & Solomon 1998; Genzel et al. 2011), significantly above more gas-poor local galaxies like the Milky Way (e.g., Dib et al. 2006; §4.4). The third prediction of a relatively small in dense galaxies where larger GMC star formation efficiencies are expected theoretically tentatively explains the smooth gas distributions and low CO conversion factors inferred in local ULIRGs (e.g., Scoville et al. 1997, Downes & Solomon 1998) and the small mass fraction in giant clumps in high-redshift galaxies (Genzel et al. 2011; Wuyts et al. 2012; §4.5).
We note that our main results can be generalized to feedback mechanisms other than supernovae and radiation pressure (such as photoionization or cosmic rays; e.g. McKee 1989, Socrates et al. 2008) by appropriate choices for and .
5.2 Role of turbulence
Turbulence has been invoked to regulate star formation in many models. In our theory, galactic discs are supported vertically by supersonic turbulence and the formation of GMCs relies on turbulent density fluctuations. The role of turbulence in our model is, however, different than in other popular theories of star formation. In particular, our theory does not rely on supersonic turbulence being maintained within GMCs, an assumption that Krumholz & McKee (2005) used to predict a nearly universal volumetric star formation law of of the gas mass turned into stars per free fall time in molecular gas (see also Padoan & Nordlund 2011; Federrath & Klessen 2012). As mentioned above, our theory allows for star formation efficiencies within GMCs as high as . There is in fact some tentative evidence in the Milky Way that some GMCs have star formation efficiencies significantly larger than predicted by theories based on the small-scale properties of supersonic turbulence (e.g., Murray 2011, and references therein). We suspect that this is even more likely to be true in denser galaxies.
Even if supersonic turbulence is maintained within GMCs, simulations show that in the absence of a mechanism to support the galactic disc on large scales (such as stellar feedback), self-gravitating regions collapse until their free fall time is very short. Therefore, even if the small-scale star formation efficiency is low, the star formation efficiency per galactic free fall time is in the absence of global support (e.g., Bournaud et al. 2010; Hopkins et al. 2012).
Our theory predicts that the volumetric star formation law is not universal either on galaxy scales () or GMC scales (). This is seemingly in conflict with the observational evidence compiled by Krumholz et al. (2012) in favor of a volumetric star formation law with a universal efficiency of per free fall time. We note that the overall scatter in the values inferred by Krumholz et al. (2012) for the molecule-rich galaxies considered in this work is comparable to the factor we find (Figs 5-7), regardless of whether we assume a continuously-varying or bimodal conversion factor (Fig. 6). The observational analysis of Krumholz et al. (2012) also includes ordinary local group galaxies and individual molecular clouds within the Milky Way, and thus covers a larger dynamic range than ours. The linear relationship between and over this large dynamic range likely reflects the fact that the star formation rate on average does scale inversely with the local free fall time, as advocated by those authors. Averaged over galaxies, however, Figure 7 shows that is not well described by a constant value with large scatter. Instead, the star formation efficiency correlates well with (particularly for our assumption of a continuously-varying ), in agreement with our feedback-regulated theory (eq. 37) but inconsistent with a universal volumetric star formation efficiency.
Finally, we note that our calculations suggest that stellar feedback can drive the turbulence required to explain the observed star formation law and gas velocity dispersions, without the need for additional sources such as cosmological accretion and radial inflow within galactic discs. Significant contributions from such sources cannot, however, be ruled out by our arguments.
5.3 Opportunities for numerical modeling
The analytic arguments presented here are subject to some uncertainties, which could be addressed by numerical modeling. One significant uncertainty is exactly how the GMC formation rate is regulated in a turbulent disc, especially when in the disc-averaged sense. We parameterized this uncertainty by the dimensionless function (eq. 31). For , and previous results based on the assumption that are recovered (§3.3), but this is not always accurate. Thus, it is important to better quantify the function in order to determine the accuracy of previous results. Analytic estimates suggest that (Appendix C; Hopkins 2012a). However, this is sensitive to density fluctuations on a scale comparable to the disc scale height. These fluctuations in turn depend on how turbulence is driven and the effects of disc rotation.
Similarly, we parameterized stellar feedback processes by the effective momentum injected into the ISM per stellar mass formed, , and carried out our numerical calculations using simple estimates for supernovae and radiation pressure on dust. These remain uncertain at the factor of few level. An important uncertainty for radiation pressure is the role radiation-hydrodynamic instabilities in facilitating the leakage of scattering photons. This problem has received some attention recently (e.g., Krumholz & Thompson 2012), but direct simulations have only been performed in specific idealized settings, such as a laminar background disc.
While the dynamics of individual supernova remnants have been the subject of many studies (e.g., Cioffi et al. 1988; Draine & Woods 1991; Thornton et al. 1998) the collective impact of multiple SNRs in realistic galactic discs does not follow simply from these studies. The effective depends not only the ambient density, but also the stage of SNR evolution at which it is evaluated. It is not clear how to accurately calculate this quantity in a real galaxy with an inhomogeneous ISM. Fortunately, the exact value of appears to depend only weakly on these details (see Appendix A). On the other hand, we also showed in §3.1 that the turbulent pressure in the ISM depends on the spatial scale on which the turbulence is driven relative to the disc scale height, the dimensionless factor . Thus, the turbulent pressure depends on how SNRs merge with the ambient ISM and/or interact with one another, a problem which controlled numerical experiments could address.
Acknowledgments
We thank Reinhard Genzel and Linda Tacconi for providing their compilation of gas and star formation rate measurements in electronic form. Ken Shen performed simulations of supernova remnants that informed our discussion of the momentum input by supernovae. We are also grateful to Leo Blitz for a discussion on the possibility of measuring in local galaxies and to Jacob Lynn for help with understanding large-scale turbulent fluctuations in supersonic turbulence. CAFG was supported by a fellowship from the Miller Institute for Basic Research in Science and NASA grant 10-ATP10-0187. EQ was supported by a Simons Investigator award from the Simons Foundation, the David and Lucile Packard Foundation, and the Thomas Alison Schneider Chair in Physics at UC Berkeley. Support for PFH was provided by NASA through Einstein Postdoctoral Fellowship Award Number PF1-120083 issued by the Chandra X-ray Observatory Center, which is operated by the Smithsonian Astrophysical Observatory for and on behalf of the NASA under contract NAS8-03060.
Appendix A Feedback parameters
An important parameter in the calculations of the main text is the effective momentum returned to the ISM per stellar mass formed, . Here we summarize relevant results on the importance of supernovae and radiation pressure on dust. Other processes – including HII regions, stellar winds, and proto-stellar winds – can be important in dwarf or Milky Way-like galaxies but are not effective at the densities considered in this work (Matzner 2002; Murray et al. 2010).
We distinguish between stellar feedback in the volume-filling ISM and in GMCs because the processes that dominate turbulence driving in the volume-filling ISM are generally different from those responsible for disrupting GMCs. In what follows, the superscript ‘disc’ corresponds to a process operating directly in the volume-filling ISM, while the superscript ‘GMC’ corresponds to a process operating within a GMC.
A.1 Supernovae
The first SNe explode a time Myr following a star formation event, which in dense starbursts is after the parent GMC has been dispersed (; see eq. 13). It follows that SNe typically explode in the volume-filling phase of the ISM. We are also interested in high-redshift, gas-rich star-forming galaxies, for which the lifetime of the massive star-forming clumps are inferred to be Myr (Wuyts et al. 2012). In these systems, it is not obvious that most SNe explode outside their parent GMC. In the Milky Way, where GMC lifetimes also exceed , it is nonetheless observed that GMCs often start to be disrupted prior to the onset of SNe (Rahman & Murray 2010). By analogy to the Milky Way, we assume that this is also the case in high-redshift galaxies.
In the Sedov and pressure-driven snow plow phases of supernova remnants (SNRs), the momentum of the swept up ambient medium can reach values exceeding that of the original supernova ejecta by a factor
| (42) | ||||
(Cioffi et al. 1988), where is the kinetic energy of the supernova ejecta, is their velocity, is the density of the ambient medium, and the exact pre-factor depends weakly on metallicity. Noting that the total rate of kinetic energy injection by supernovae is (e.g., Leitherer et al. 1999), where is the stellar bolometric luminosity,
| (43) |
We define to be the total mass of stars formed per supernova event and fiducially adopt M⊙ (e.g., Ostriker & Shetty 2011). In this case, equation (43) corresponds to
| (44) | ||||
where is the fraction of SNe exploding in the volume-filling ISM. We have introduced the dimensionless pre-factor to parameterize the uncertainty in the normalization of equation (44). In an inhomogeneous medium, the relevant density at which to evaluate equation (44) is the typical density where SNe explode. When massive stars outlive their parent GMCs, we can assume that SNe explode in random locations in the ISM. For a supersonically turbulent medium with Mach number , we define the effective density such that 50% of the volume has density . In Appendix B, we show that for a lognormal density probability distribution function (PDF). Thus, the effectiveness of supernova feedback in a dense ISM is not as reduced as would be inferred by evaluating equation (44) at the mean density.
Equations (42-44) assume a value for the momentum boost valid at infinity. Cioffi et al. (1988) show, however, that convergence to this asymptotic value is slow and that it is likely not fully realized in practice. In §3.1, we argued that for our purposes should be evaluated when the SNR velocity equals the turbulent gas velocity in the ISM, . We also evaluated using the semi-analytic approximations of Draine & Woods (1991) and found that ranges from km s-1 to km s-1 for cm-3 and final km s-1. The density dependence of is thus sufficiently weak that to a fair approximation it can be assumed constant for most observed galaxies, justifying our fiducial assumption of km s-1. Uncertainty in the precise value is encapsulated in the dimensionless parameter defined in equation (19).
Using the swept up mass and outer shock velocity from the numerical simulation results of Thornton et al. (1998), Thompson et al. (2005) estimated for SNe (their eq. 11 and associated text, in our notation). This scaling with density suggested that supernovae become subdominant relative to radiation pressure in the volume-filling dense ISM of starbursts for lower than estimated in §A.2.2. The Thornton et al. (1998) results for the late-time momentum of supernova remnants are not, however, consistent with our semi-analytic results based on Cioffi et al. (1988) and Draine & Woods (1991). As described above, the latter give a somewhat larger late-time momentum and a weaker dependence on ambient density. In particular, the Thornton et al. (1998) results for the velocity of the supernova shock (their eq. 23, which is evaluated at a time of , where is the time of peak remnant luminosity) do not appear consistent with those of Cioffi et al. (1988) and Draine & Woods (1991) while other remnant quantities are (e.g., radius, the time , etc.). New spherically-symmetric simulations confirm the results of Cioffi et al. (1988) and Draine & Woods (1991) (K. Shen 2013, private communication). These new results are also consistent with the SNR momentum inferred from the fits of Thornton et al. (1998) using the swept up mass and kinetic energy to calculate the momentum, instead of using the reported shock velocity directly.
A.2 Radiation pressure on dust
Radiation pressure on dust is the only known mechanism capable of disrupting GMCs in the densest starbursts. This is because radiation pressure on dust scales with the surface density of GMCs, so that it remains important to arbitrarily high densities (Murray et al. 2010). After the GMC is disrupted, radiation pressure from the surviving massive stars acts on the volume-filling ISM.
A.2.1 GMC disruption
When evaluating the effective from GMC disruption, we must account for the fraction of the momentum input used to overcome the self-gravity of the GMC. As before, we define as the fraction of a GMC mass that is converted into stars and let be the terminal velocity of the dispersed GMC gas (after being unbound but before being decelerated by mass loading of diffuse gas). Since the dispersed GMC has asymptotic momentum ,
| (45) |
The integrated GMC efficiency and the terminal velocity depend on the properties of the GMC and of the embedded stellar clusters.
Murray et al. (2010) report and values for their 1-D models of GMC disruption by radiation pressure on dust. For the local ULIRG Arp 220 ( M⊙ pc-2), the local starburst M82 ( M⊙ pc-2), and the star-forming galaxy BX482 ( M⊙ pc-2) equation (45) implies km s-1, respectively. Assuming the scaling in equation (44) for , unless cm-3, indicating that supernovae in the volume-filing medium dominate over GMC disruption in driving turbulence in the volume-filling ISM in essentially all realistic conditions, in agreement with the analytic argument given by Ostriker & Shetty (2011).
Some caveats are in order here, since the effective from GMC disruption depends somewhat on the internal structure of GMCs and their time-dependent evolution. We cannot rule out that GMC disruption may be more important for turbulence in the volume-filling medium than estimated above. In addition, once the GMC starts to disrupt, the massive stars continue to input momentum into the ambient medium, as discussed in §A.2.2. This may be more important than GMC disruption in driving turbulence in the ISM.151515In their numerical simulations, Hopkins et al. (2011) found that radiation pressure alone was capable of regulating the star formation law to be comparable to that found in Kennicutt’s (1989) observational sample. We note, however, that the version of the KS law Hopkins et al. (2011) compared to – from Kennicutt (1989) – is higher in normalization at g cm-2 by a factor of than the data utilized in this paper. As a result, the Hopkins et al. (2011) radiation pressure feedback only simulations of high star formation rate galaxies (e.g., their Sbc and HiZ models) would have star formation rates larger than the data utilized in this paper by a factor of . However, the subsequent models by Hopkins et al. (2012) include additional feedback processes, including SNe, and are in much better agreement with the data for the KS law used here.
Giant clumps in high-redshift star-forming galaxies occupy an interesting region of parameter space in which photoionization is ineffective (Matzner 2002; Murray et al. 2010), radiation pressure is only marginally capable of disrupting the clumps (with ; Murray et al. 2010), but the free fall time in the clumps
| (46) |
is sufficiently long that supernovae may play an important role in disrupting them. This should be studied in more detail in future work.
A.2.2 Direct action on the volume-filling ISM
The volume-filling medium can also be optically thick to reprocessed far infrared (FIR) radiation (e.g., Scoville 2003; Thompson et al. 2005; Andrews & Thompson 2011).161616The ISM is always optically thick in the UV for the galaxies we consider. The momentum flux provided by radiation from massive stars is then
| (47) |
where is the effective IR optical depth. The term enters because confinement of IR photons by multiple scatterings boosts the momentum flux, in a manner analogous to the hot gas confinement that gives rise to the momentum boost in SNRs.
The IR opacity of dust is temperature-dependent, but peaks at cm2 g-1 in the model of Semenov et al. (2003) for K ( drops sharply for K owing to dust sublimation). Defining the vertical optical depth of the disc as for the case of a homogeneous gas distribution,
| (48) | ||||
where we scale the result with gas-phase metallicity, , relative to solar. The effective differs from this estimate because anisotropies in the column density distribution can provide paths of least resistance through which the scattered photons can escape. The magnitude of this effect depends on the column density distribution, and also possibly on radiation-hydrodynamic instabilities (e.g., Krumholz & Thompson 2012; Jiang et al. 2012). We parameterize this effect using the dimensionless factor , such that .
Let be the efficiency with which star formation converts rest mass into radiation. Neglecting confinement of the reprocessed radiation, the radiative momentum released is simply . In general, we thus have
| (49) | ||||
where is the fraction of the radiation emitted in the disc. Equation (49) equals when
| (50) | ||||
Above this gas surface density (corresponding to for the fiducial parameters above), radiation pressure on dust dominates the vertical pressure support over supernova feedback. For this optical depth, the analytic estimates of Hopkins et al. (2011) imply a modest inefficiency factor . In particular, equation (50) implies that radiation pressure is particularly important in galactic nuclei for pc (as in, e.g., the Thompson et al. 2005 model).
Appendix B Density PDF for supersonic turbulence
We assume that the gas density distribution in the ISM is determined by the properties of isothermal supersonic turbulence. Simulations of driven turbulence then imply that the mass-weighted density PDF is well described by a lognormal distribution:
| (51) |
where and is the mean of the distribution (e.g., Nordlund & Padoan 1999; Ostriker et al. 2001; Lemaster & Stone 2008). The constraint that implies that . The volume-weighted PDF, , is given by the same expression with the simple replacement .
Federrath et al. (2008) showed that the lognormal parameters depend on both the Mach number of the turbulence on the driving scale and on the relative importance of solenoidal and compressive driving modes. To a good approximation,
| (52) |
where for pure solenoidal driving, for pure compressive driving, and intermediate values of correspond to solenoidal and compressive mixtures. For a random mixture of solenoidal and compressive modes, .
Figure 8 shows the integrated fractions of the mass and volume contributed by over-densities , as a function of . We heuristically postulate that SNe acting outside GMCs are embedded in an ISM of effective density such that . A simple approximation is that
| (53) |
For a starburst with Mach number , the effective volume-filling density is therefore about 6% of the mean ISM density.
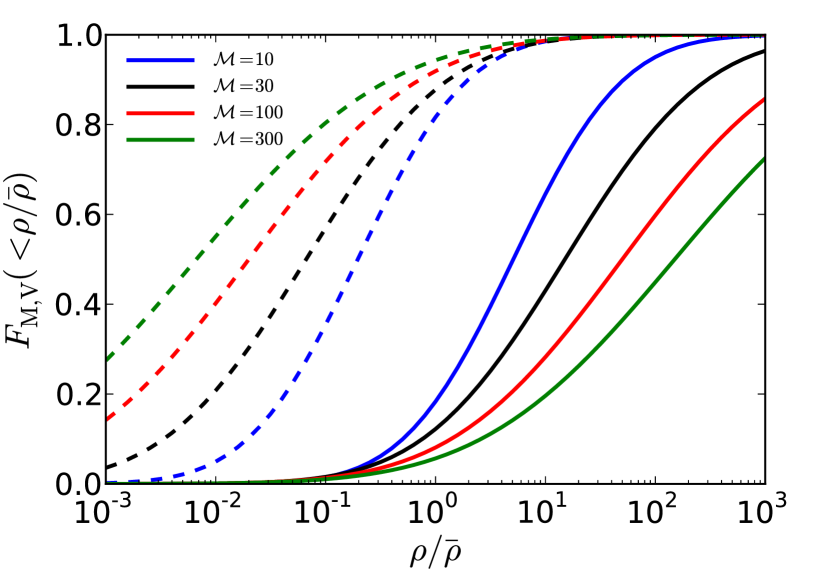
Appendix C Collapsed fraction in turbulent disc
We derive here an approximation to the fraction of the gas mass in the turbulent disc that is unstable to gravitational collapse at any time, (see eq. 28). The approximation is based on the assumption that most of the collapsed mass is contained in the most massive GMCs, corresponding to a spatial scale of order the disc scale height .
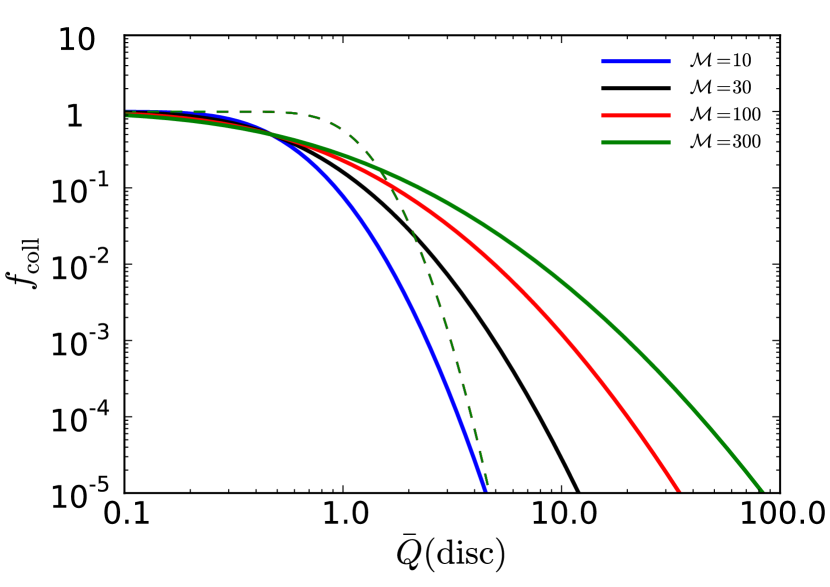
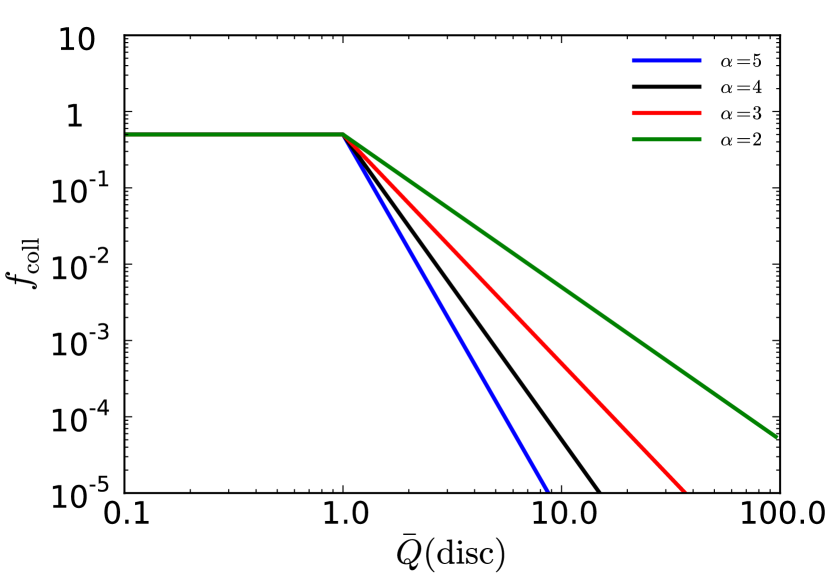
Since in a steady-state disc with (eq. 32), if and only if GMCs survive for a disc free fall time (). Physically, this arises because if GMCs live longer, then the steady-state mass in GMCs can exceed the instantaneous fraction of the turbulent disc gas mass that is unstable to gravitational collapse.
For a disc with global , we define the collapsed fraction as the fraction of the total gas mass with , where is the parameter evaluated after smoothing the gas density distribution on a scale . In the main text, is abbreviated to simply . Since there are in general fluctuations on spatial scales , . A more accurate derivation improving the standard Toomre analysis for a turbulent disc is possible using the excursion set formalism (Hopkins 2012a). For our numerical calculations in the main text, we in fact use the analytic approximations derived in Hopkins (2012a), but present here a simpler derivation that makes the origin of the qualitative behavior with more transparent.
We must first quantify the gas density fluctuations smoothed over the scale . Equation (52) was derived for simulated turbulence in a static box with periodic boundary conditions and applies to the point PDF. In general, it is non-trivial to generalize this expression to the PDF of the density smoothed on a scale because the latter depends on how the turbulence is driven, and how it is suppressed on large scales by finite mass and rotation effects. We adopt a simple model proposed by Hopkins (2012b), in which an analog of equation (52) is assumed to apply on a -by- basis:
| (54) |
where is the Mach number on scale . If the turbulence power spectrum , where , then . For a Burgers power spectrum, , . The real-space variance on scale is then
| (55) |
where we assume a top-hat window function in space.
The denominator in equation (54) was introduced to capture the suppression of turbulent fluctuations on scales owing to a combination of finite mass and rotation effects. It is motivated by the Toomre dispersion relation
| (56) |
which implies that differential rotation in the disc provides an effective pressure analogous to on scales , so that . The suppression of the density fluctuations on scales is critical to the strong suppression of for that we find below. However, the exact magnitude and functional form of this suppression is uncertain and an important problem for future work is to quantify this more accurately using numerical simulations.
The local parameter smoothed on a scale is
| (57) |
Taking as a disc constant,171717Since (eq. 10), this is equivalent to parametrizing the disc by a constant and viewing gravitationally collapsed regions as corresponding to upward density fluctuations about the mean relation implied by equation (55). In reality, both and are likely to fluctuate spatially, possibly with non-trivial correlations. These effects are not captured by our analytic estimate. if and only if
| (58) |
Thus, the collapsed fraction estimated using this heuristic Toomre-scale argument is
| (59) | ||||
where the subscript is used to denote quantities smoothed over a scale .
Using the excursion set (EPS) formalism, Hopkins (2012a) shows that the “maximum instability scale” in a turbulent disc is close to but distinct from . Hopkins (2012a) also obtains a more rigorous estimate of the collapse fraction valid for and accounting for the full mass spectrum of GMCs:
| (60) |
where is a parameter approximating the complex shape of the collapse barrier.
The left-hand panel in Figure 9 compares and as a function of for several Mach numbers. For , the predicted collapsed fraction is , as expected since the disc is unstable in an average sense. For , GMCs only form where turbulent density fluctuations are large enough to locally bring (in the Toomre heuristic picture). Since density fluctuations are suppressed by rotation and finite mass effects on scale , the collapse fraction decreases rapidly as is increased above unity. The right-hand panel shows power-law approximations used for analytic estimates in §3.3; values of the exponent (see eq. 31) provide reasonable approximations for Mach numbers .
Appendix D Trend of the star formation efficiency with gas fraction
In §4.3, we compiled observations showing that the disc-averaged star formation efficiency increases with increasing gas mass fraction in the disc. Since depends on , a potential concern is that the observed trend between and could be an artifact of scatter in the observational estimates. We show here that the observed trend is in fact physical by considering an equivalent relationship between quantities that are measured independently.
We focus on the case . Then, . Using , we find that the prediction in equation (37) is equivalent to
| (61) |
where , , and are all measured independently. Figure 10 compiles the same observations as in §4.3 but for as a function of the parameter on the right-hand side of equation (61). The Figure assumes km s-1, as appropriate for supernova feedback, and a CO conversion factor varying continuously with as before. The Figure also shows the model prediction in equation (61) for , the normalization determined by the observed relation (Fig. 4). The agreement between the data and this prediction of our feedback-regulated theory confirms that the trend of increasing with increasing is not an artifact of common parameter dependencies.
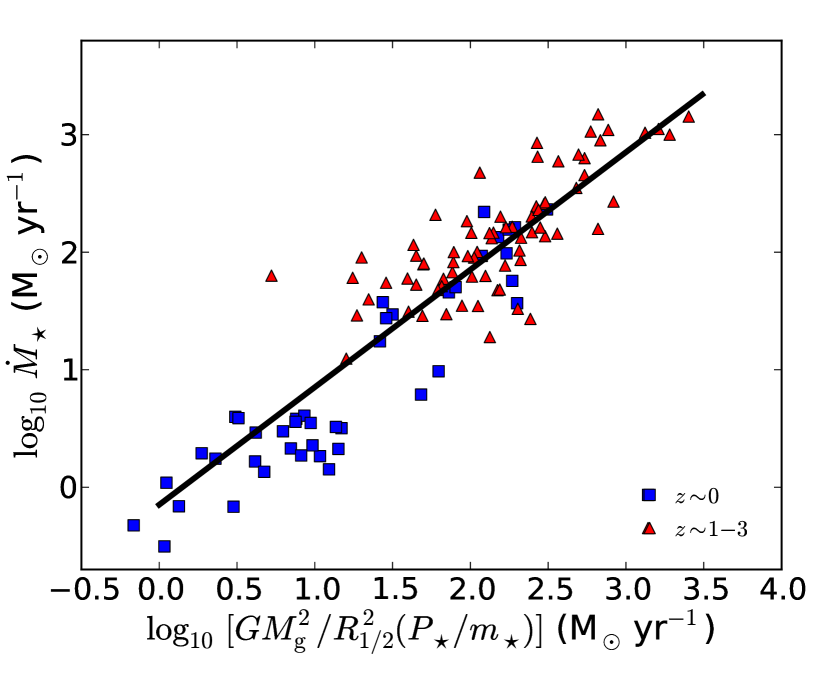
References
- Andrews & Thompson (2011) Andrews B. H., Thompson T. A., 2011, ApJ, 727, 97
- Behroozi et al. (2012) Behroozi P. S., Wechsler R. H., Conroy C., 2012, ArXiv e-prints
- Bigiel et al. (2008) Bigiel F., Leroy A., Walter F., Brinks E., de Blok W. J. G., Madore B., Thornley M. D., 2008, AJ, 136, 2846
- Blanc et al. (2009) Blanc G. A., Heiderman A., Gebhardt K., Evans II N. J., Adams J., 2009, ApJ, 704, 842
- Blitz et al. (2007) Blitz L., Fukui Y., Kawamura A., Leroy A., Mizuno N., Rosolowsky E., 2007, Protostars and Planets V, pp 81–96
- Bolatto et al. (2008) Bolatto A. D., Leroy A. K., Rosolowsky E., Walter F., Blitz L., 2008, ApJ, 686, 948
- Boulares & Cox (1990) Boulares A., Cox D. P., 1990, ApJ, 365, 544
- Bournaud et al. (2010) Bournaud F., Elmegreen B. G., Teyssier R., Block D. L., Puerari I., 2010, MNRAS, 409, 1088
- Ceverino et al. (2010) Ceverino D., Dekel A., Bournaud F., 2010, MNRAS, 404, 2151
- Cioffi et al. (1988) Cioffi D. F., McKee C. F., Bertschinger E., 1988, ApJ, 334, 252
- Cresci et al. (2009) Cresci et al. 2009, ApJ, 697, 115
- Daddi et al. (2007) Daddi E., Dickinson M., Morrison G., Chary R., Cimatti A., Elbaz D., Frayer D., Renzini A., Pope A., Alexander D. M., Bauer F. E., Giavalisco M., Huynh M., Kurk J., Mignoli M., 2007, ApJ, 670, 156
- Daddi et al. (2010a) Daddi et al. 2010a, ApJL, 714, L118
- Daddi et al. (2010b) Daddi et al. 2010b, ApJ, 713, 686
- Dame et al. (2001) Dame T. M., Hartmann D., Thaddeus P., 2001, ApJ, 547, 792
- Dib et al. (2006) Dib S., Bell E., Burkert A., 2006, ApJ, 638, 797
- Dobbs et al. (2011) Dobbs C. L., Burkert A., Pringle J. E., 2011, MNRAS, 417, 1318
- Downes & Solomon (1998) Downes D., Solomon P. M., 1998, ApJ, 507, 615
- Draine & Woods (1991) Draine B. T., Woods D. T., 1991, ApJ, 383, 621
- Erb et al. (2006) Erb D. K., Steidel C. C., Shapley A. E., Pettini M., Reddy N. A., Adelberger K. L., 2006, ApJ, 647, 128
- Evans et al. (2009) Evans et al. 2009, ApJS, 181, 321
- Federrath & Klessen (2012) Federrath C., Klessen R. S., 2012, ArXiv e-prints
- Federrath et al. (2008) Federrath C., Klessen R. S., Schmidt W., 2008, ApJL, 688, L79
- Feldmann et al. (2012) Feldmann R., Gnedin N. Y., Kravtsov A. V., 2012, ApJ, 747, 124
- Genel et al. (2012) Genel S., Dekel A., Cacciato M., 2012, MNRAS, 425, 788
- Genzel et al. (2010) Genzel et al. 2010, MNRAS, 407, 2091
- Genzel et al. (2011) Genzel et al. 2011, ApJ, 733, 101
- Genzel et al. (2012) Genzel et al. 2012, ApJ, 746, 69
- Gilbert & Graham (2007) Gilbert A. M., Graham J. R., 2007, ApJ, 668, 168
- Glover & Mac Low (2011) Glover S. C. O., Mac Low M.-M., 2011, MNRAS, 412, 337
- Goldreich & Lynden-Bell (1965) Goldreich P., Lynden-Bell D., 1965, MNRAS, 130, 97
- Heiderman et al. (2010) Heiderman A., Evans II N. J., Allen L. E., Huard T., Heyer M., 2010, ApJ, 723, 1019
- Hicks et al. (2009) Hicks E. K. S., Davies R. I., Malkan M. A., Genzel R., Tacconi L. J., Müller Sánchez F., Sternberg A., 2009, ApJ, 696, 448
- Hopkins (2012a) Hopkins P. F., 2012a, ArXiv e-prints
- Hopkins (2012b) Hopkins P. F., 2012b, MNRAS, 423, 2016
- Hopkins et al. (2011) Hopkins P. F., Quataert E., Murray N., 2011, MNRAS, 417, 950
- Hopkins et al. (2012) Hopkins P. F., Quataert E., Murray N., 2012, MNRAS, 421, 3488
- Jiang et al. (2012) Jiang Y.-F., Davis S. W., Stone J., 2012, ArXiv e-prints
- Joung et al. (2009) Joung M. R., Mac Low M.-M., Bryan G. L., 2009, ApJ, 704, 137
- Kennicutt & Evans (2012) Kennicutt R. C., Evans N. J., 2012, ARA&A, 50, 531
- Kennicutt (1989) Kennicutt Jr. R. C., 1989, ApJ, 344, 685
- Kennicutt (1998) Kennicutt Jr. R. C., 1998, ApJ, 498, 541
- Kennicutt et al. (2007) Kennicutt et al. 2007, ApJ, 671, 333
- Kritsuk & Norman (2002) Kritsuk A. G., Norman M. L., 2002, ApJL, 569, L127
- Krumholz & Burkert (2010) Krumholz M., Burkert A., 2010, ApJ, 724, 895
- Krumholz et al. (2012) Krumholz M. R., Dekel A., McKee C. F., 2012, ApJ, 745, 69
- Krumholz & Matzner (2009) Krumholz M. R., Matzner C. D., 2009, ApJ, 703, 1352
- Krumholz & McKee (2005) Krumholz M. R., McKee C. F., 2005, ApJ, 630, 250
- Krumholz et al. (2009a) Krumholz M. R., McKee C. F., Tumlinson J., 2009a, ApJ, 693, 216
- Krumholz et al. (2009b) Krumholz M. R., McKee C. F., Tumlinson J., 2009b, ApJ, 699, 850
- Krumholz & Tan (2007) Krumholz M. R., Tan J. C., 2007, ApJ, 654, 304
- Krumholz & Thompson (2012) Krumholz M. R., Thompson T. A., 2012, ArXiv e-prints
- Lacki et al. (2010) Lacki B. C., Thompson T. A., Quataert E., 2010, ApJ, 717, 1
- Lacki et al. (2011) Lacki B. C., Thompson T. A., Quataert E., Loeb A., Waxman E., 2011, ApJ, 734, 107
- Lada et al. (2010) Lada C. J., Lombardi M., Alves J. F., 2010, ApJ, 724, 687
- Larson (1981) Larson R. B., 1981, MNRAS, 194, 809
- Leitherer et al. (1999) Leitherer C., Schaerer D., Goldader J. D., Delgado R. M. G., Robert C., Kune D. F., de Mello D. F., Devost D., Heckman T. M., 1999, ApJS, 123, 3
- Lemaster & Stone (2008) Lemaster M. N., Stone J. M., 2008, ApJL, 682, L97
- Mac Low (1999) Mac Low M.-M., 1999, ApJ, 524, 169
- Magdis et al. (2012) Magdis et al. 2012, ArXiv e-prints
- Maloney & Black (1988) Maloney P., Black J. H., 1988, ApJ, 325, 389
- Martin & Kennicutt (2001) Martin C. L., Kennicutt Jr. R. C., 2001, ApJ, 555, 301
- Matzner (2002) Matzner C. D., 2002, ApJ, 566, 302
- McKee (1989) McKee C. F., 1989, ApJ, 345, 782
- Murray (2011) Murray N., 2011, ApJ, 729, 133
- Murray & Chang (2012) Murray N., Chang P., 2012, ApJ, 746, 75
- Murray et al. (2010) Murray N., Quataert E., Thompson T. A., 2010, ApJ, 709, 191
- Murray & Rahman (2010) Murray N., Rahman M., 2010, ApJ, 709, 424
- Narayanan et al. (2012) Narayanan D., Krumholz M. R., Ostriker E. C., Hernquist L., 2012, MNRAS, 421, 3127
- Newman et al. (2012) Newman et al. 2012, ApJ, 761, 43
- Nordlund & Padoan (1999) Nordlund Å. K., Padoan P., 1999, in Franco J., Carraminana A., eds, Interstellar Turbulence The Density PDFs of Supersonic Random Flows. p. 218
- Ostriker et al. (2010) Ostriker E. C., McKee C. F., Leroy A. K., 2010, ApJ, 721, 975
- Ostriker & Shetty (2011) Ostriker E. C., Shetty R., 2011, ApJ, 731, 41
- Ostriker et al. (2001) Ostriker E. C., Stone J. M., Gammie C. F., 2001, ApJ, 546, 980
- Padoan & Nordlund (2011) Padoan P., Nordlund Å., 2011, ApJ, 730, 40
- Piontek & Ostriker (2005) Piontek R. A., Ostriker E. C., 2005, ApJ, 629, 849
- Quirk (1972) Quirk W. J., 1972, ApJL, 176, L9
- Rafikov (2001) Rafikov R. R., 2001, MNRAS, 323, 445
- Rahman & Murray (2010) Rahman M., Murray N., 2010, ApJ, 719, 1104
- Roman-Duval et al. (2010) Roman-Duval J., Jackson J. M., Heyer M., Rathborne J., Simon R., 2010, ApJ, 723, 492
- Rosolowsky (2005) Rosolowsky E., 2005, PASP, 117, 1403
- Rosolowsky & Blitz (2005) Rosolowsky E., Blitz L., 2005, ApJ, 623, 826
- Schruba et al. (2011) Schruba et al. 2011, AJ, 142, 37
- Scoville (2003) Scoville N., 2003, Journal of Korean Astronomical Society, 36, 167
- Scoville et al. (1997) Scoville N. Z., Yun M. S., Bryant P. M., 1997, ApJ, 484, 702
- Semenov et al. (2003) Semenov D., Henning T., Helling C., Ilgner M., Sedlmayr E., 2003, A&A, 410, 611
- Shetty et al. (2011) Shetty R., Glover S. C., Dullemond C. P., Ostriker E. C., Harris A. I., Klessen R. S., 2011, MNRAS, 415, 3253
- Shetty & Ostriker (2012) Shetty R., Ostriker E. C., 2012, ApJ, 754, 2
- Silk (1997) Silk J., 1997, ApJ, 481, 703
- Socrates et al. (2008) Socrates A., Davis S. W., Ramirez-Ruiz E., 2008, ApJ, 687, 202
- Solomon et al. (1997) Solomon P. M., Downes D., Radford S. J. E., Barrett J. W., 1997, ApJ, 478, 144
- Solomon et al. (1987) Solomon P. M., Rivolo A. R., Barrett J., Yahil A., 1987, ApJ, 319, 730
- Stone et al. (1998) Stone J. M., Ostriker E. C., Gammie C. F., 1998, ApJL, 508, L99
- Strong & Mattox (1996) Strong A. W., Mattox J. R., 1996, A&A, 308, L21
- Tacconi et al. (2008) Tacconi et al. 2008, ApJ, 680, 246
- Tacconi et al. (2010) Tacconi et al. 2010, Nature, 463, 781
- Tacconi et al. (2012) Tacconi et al. 2012, ArXiv e-prints
- Thompson et al. (2005) Thompson T. A., Quataert E., Murray N., 2005, ApJ, 630, 167
- Thompson et al. (2009) Thompson T. A., Quataert E., Murray N., 2009, MNRAS, 397, 1410
- Thornton et al. (1998) Thornton K., Gaudlitz M., Janka H.-T., Steinmetz M., 1998, ApJ, 500, 95
- Toomre (1964) Toomre A., 1964, ApJ, 139, 1217
- van Dishoeck & Black (1986) van Dishoeck E. F., Black J. H., 1986, ApJS, 62, 109
- Vázquez-Semadeni et al. (2010) Vázquez-Semadeni E., Colín P., Gómez G. C., Ballesteros-Paredes J., Watson A. W., 2010, ApJ, 715, 1302
- Williams & McKee (1997) Williams J. P., McKee C. F., 1997, ApJ, 476, 166
- Wolfire et al. (2010) Wolfire M. G., Hollenbach D., McKee C. F., 2010, ApJ, 716, 1191
- Wong & Blitz (2002) Wong T., Blitz L., 2002, ApJ, 569, 157
- Wuyts et al. (2012) Wuyts et al. 2012, ApJ, 753, 114