Scaling of Non-Saturating MR and quantum oscillations in pristine and ion-implanted HOPG
Abstract
A wide variety of resistive and field dependent behaviors have been previously observed in both doped and non-doped Highly Oriented Pyrolytic Graphite (HOPG). We find HOPG samples to vary significantly in their temperature dependent resistances, even between portions taken from the same sample, yet they exhibit consistent non-saturating magnetoresistance (MR). The scaling behavior of the MR is shown to be characteristic of a model based on the Hall effect in granular materials. In addition to the large, field-linear MR, all samples exhibit Shubnikov-de Haas (SdH) oscillations. Additional samples were doped via ion-implantation by boron and phosphorous, but show no signs of superconductivity nor any systematic change in their magnetoresistive behavior. Analysis of the SdH data gives a 2D carrier density in agreement with previous results, and a large mean-free path relative to crystallite size, even in samples with thin ion-implanted surface layers.
pacs:
PACS numberyear number number identifier Date text]date
Highly oriented pyrolytic graphite (HOPG) is a commercial product that finds uses in areas diverse as neutron monochrometersdachs and ultra-flat substrates for scanning probe microscopy.baro More recently, hints of magnetism and superconductivity have been reported in HOPG, the latter reportedly extending to 400 KKopelevich2000 . Ion implantation of HOPG with phosphorous has been reported to induce superconductivity at low doses of low energy ions. Very large, non-saturating magnetoresistance and evidence for Shubnikov-de Haas (SdH) oscillations have also been found.Kopelevich1999 ; amdt Large variations in transport and magnetic properties between samples, and even on portions of the same sample, are common.kempa HOPG materials are typically characterized by their degree of mosaicity, by which is meant the angular spread of the c-axis orientation of component graphite crystallites. For example, ZYA quality is stated to have a mosaic spread of and is of the highest quality commercially available. Crystallite size (up to 10 m for ZYA), intergranular connectivity, and possible interstitial impurities are clearly candidates for the large variation in electrical and magnetic properties.
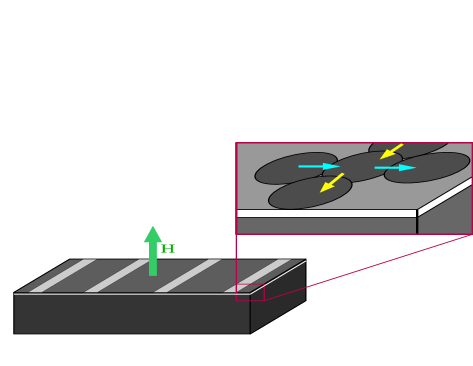
In this paper, we focus on magnetoresistive (MR) effects and attempt to separate intrinsic properties of the component graphite crystallites from the extrinsic effects associated with the composite nature of HOPG. We show that the microscopic properties, as revealed by the SdH oscillations, are independent of the bulk dc resistance. However, the very inhomogeneity of the material, composed of crystallites of different sizes and orientation, leads to important physical effects, with nonsaturating magnetoresistanceKopelevich2003 prominent among them. Similar observations of linear magnetoresistance have been reported on silver chalcogenides and were shown to persist to 60 T.hussman An explanation was proposed by Parish and Littlewood,parrish who modeled the inhomogeneous conductor as an array of coupled four-terminal circuit elements, as disks in which four currents can enter from adjacent elements. Each disk is characterized by its scalar resistivity and Hall resistivity , where is the mobility and , the applied field. As the field increases, the Hall effect in each crystallite causes current to flow through terminals that are normal to the electric field, giving rise to the large linear MR that is observed. Allowing for an average mobility and a standard deviation , Parish and Littlewood determined the crossover between quadratic dependence on magnetic field, for fields below a characteristic value , and linear behavior above. For small, as we might expect for HOPG, the crossover field is of order and the overall scale of the MR, proportional to .
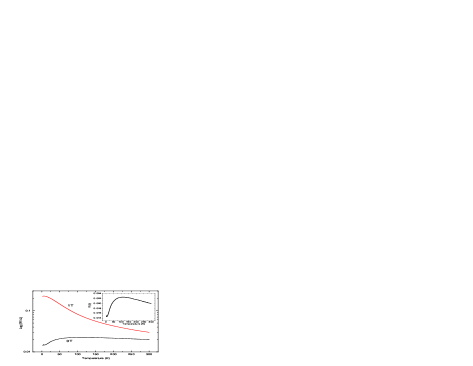
Samples for this study were obtained from ND-MDT Corp. and were of ZYA quality. Certain samples were subjected to ion implantation by boron at various dose levels and ion energies ranging from 10 to 40 keV in an effort to induce surface superconductivity within the ion-implantation range. No evidence for superconductivity was found, and the MR behavior of irradiated samples, as will be seen, is identical to as-received material. With one exception, all samples were cut to approximately 2 mm x 4mm, with four silver contacts placed across the width of the sample as seen in Fig.1. The spacing of the inner pair (voltage contacts) was identical for all samples. Four-terminal resistivity measurements were carried out using a Quantum Design PPMS system over the temperature range 2K – 300 K and up to 7 T. The inset to Fig. 1 shows typical data on a ZYA sample which shows semiconducting-like behavior above K and metallic behavior below. As seen in the main portion of Fig.2, the low temperature resistance increases by a factor of 20 in a field of 1 T, and is semiconducting-like through the entire temperature range.
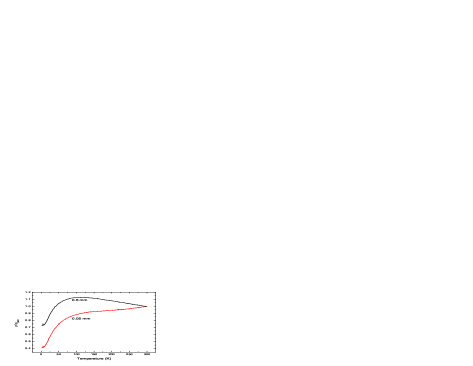
As an example of the wide variation in the temperature dependence of HOPG, Fig.3 shows the normalized resistivity a sample of thickness 0.5 mm along with that of a thin portion of the same sample having a thickness of 0.05 mm. While the thicker sample shows the same behavior as the sample in Fig.2, the thinner sample is metallic over the entire temperature range.
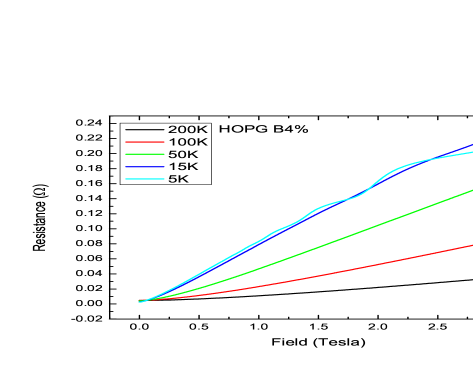
The nonsaturating MR is shown in Fig.4 for a sample that had been ion implanted with boron at a level of 3 percent at an energy of 20 keV. At low temperatures, pronounced oscillations are observed which cause an apparent maximum in the resistivity near 15 K when plotted versus temperature at a fixed field of 3 T. Such downturns in resistance at low temperature have been attributed to the existence of superconducting regions, but are clearly a consequence of quantum oscillations. The magnetoresistance shows curvature at higher temperatures, but becomes increasingly linear as the temperature decreases.
In Fig.5, we show the 5K MR of a ZYA sample to 7T. The linear field dependence is clear. The dashed line shows the data with the zero-field resistance subtracted. To the lowest fields measured, the data are not clearly quadratic in field
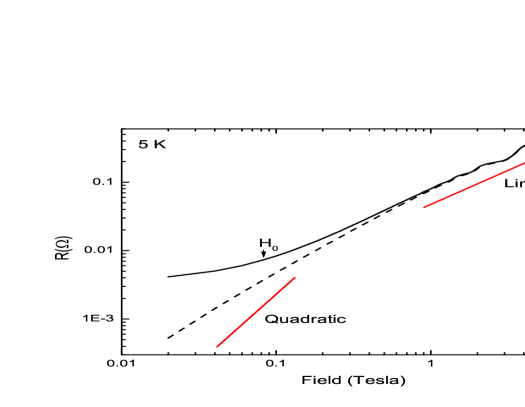
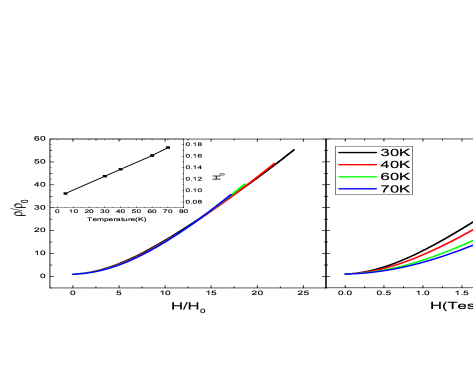
As noted above, Parish and Littlewoodparrish predict that the crossover from quadratic to linear field dependence occurs at when the variation of the mobility among crystallites is small. At the same time, the MR itself is proposed to scale with . We test this prediction in Fig.6, at temperatures where the MR oscillations are less evident. is chosen for each curve at the point where it deviates from linearity by a set percentage. Note that the crossover field increases with temperature, reflecting the decrease in mobility as expected for phonon scattering in each graphite crystallite. The cross-over field extrapolates to at low temperatures.
We turn now to the low temperature magnetoresistance oscillations. Early work by Williamson et al.dresselhaus on the de Haas-van Alphen oscillations of pyrotylic and single crystal graphite showed their Fermi surface in detail. The majority electron and hole carriers were found in approximately ellipsoidal pockets along HKH in the Brillouin zone. There are six such ellipsoids with one third of their volume within the unit cell. Previous work on Shubnikov-de Haas oscillations in graphite shows that the majority electron ellipsoids dominate in the resistivity.igor
Despite wide variations in temperature dependence of various samples, the MR is surprisingly similar. The main panel of Fig.7 shows the numerical derivative of the data in Fig.5 plotted vs the inverse field. This method of separating the oscillatory behavior from the linear MR was reported by Arnt, et al.amdt The periodicity in 1/ identifies these as Shubnikov-de Haas oscillations within each graphite crystallite. The inset of Fig.7 shows similar curves for both doped and undoped samples whose zero field resistance can vary by a factor of two. We note that the samples have the same thickness and contact spacing, so that the data actually reflects nearly identical magnetoresisistivity, including MR oscillations.
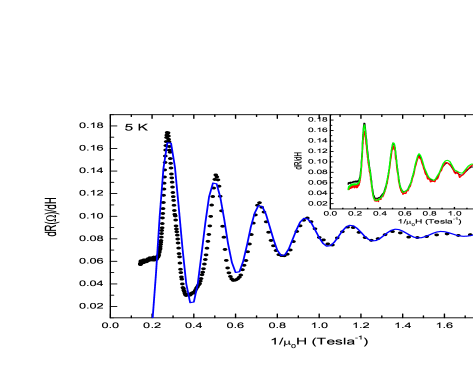
Fitting the curves in Fig.7 to a version of the SdH oscillations with a constant relaxation timeando ,
| (1) |
yields the linear MR coefficient , oscillation amplitude , damping factor ; period and phase factor . The standard expressionsando ; tan for Shubnikov-de Haas oscillations give
| (2) |
where is the cross sectional area of the Fermi surface. We obtain , which leads us to a 2D carrier density of
| (3) |
The Fermi surface for holes can be seen weakly in de Haas-van Alphen oscillations but not SdH.dresselhaus
Studies of microcrystalline graphiteamdt find m-1 with a 2D carrier density m-2. That value agrees with our result to within a factor of 2. We note that each Landau Level contains a 2D density of states of m-2, where is the flux quantum. At the first peak in Fig.7, where 4 T, only the first and second Landau levels are filled, each with m-2. As the field is increased through 4 T, the second Landau level begins to empty and there are no further oscillations.
Treating the majority electron pocket as an ellipsoid of radius with a height that of the Brillouin zone, we arrive at a 3D carrier density of m-3. This is in reasonable agreement with the value given by band theory of m-3.dresselhaus
The damping factor provides a direct measure of the carrier mobility through or cm2/Vs. This corresponds to a mean-free path m, indicating that the crystallites contributing to the S-dH oscillations and the large linear MR are substantially defect free. Expressed in field terms, the mobility is 1.2 T-1. It is also important to remember that this mobility is an average over individual crystallites, and not that of the bulk. If, as predicted, the cross over between quadratic and linear MR regions is inversely proportional to , we would expect 0.8 T. In fact, the scaling fields in Fig.6 extrapolate to a low-temperature value of 0.08 T. In the Parish-Littlewood model, the crossover can be dominated by the spread in mobility, but this would require that 12 T-1, which does not seem reasonable. Perhaps further refinement of that model will provide the needed proportionality factor .
In conclusion, while there is a significant variability in the temperature dependence of the resistance of samples without an applied field, even between portions taken from the same sample, and particularly for ion-implanted samples, the large non-saturating magnetoresistance is consistent throughout. This MR is characteristic of the Parrish-Littlewood model where the currents flow in a nonhomogeneous system of graphite crystallite disks perpendicular to the electric field in the presence of an applied magnetic field as shown in Fig.1. The numerical simulation in the model predicts that when the cross over is dominated by the mobility From Eq. (1) and Fig 5 we have T and m which predicts at 7 T, which compares well with the data in Fig.5 We note that saturation is not predicted to occur in this model until ; our value at 7 T is only The SdH oscillations are in agreement with previous results for the majority-electron Fermi surface and give a majority electron density consistent with band theory. The fact that only the majority electrons contribute to the SdH oscillations, allows us to calculate the mean free path, showing the crystallites comprising the HOPG sample to be relatively defect free. It means that the ion-implanted region that has many defects due to the impact of ions does not contribute to the SdH oscillations, implying that the current distribution does spread far below the ion-implanted surface region so that the average mobility is not significantly changed by ion-implantation. No evidence of ion-implantation induced superconductivity has been detected for the ion energies and does used.
References
- (1) Neutron Diffraction, edited by H. Dachs, Springer-Verlag, Berlin, 1978, p. 26
- (2) A. M. Baró et al., Nature 315, 253 (1985)
- (3) Y. Kopelevich, P. Esquinazi, J. H. S. Torres, and S. Moehlecke, J. Low Temp. Phys. 119, 691 (2000).
- (4) Y. Kopelevich, V.V. Lemanov, S. Moehlecke, and J.H.S. Torres, Physics of the Solid State 41, 1959 (1999).
- (5) A. Arndt, et al. Phys. Rev,B 80, 195402 (2009)
- (6) H. Kempa, Y. Kopelevich1, F. Mrowka, A. Setzer, J.H.S. Torres1, R. Höhne, and P. Esquinazi, Solid State Commun. 115, 539 (2000)
- (7) Y. Kopelevich, J. H. S. Torres, R. R. da Silva, F. Mrowka, H. Kempa, and P. Esquinazi, Phys. Rev. Lett. 90, 156402 (2003).
- (8) A. Hussmann, J. B. Betts, G. S. Boebinger, A. Migliori, T. F. Rosenbaum and M.-L. Saboungi, Nature 417, 421 (2002).
- (9) M. M. Parish and P. B. Littlewood, Phys. Rev. B72, 094417 (2005).
- (10) S. J. Williamson, S. Foner, and M. S. Dresselhaus, Phys. Rev. 140, 4A (1965).
- (11) Igor A. Luk’yanchuk, Y. Kopelevich, Phys. Rev. 93, 166402 (2004)
- (12) T. Ando, J. Phys. Soc. Jpn 37, 1233 (1974).
- (13) Z. Tan, C. Tan, L. Ma, G. T. Liu, L. Lu and C. L. Yang, Phys Rev. B 84, 115429 (2011).
- (14) Yuanbo Zhang, Yan-Wen Tan, Horst L. Stormer, and Philip Kim, Nature 438, 201-204 (2005).