Toward a Comprehensive Model of
Snow Crystal Growth Dynamics:
2. Structure Dependent Attachment Kinetics near -5 C
Kenneth G. Libbrecht
Department of Physics, California Institute of Technology
Pasadena, California 91125
Abstract. We present experimental data demonstrating the presence of structure-dependent attachment kinetics (SDAK) in ice crystal growth from water vapor near -5 C. Specifically, we find that the nucleation barrier on the basal edge of a thin-walled hollow columnar crystal is approximately ten times smaller than the corresponding nucleation barrier on a large basal facet. These observations support the hypothesis that SDAK effects play an important role in determining the growth morphologies of atmospheric ice crystals as a function of temperature.
1 Introduction
In [1, 2] we described a crystal growth instability that enhances the development of thin edges, thereby promoting the formation of plate-like or hollow columnar crystal morphologies. This instability arises when diffusion-limited growth is coupled with structure-dependent attachment kinetics (SDAK), specifically when the nucleation barrier on a facet surface decreases substantially as the facet width approaches atomic dimensions. In [1] we also presented experimental data confirming the presence of the SDAK instability in the growth of ice crystals from water vapor near -15 C. The data in [1] indicate that the SDAK instability plays a key role in the formation of thin plate-like crystals at -15 C, which is a well-known feature in the snow crystal morphology diagram [3].
In [4] we further presented a new and comprehensive physical model that begins to explain the overall structure of the morphology diagram, in particular the observed changes in growth morphology as a function of temperature. The SDAK instability plays a central role in this model, in that it connects the intrinsic growth rates of faceted surfaces to the observed morphological changes with temperature. This model makes a strong prediction that SDAK effects should be observable at temperatures near -5 C, in much the same way that they were observed near -15 C in [1].
In the present paper we describe an investigation of ice growth at a temperature of -5.15 C, which is at the needle peak in the morphology diagram [5]. We find clear evidence for SDAK effects on the basal facets, suggesting that the SDAK instability is largely responsible for the formation of thin-walled hollow columnar crystals near this temperature. These results support the model in [4], and strongly support the hypothesis that SDAK effects play an important role in determining the growth morphologies of atmospheric ice crystals.
2 Intrinsic Growth Rates at -5.15 C
Following [4], we define the intrinsic growth rates of the basal and prism surfaces as the growth rates of infinite, clean, dislocation-free, faceted ice surfaces in near equilibrium with pure water vapor at a fixed temperature. We parameterize the surface growth velocities using where is the perpendicular growth velocity, is a temperature-dependent “kinetic” velocity derived from statistical mechanics, and is the water vapor supersaturation relative to ice at the growing surface. The intrinsic attachment coefficient is parameterized using , and measurements of the parameters and for the basal and prism facets are given in [6], yielding and at C.
Note that the on both facets are determined by the detailed molecular dynamics occurring at the ice surface, describing the various physical processes by which water vapor molecules become incorporated into the crystalline lattice. The functional form above is appropriate when the attachment kinetics are limited mainly by the nucleation of molecular layers on the faceted surfaces, and the nucleation parameter derives from the step energy associated with these molecular layers [3, 6]. The fact that the growth measurements in [6] are so well described by a nucleation-limited model suggests the absence of significant dislocations on our test crystals, and that the measurements in [6] therefore provide a good estimation of the intrinsic growth rates of the principal facets of ice.
One question that arose during our investigation was whether the intrinsic growth rates depended on atmospheric pressure, particularly for the basal facet. In other words, is on a basal surface affected by the addition of clean air at a pressure of one bar? Since air is chemically quite inert, we expect that its presence should have little affect on the molecular dynamics affecting the attachment kinetics. Therefore we expect that the measured and should be unaffected by the presence of the surrounding air. Nevertheless, we felt that this expectation should be tested experimentally.
Figure 1 shows measurements of for the basal facet at -5.15 C, following the notation in [7], using the apparatus described in [8]. Extracting from is complicated by the fact that the observed crystal growth is limited by both the attachment kinetics and by diffusion effects through the surrounding gas. At low pressures the diffusion effects are relatively small, and can be removed from the data as described in [7, 6]. These data analysis techniques are not adequate at pressures near one bar, however, so we used an approximate diffusion modeling approach to compare with our data.
The dotted line in Figure 1 shows with which is the result from [6]. This line represents the true intrinsic growth rate of the basal facet at this temperature (within experimental error). Put another way, taking assumes no residual diffusion effects, which is accurate in the limit of zero background pressure.
The nearby solid line in Figure 1 shows
| (1) |
which contains two diffusion correction factors. The term corrects for the main diffusion effects, as described in [7, 3]. For basal growth data as in Figure 1, the factor accounts for the fact that faster growth of the nearby prism facets pulls down the supersaturation surrounding the crystal, thus impeding the growth of the basal facets [7]. In Figure 1 we used and and these additional factors shift the dotted line to better match the measured Because these correction factors are quite small with a background pressure of 0.03 bar, the model for (solid line) is fairly close to the intrinsic
The lower solid line in Figure 1 shows the same functional form as in Equation 1, but this time with values and Using the known crystal sizes and growth velocities to estimate the diffusion effects [7, 3] indicates that these fit values were reasonable for this experiment. Since the same was used in the model, this implies that for the high-pressure data is indeed consistent with the measured at lower pressure. Additional analysis, including computer modeling of the crystal growth, allows us to place a limit of percent from the high-pressure data in Figure 1.
Our overall conclusion from these data is that a background pressure of air up to one bar seems to have little effect on the intrinsic basal A single can be used to adequately model the measurements taken at low and high pressures, as shown graphically in Figure 1. This experimental conclusion agrees with our initial expectation that an inert background should not change appreciably. Nevertheless, we cannot completely rule out any pressure dependence in since the diffusion effects present in the data are very difficult to remove precisely. In addition, we cannot entirely rule out residual chemical effects from impurities in the background gas, although a separate investigation suggests that the impurity levels in our experiments were too low to significantly affect the growth measurements [9].
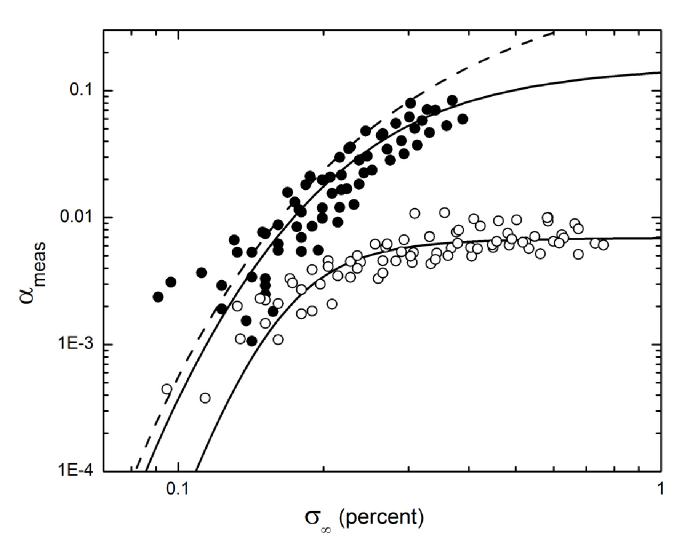
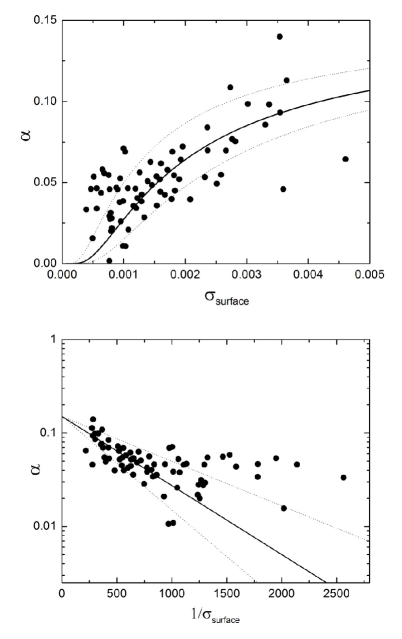
Figure 2 shows measurements of for the prism facet from [6], along with curves showing How these data compare with measurements at other temperatures is shown in [6]. Additional measurements at pressures near one bar (not shown) are also consistent with our expectation that is not substantially changed by air background pressures up to one bar, again with the caveat that we cannot positively exclude that there may be some pressure dependence in
From a combination of these and other supporting measurements from this experiment [6], we therefore assume intrinsic growth rates described by and for the remainder of this investigation, and we assume that these parameters are independent of background air pressure.
3 SDAK Effects at -5.15 C
To explore SDAK effects in growing ice crystals near -5 C, we again grew small ice crystals on a sapphire substrate using the apparatus described in [8], in air at a background pressure of one bar. Each run began with an isolated, simple hexagonal prism crystal on the substrate, with one prism facet resting on the substrate. Once the system was stable, the supersaturation was increased and the subsequent growth was monitored, using both direct imaging and laser interferometry [6, 8].
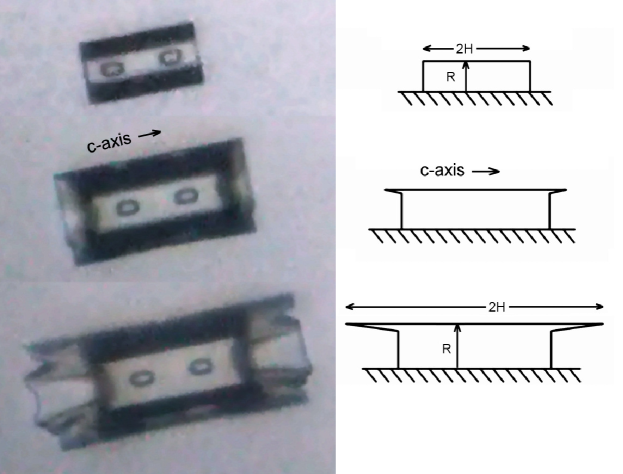
An example crystal from these measurements is shown in Figure 3. This crystal was initially grown at low supersaturation, and during this phase the morphology remained that of a simple faceted prism. As the base grew and filled in, the overall morphology became approximately that of half a hexagonal prism crystal. The supersaturation was slowly increased with time in this example, and above percent the growth of the flat basal facets became unstable to basal hollowing. The basal hollowing became quite pronounced as the supersaturation was increased, yielding a thin-walled growth morphology, as seen in the lower image in Figure 3. To a reasonable approximation, the overall morphology was essentially that of half a hollow column crystal, in this case with quite thin columnar walls. The exact thickness of these walls, along with other morphological details, could not be determined in this experiment.
As with the experiments described in [1], the initial sizes of our test crystals were not constant, plus substrate interactions [7] varied somewhat from crystal to crystal. While the qualitative growth behavior was quite similar for all crystals examined at a given the quantitative details depended on the initial conditions in the experiment, which were different for each individual crystal. For this reason, as in [1], we found it most useful to measure and model the growth of individual example crystals, rather than measuring numerous crystals and forming averages. As described below, our overall results did not depend on the specific crystals analyzed.
To model our growth measurements, we used the 2D cylindrically symmetric cellular automata technique described in [10], again following the procedures described in [1]. For each numerical model we input the initial crystal size the attachment coefficients and and a constant supersaturation far from the crystal The cellular automata technique then solved the diffusion equation around the crystal and numerically “grew” the crystal, thus yielding the crystal size and morphology as a function of time.
Figures 4 and 5 show measurements of a single test crystal grown at percent, where this value was determined from experimental parameters [8]. The morphology of this crystal remained essentially that of half a simple hexagonal prism during the course of the experiment, similar to that shown in the top image shown in Figure 3. As the dimensions of the crystal increased with time, we measured the effective prism radius and half-height as defined in Figure 3. The the radius was measured using two methods – from direct imaging of the half-width of the crystal, and by using laser interferometry to measure changes in the distance between the substrate and the top prism facet. From the latter measurements of we used the initial from direct imaging and integrated to produce an from the interferometer data. As seen in the figures, the two measurements of gave similar results. Since substrate interactions reduced the nucleation barrier on the side prism facets somewhat [7], we typically found that measured from direct imaging was slightly larger than measured interferometrically.
Since the prism facets were large and flat on this crystal, in our models we set to be that determined from the intrinsic growth measurements described above, and we neglected any substrate interactions for the prism facets in our modeling. The basal facets were also observed to be quite flat in these crystals, so we would expect to be close to the intrinsic value. However, the basal facets also intersected the substrate, and it is certainly possible that substrate interactions reduced the nucleation barrier on the basal facets, via the mechanism described in [7]. Indeed, since we expect that substrate interactions on the basal facet would perturb the basal growth more than we observed on the prism facets.
In addition, we also know that the facets of a growing crystal are somewhat convex, owing to diffusion effects. Because of this, the SDAK effect on the nonflat basal facets could result in a smaller compared to the intrinsic value. This possibility, along with possible substrate interactions, means that could easily be smaller than the intrinsic value. For this reason we kept as a model variable in our calculations.
Figure 4 shows three models in which we fixed and varied centered about our best-fit model. Not surprisingly, higher values yielded faster growth rates for both facets. Our best-fit model had percent, lower than the = 1.0 percent set in the experiment. We have come to understand this rough factor of two from previous experiments [1]. Most of the factor comes from the model itself, as various effects tend to produce faster growth than seen experimentally. (For example, one reason is that the outer boundaries of the model are fairly close to the crystal, yielding faster growth rates than if the outer boundaries were as far away as in the experiments.) To account for this systematic modeling effect, along with uncertainties in the experimental we adjusted the model to fit the data, thus yielding the best fit value percent.
Figure 5 shows models in which we fixed and varied again centered about our best-fit model. In this figure we see that reducing the nucleation barrier on the basal facet increased the basal growth, as expected. The increased basal growth then robbed water vapor from the neighboring prism facets, reducing their growth, also as we would expect. By adjusting both and we produced our best-fit model with percent and percent.
Our overall conclusion with this crystal is that it is reasonably well fit using the intrinsic growth rates, with some caveats. The model is about a factor of two lower than we set in our experiment, and we understand this factor as arising from modeling systematics along with possible experimental systematics, as we described in [1]. In addition, our fit was about a factor of two lower than the intrinsic value. This reduced nucleation barrier most likely resulted from substrate interactions with the basal facet [7], which we could not control in this experiment. Thus while our experimental and modeling systematics are not negligible, the growth of this crystal is generally consistent with expectations based on the measured intrinsic facet growth rates, for both the prism and basal facets. In particular, no SDAK effects, or perhaps only small SDAK effects, are needed to explain the growth of this low- crystal.
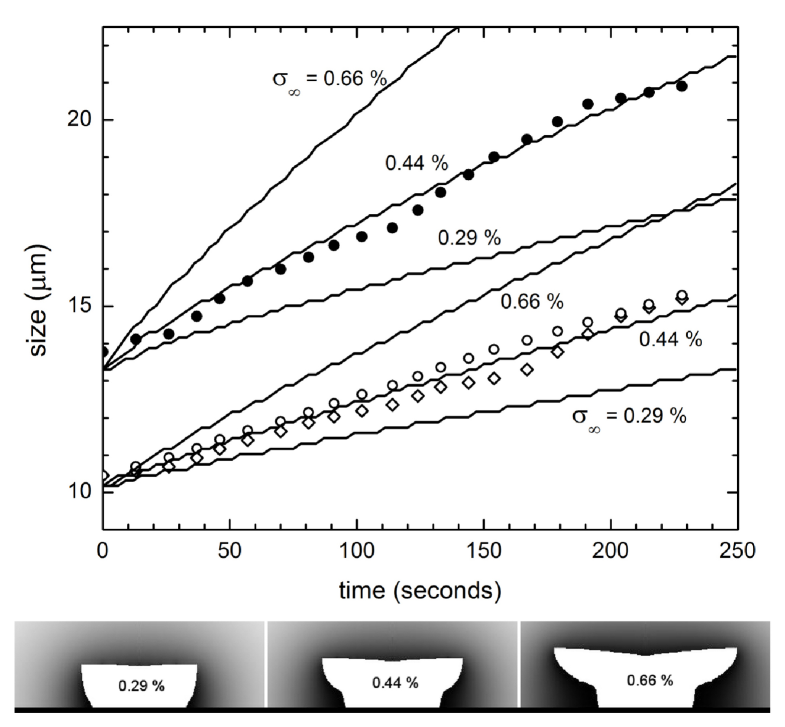
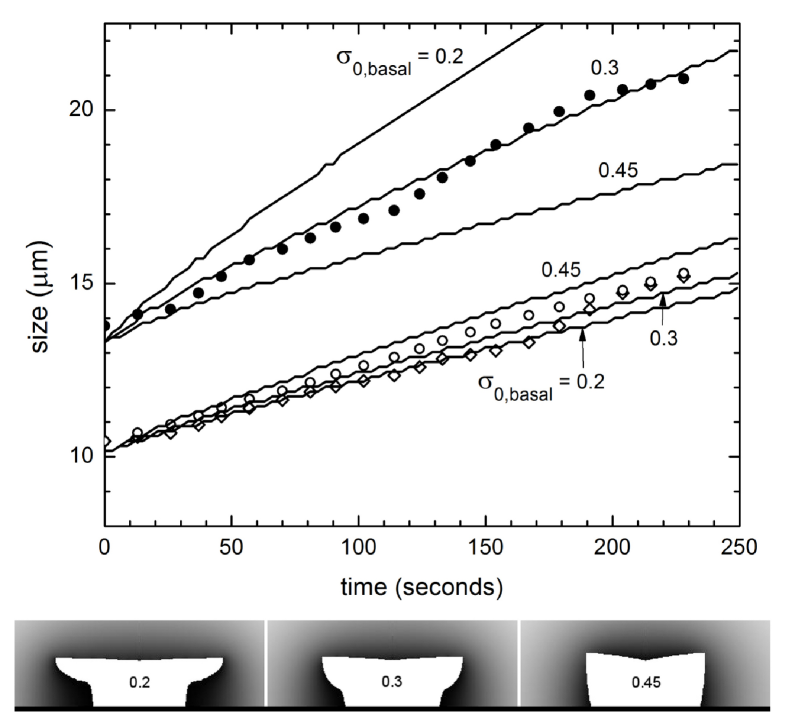
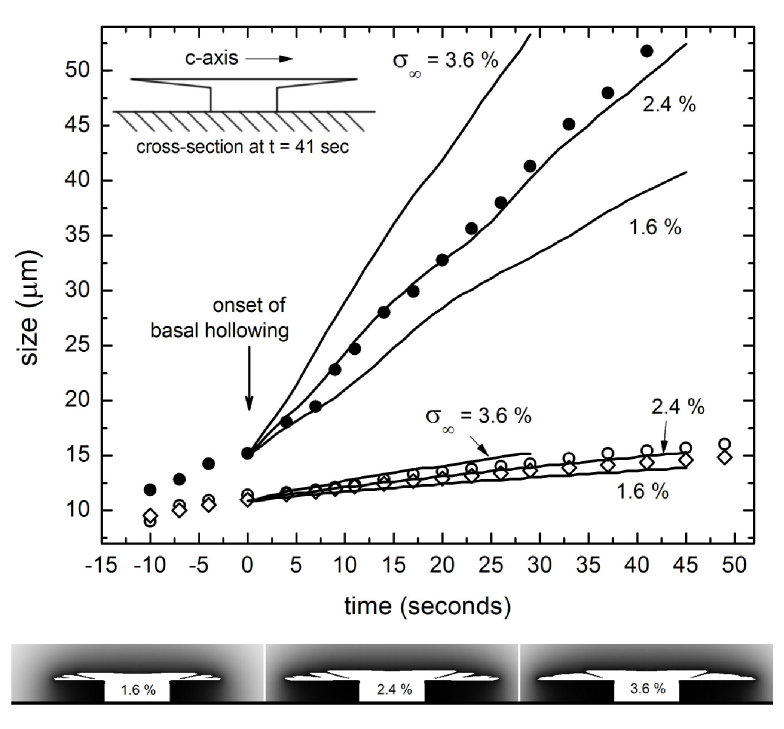
Figures 6 and 7 show data and models for a crystal grown at an experimentally set percent, high enough to produce strong hollowing of the basal facets at this temperature. In this case the crystal morphology was similar to that seen in the final stages of growth in Figure 3, showing deep basal hollowing with a thin-walled hollow columnar morphology. Although complex in its fine details, the morphology was essentially that of half a hollow column, so to an adequate approximation we were able to numerically model the crystal using our 2D cylindrically symmetrical cellular automata code. As before, we set to the intrinsic value, and adjusted and to fit the data.
Figure 6 shows three models in which we fixed and varied centered about our best-fit model. Since it took some time for the supersaturation to stabilize in the experiment, we began the models when the basal hollowing was first observed in this crystal, shown as in the figures. In the models, the supersaturation field was allowed to fully relax before commencing crystal growth, and in all cases basal hollowing appeared very quickly. In Figure 6 we again see that higher values yielded faster growth rates for both facets, as expected. And our best-fit percent was lower than the = 3.9 percent set in the experiment, as expected.
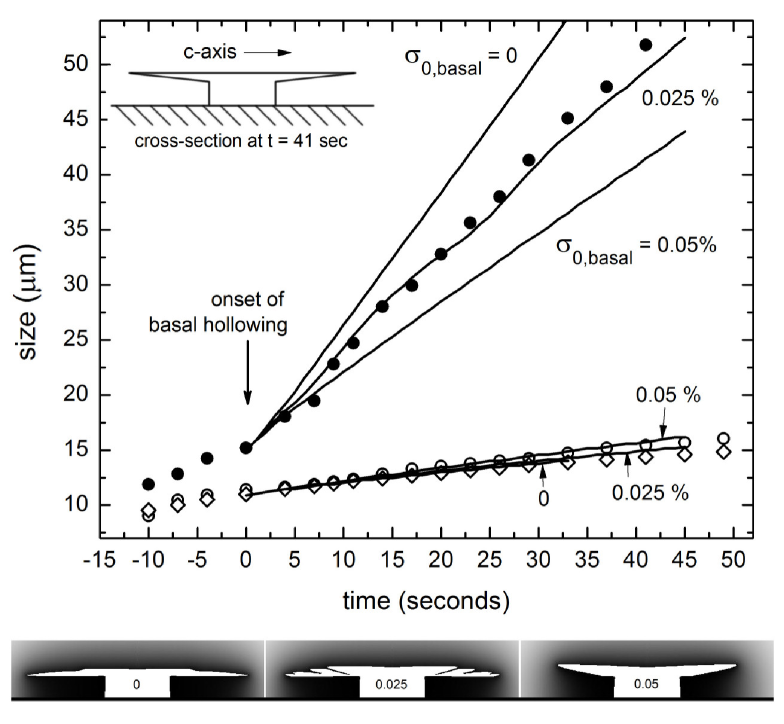
Figure 7 shows the same crystal data along with three models in which we fixed and varied again centered about our best-fit model. And, as with the previous crystal, we see that reducing the nucleation barrier on the basal facet increased the basal growth while slightly reducing the prism growth rate. By adjusting both and we produced our best-fit model with percent and percent. Note also that a morphological transition appeared in the models as we changed With the prism facets showed convex shapes, while at percent the prism facets were concave. Although this transition may become altered with full 3D modeling, we suggest that it may be a robust feature in diffusion-limited faceted crystal growth.
Our overall conclusions from this high- crystal are quite different from the previous low- crystal. For the high- data shown in Figures 6 and 7, the crystal growth rates and morphology cannot be adequately modeled using the intrinsic attachment coefficients. In particular, modeling the high- behavior required percent, over a factor of 10 smaller than the low- crystal, and approximately a factor of 30 smaller than the intrinsic This discrepancy is simply too large to be the result of systematic effects in the experiment or the modeling, so some other physical mechanism is necessary to explain the observations.
The SDAK instability described in [4] provides a natural explanation for both the low- and high- data presented here. At low the facets are large and flat, so the intrinsic and can adequately describe the growth behavior. At high however, the SDAK instability on the basal facets produces a thin edge with a much reduced nucleation barrier, thus resulting in a thin-walled hollow columnar morphology. Including the SDAK effect allows us to qualitatively explain the morphologies and quantitatively fit the measured growth rates.
4 Conclusions
In summary, we have examined the growth of ice crystals from water vapor at a temperature of -5.15 C, in an atmosphere of air at one bar. Although detailed data from only two test crystals are presented above, observations of additional crystals indicated that our overall conclusions are robust from sample to sample. Strong basal hollowing was seen in all high- samples, while all low- grew as simple prisms. In addition, while complicating effects arising from substrate interactions, modeling systematics, crystal-to-crystal variations, uncertainties in determining the supersaturation accurately, etc., were not negligible, we believe that these effects do not substantially affect our overall conclusions.
Our main conclusion is that our observations are consistent with the model presented in [4]. Our assumptions include: 1) the intrinsic are given by the measurements presented in [6], 2) the are not substantially altered by a background air pressure of one bar, and 3) the numerical modeling method described in [10] is adequate. Given these assumptions, the measurements presented above then strongly support our hypothesis that SDAK effects are present on the basal facet at -5.15 C.
We believe that the comprehensive model of ice crystal growth presented in [4] is at least on the right track. After conceiving it, the model immediately made a clear prediction that SDAK effects should be present on the basal facet near -5 C. When we subsequently performed the above experiments to look for these effects, they were clearly present, essentially just as model predicted. Our numerical modeling of the data indicates that the rapid basal growth associated with basal hollowing is consistent with an SDAK instability, and this behavior is difficult to explain otherwise.
Additional precision ice crystal growth measurements at other temperatures, together with additional modeling, should further elucidate the underlying molecular dynamics governing ice growth behavior. From this we hope to better understand the ice surface structure and dynamics, and how these change with temperature and other factors on the principal facets. And by using ice as a case study, we hope to gain additional insights into the many-body surface physics that governs crystal growth more generally.
References
- [1] Libbrecht, K. G., “An edge-enhancing crystal growth instability caused by structure-dependent attachment kinetics,” arXiv:1209.4932 (2012).
- [2] Libbrecht, K. G., “Explaining the formation of thin ice crystal plates with structure-dependent attachment kinetics,” J. Cryst. Growth 258, 168-175 (2003).
- [3] Libbrecht, K. G., “The physics of snow crystals,” Rep. Prog. Phys., 68, 855-895 (2005).
- [4] Libbrecht, K. G., “Toward a comprehensive model of snow crystal growth dynamics: 1. Overarching features and physical origins,” arXiv:1211.5555 (2011).
- [5] Libbrecht, K. G., and Arnold, H. M., “Measurements of ice crystal growth rates in air at -5C and -10C,” arXiv:0912.2518 (2009).
- [6] Libbrecht, K. G., and Rickerby, M. E., “Crystal growth in the presence of surface melting: Novel behavior of the principal facets of ice,” arXiv:1208.5982 (2012).
- [7] Libbrecht, K. G., “Managing systematic errors in ice crystal growth experiments,” arXiv:1208.5064 (2012).
- [8] Libbrecht, K. G., “An improved apparatus for measuring the growth of ice crystals from water vapor,” arXiv:1109.1511 (2011).
- [9] Libbrecht, K. G., and Bell, R., “Chemical influences on ice crystal growth from vapor,” arXiv:1101.0127 (2011).
- [10] Libbrecht, K. G., “Physically derived rules for simulating faceted crystal growth using cellular automata,” arXiv:0807.2616 (2008).