Proper motions and membership probabilities of stars in the region of open cluster NGC 3766.††thanks: Based on observations with the MPG/ESO 2.2m, located at La Silla and Paranal Observatory, Chile, under DDT programs 164.O-0561(E) and 077.C-0188(B).
Abstract
Relative proper motions and cluster membership probabilities () have been derived for 2500 stars in the field of the open star cluster NGC 3766. The cluster has been observed in and broadband filters at two epochs separated by 6 years using a wide-field imager mounted on the WFI@ESO2.2m telescope. All CCD frames were reduced using the astrometric techniques described in Anderson et al. (2006). The proper motion r.m.s. error for stars brighter than mag is 2.0 mas yr-1 but it gradually increases up to 4 mas yr-1 at mag. Using proper motion data, membership probabilities have been derived for the stars in the region of the cluster. They indicate that three Be and one Ap stars are member of the cluster. The reddening mag, a distance 2.50.5 kpc and an age of 20 Myr are derived using stars of . Mass function slope is derived for the cluster and cluster was found to be dynamically relaxed. Finally, we provide positions, calibrated and magnitudes, relative proper motions and membership probabilities for the stars in the field of NGC 3766. We have produced a catalog that is electronically available to the astronomical community.
keywords:
Galaxy: Open cluster: individual: NGC 3766 - astrometry - catalogs1 Introduction
The similar age of the stars in open clusters make them vital objects for the study of stellar evolution. However, for such studies, it is essential to separate the field stars from the cluster members. Proper motions (PMs) of the stars in the region of open clusters provide a unique possibility of getting membership information of the stars. Proper motions in combination with radial velocities also provide valuable information on the kinematic parameters of the Galactic rotation curve and the distance to the Galactic center. They are also useful to study the formation and evolution of the open cluster system.
The open cluster NGC 3766 (; ; ; ) is located in the Carina complex of the Milky Way. The cluster has been the target of many photometric studies (Ahmed (1962); Yilmaz (1976); Shobbrook (1985), (1987); Moitinho et al. (1997); Tadross (2001); McSwain & Gies (2005)) with the aim to determine the various physical parameters of the cluster. The most remarkable attribute of NGC 3766 is the presence of largest number of Be stars yet known in any Galactic cluster. Among the 37 brightest stars, 12 show emission lines (Sher (1965); Schild (1970); Lloyd Evans (1980)). Fundamental parameters of B stars in NGC 3766 was studied by Aidelman et al. (2012) using spectroscopic data.
A proper motion study of NGC 3766 was made by Baumgardt et al. (2000) using eight stars taken from Hipparcos catalogue and derived the mean absolute proper motion mas yr-1 and mas yr-1.
In spite of extensive photometric studies of this cluster, there is a lack of study providing proper motions and membership probabilities () of the stars in the wide-field region of open cluster NGC 3766. With the photometric data, membership information is desirable to minimize field star contamination. The archival wide-field multi-epoch CCD observations taken with the WFI@2.2m telescope provide an opportunity to derive precise PMs with a time-span of only a few years, and is deeper by several magnitudes than previous photographic surveys (Anderson et al. 2006; Yadav et al. 2008; Bellini et al. 2009; Sariya, Yadav & Bellini 2012).
The main purpose of the present study is to estimate the fundamental parameters of the cluster using stars chosen according to their derived membership probabilities (). The of different sources in NGC 3766 is also discussed. We also derived luminosity function (LF), mass function (MF) and mass segregation of the cluster using stars of 70%. The PMs, and photometric and magnitudes are provided to the astronomical community for the follow-up studies.
Observational data alongwith reduction procedures and determination of proper motions are described in the next Section. Colour-magnitude diagrams using proper motions are described in Sec. 3. In Sect. 4 we present cluster membership analysis. Sect. 5 is devoted to derivation of fundamental parameters of the cluster. Luminosity and mass function are described in Sec. 6 while Sec. 7 is devoted to the mass segregation study. In Sect. 8 we describe our catalogue and finally, in Sect. 9 we present the conclusions of present study.
2 Observational data and reductions
CCD data for NGC 3766 were collected with the wide-field imager camera (WFI) mounted on 2.2m ESO/MPI telescope at La Silla Chile. Using these archival data111http://archive.eso.org/eso/eso_archive_main.html. of two epochs, proper motions were computed. The first epoch consists of four images in filter and three images in filter taken on 27th Feb 2000, while second epoch have four images in filter taken on 9th April 2006. The observational log is listed in Table 1.
The WFI@2.2m consists of eight 20484096 EEV CCDs with pixel-1 resulting in a total field-of-view 34. Images used in the analysis were taken between seeing condition and between 1.25-1.35 airmass. Long and short exposures were acquired to map the brighter as well as fainter stars of the cluster.
| Filters | Exposure Time | Seeing | Airmass | Limiting Mag. |
| (in seconds) | ||||
| (First epoch) | ||||
| 230; 2240 | 1′′.5 | 1.25 | 21 | |
| 130; 2240 | 1′′.5 | 1.33 | 20 | |
| (Second epoch) | ||||
| 450 | 1′′.2 | 1.35 | 20 | |
2.1 Astromeric and Photometric Reductions
For the reduction of mosaic CCD images, we adopted the procedure described in Anderson et al. (2006, Paper I). The procedure include de-biasing, flat-fielding and correction for cosmic rays. To get the position and flux of the stars in the image, we made an array of empirical Point Spread Functions (PSFs) for each image. An array of 15 PSFs in each 20484096 pixels chip (3 across and 5 high) as shown in Fig. 3 of paper I was considered because PSFs changes significantly with position on the detector. In total, 120 PSFs have been considered for entire field of view (81928192 pixels). These PSFs are saved in a look-up table on a very fine grid. To select suitable stars for the PSFs, an automatic code was developed (see Paper I). An iterative process is designed to work from the brightest down to the faintest stars and find their precise position and instrumental flux for and exposures.

In paper I, it is shown that WFI@2.2m has a large geometric distortion, i.e. pixel scale is changing across the field of view (see Paper I). To derive the correction for geometric distortion,we parametrized the distortion solution by a look-up table of corrections for each chip that covered each 20484096 pixel chip, sampling every 256 pixels. This resulted in a 917 element array of corrections for each chip. At any given location on the detector, a bi-linear interpolation between the four closest grid points of the look-up table provided the corrections for the target point. The derived look-up table may have a lower accuracy on the edges of a field because of the way the self-calibration frames were dithered (see Paper I). An additional source of uncertainty is related to a possible instability of distortions for the m reported earlier. This prompted us to use the local-transformation method to derive PMs. Detailed descriptions about the distortion solution is given in Paper I.
In the local transformation approach a small set of local reference stars is selected around each target object. It is advantageous to use pre-selected cluster members to form a local reference frame because of a much lower intrinsic velocity dispersion among the cluster members. Then, six-parameter linear transformations are used to transform the coordinates from one frame into another, taken at different epochs.
A general linear transformation from one frame into another
has 6 parameters, and can be put into the following form:
The parameters and are the linear terms, and , , and are the constant terms. The equation look like there are 8 free parameters in the equations, but we can choose the zero-point in one frame arbitrarily, so only one of the two offsets is actually solved for. The easiest way to solve for the offsets is to adopt the centroid of the star list in the first frame as the offset for that frame, . Then, the centroid in the other frame will be the least-squares solution for the other offset, (.
The residuals of this transformation are characterizing relative PMs convolved with measurement errors. In essence, this is a classical “plate pair” method but extended to all possible combinations of the first and second epoch frames. Relative PM of a target object is the average of all displacement measurements in its local reference frame. The last step is to estimate the measurement errors from intra-epoch observations where PMs have a zero contribution. A complete description of all steps leading to PMs is given in Paper I.
2.1.1 Photometric Calibration
In order to transform instrumental and magnitudes into the standard Johnson-Cousin system, we used the data published by Moitinho et al. (1997). Total 92 stars were used to calibrate and magnitudes.
We derived photometric zero-points and colour terms using the
following transformation equations:
where the subscript “ins” means instrumental magnitudes and “std” stands for secondary standard magnitudes. and are the colour terms while and are the global zero-points. The quadratic colour terms are negligible. The values of colour terms are 0.29 and 0.16, while the zero-points are 24.39 and 23.79 for and filters respectively.

In Fig. 1 we show the rms of the residuals around the mean magnitude for each filter as a function of the magnitude. The photometric standard deviations have been computed from multiple observations, all reduced to the common photometric reference frame in the chosen bandpass. The stars brighter than 12.0 mag in have higher dispersion because of saturation. On average, photometric rms are better than 0.02 mag for stars between 12-18 mag and 0.04 mag between 18-20 mag in filter.
2.1.2 Astrometric Calibration
The raw coordinates of each star in each frame were corrected for geometric distortion using the look-up table provided in Paper I, brought into a common reference frames by means of six-parameter linear transformations, and averaged. To transform the averaged and coordinate into RA and Dec of J2000, we used the online digitized sky ESO catalogue in skycat software, as an absolute astrometric reference frame. Thanks to our accurate geometric-distortion solution and a reasonable stability of the intra-chip positions, that it was possible to apply a single plate model involving linear and quadratic terms and a small but significant cubic term in each coordinate. This solution also absorbs effects caused by differential refraction. The standard error of equatorial solution is 30 mas in each coordinate.
2.2 Determination of proper motions
Proper motions were computed using -filter images to minimize colour-dependent terms in our analysis. Moreover, our geometric-distortion solution provides the smallest residuals with images (Paper I). A total of three images for first epoch and four images for the second epoch were used in proper motion determination.
First, we selected a sample of probable cluster members using the vs. CMD. Selected stars are located on the main-sequence in the magnitude range 8.0 mag. These stars define a local reference frame to transform the positions of a given first-epoch image into positions of a second-epoch image. By adopting only stars on cluster sequence having proper motion errors 3.0 mas yr-1, we assure that PMs are measured relative to the bulk motion of the cluster. To minimize the effect of uncorrected distortion residuals we used the local transformation approach based on the closest 25 reference stars on the same CCD chip. No systematics larger than random errors are visible close to the corners or edges of chips.
We iteratively removed some stars from the preliminary photometric member list that had proper motions clearly inconsistent with cluster membership, even though their colours placed them near the fiducial cluster sequence. The distribution of proper motions rms error is presented in Fig. 2. The precision of the proper motion measurement is better than 3 mas yr-1 upto 14 mag in . They are gradually increasing upto 4 mas yr-1 for mag.

2.2.1 Comparison with UCAC3 proper motion data
UCAC3 catalogue (Zacharias et al. (2010)) provides the absolute proper motions of the stars in the region of NGC 3766. There are 94 common stars found to be brighter than mag. To compare our proper motions with UCAC3, we changed the UCAC3 proper motions to relative proper motions. For this, we subtracted the mean absolute proper motion of the cluster ( mas yr-1, mas yr-1) from individual proper motion of stars. Fig. 3 shows the comparison of our PMs with those of the UCAC3 catalogue. Top-left panel shows the vector-point diagrams (VPDs) of UCAC3 stars while top-right panel shows the VPD of our measurements. A concentration of stars around (0, 0) mas yr-1 is seen in both VPDs. Our proper motions distribution is tighter than the UCAC3 distribution. This is because our data is more precise than UCAC3 data.
In the lower panels of Fig. 3 we show the proper motions in and as a function of and coordinates. There is no clear systematic trend seen in this diagram.

3 Cluster CMD decontamination
PMs and are plotted as VPD in the top panels of Fig. 4. Bottom panels show the corresponding vs. CMD. Left panels show all stars while middle and right panels show the probable cluster members and field stars. A circle of 4 mas yr-1 around the cluster centroid in VPD of proper motions defines our membership criterion. The chosen radius is a compromise between losing cluster members with poor proper motions and including field stars sharing the cluster mean proper motion. The shape of cluster members PM dispersion is circular, providing that our PM measurements are not affected by any systematics. The CMD of most probable cluster members is shown in the lower middle panel. Main-sequence of the cluster is clearly separate out, which demonstrates the power of PMs derived in this study. The lower right panel represents the CMD for field stars. Few cluster members are also visible in this CMD because of their poorly determined proper motions.
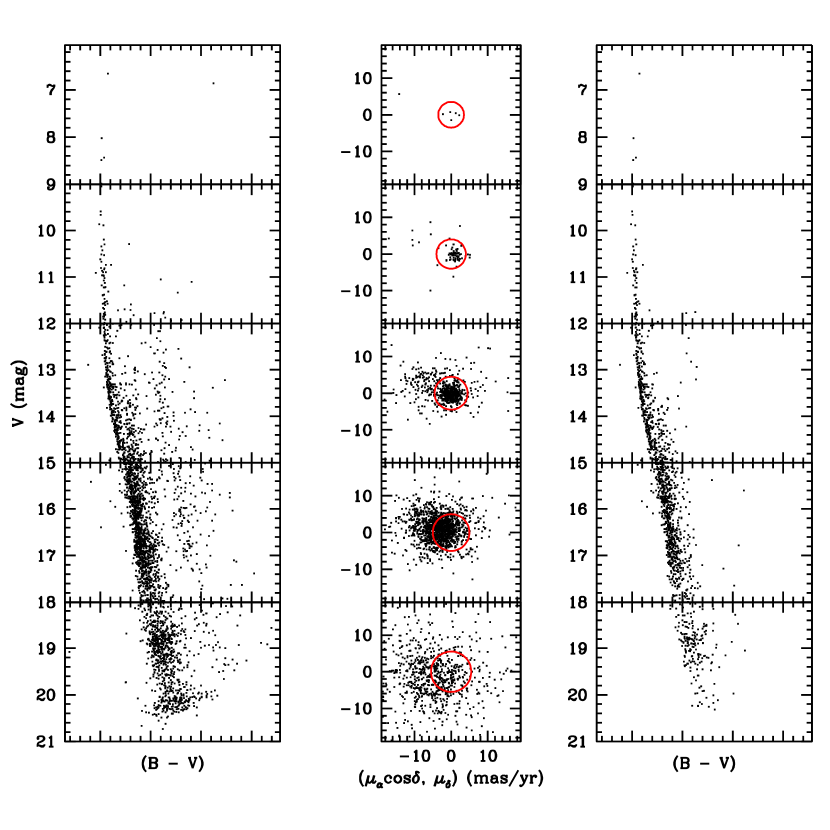
Fig. 5 shows CMD with VPD in various magnitude bins. We divided the CMD into five magnitude bins and in each bin, we adopted different selection criteria to identify cluster members, which were more stringent for stars with more reliable measurements from data of high signal-to-noise ratio, and less restrictive for stars with less precise measurements. These stars have a proper-motion error of 3.0 mas yr-1. For each magnitude bin, we considered as cluster members those stars with a proper motion within the circle shown in the middle column of Fig. 5. The right side of Fig. 5 shows the color-magnitude diagram for stars assumed to be cluster members. This figure shows that the separation of brighter cluster members from the field stars is clearly visible while fainter members are not clearly separated out. The reason may be that proper motions for fainter stars are not determined accurately. The available archive images are again not sufficiently deep to derive reliable proper motions of fainter stars. The proper motions derived in this paper are also not sufficiently accurate to study the internal motion of the cluster.
4 Membership Probabilities
The VPD for the proper motions derived in this study is shown in Fig.4. Present proper motion leads to the compact appearance of the cluster stars in VPD. Membership determination based on proper motions is useful for further astrophysical studies in the region of cluster. The fundamental mathematical model set up by Vasilevskis et al. (1958) and the technique based upon the maximum likelihood principle developed by Sanders (1971) for membership determination have been continuously used and refined.
An improved method for membership determination of stars in clusters based on proper motions with different observed precisions was developed by Stetson (1980) and Zhao & He (1990). Zhao & Shao (1994) then added the correlation coefficient of the field star distribution to the set of parameters describing their distribution on the sky.
A tight clump at cos==0.0 mas yr-1
in Fig. 4 is representing the cluster stars and a broad distribution
is seen for the field stars.
Fig. 5 indicates that the field stars centroid for panel 3 (middle column)
is at a different location than for the last panel. Therefore, we consider two groups
( mag and mag) for membership determination.
To determine the membership probability, we adopted the method
described in Balaguer-Nunez et al. (1998). This method has already
been used for Centauri (Bellini et al. (2009)) and by us for NGC 6809 (Sariya et al.
(2012)). In this method
first we construct the frequency distribution of cluster stars
() and field stars (). The frequency
function for the star of a cluster can be written as follows:
where and are the proper motions of the
star while and are the cluster’s proper motion
center. is the intrinsic proper motion dispersion of
cluster member stars and () are the
observed errors in the proper motion components of star. The
frequency distribution for field star is as follows:
where and are the proper motions of star while and are the field proper motion center. and are the observed errors in proper motions component and and are the field intrinsic proper motion dispersions and is the correlation coefficient. It is calculated by
We did not consider the spatial distribution of the stars due to small observed
field. To define the distribution function and we used
stars having proper motion error better than 3 mas yr-1. As expected, in the
VPD, the center of cluster stars is found to be at = 0.0 mas yr-1 and
= 0.0 mas yr-1. Our proper motion data set could not determine intrinsic
proper motion dispersion () for cluster stars. Assuming a distance of 2.5 kpc
(present estimate) and radial velocity dispersion 1 kms-1 for open clusters
(Girard et al. (1989)), the expected dispersion in proper motions would be
0.08 mas yr-1. Therefore, we adopted = 0.08 mas yr-1. For
field stars mag, we have: = 4.9 mas yr-1, = 2.7 mas yr-1,
= 5.7 mas yr-1 and = 4.0 mas yr-1, while
for mag: = 5.4 mas yr-1, = 0.5 mas yr-1
= 6.6 mas yr-1 and = 5.3 mas yr-1.
The distribution of all the stars can be calculated as
where and are the normalized number of stars for cluster and field
(). For the first group ( mag), and while
for the second group ( mag), and . Therefore, the membership
probability for star is
A good indicator of cluster and field separation is the membership probability. It is plotted as a function of magnitude in Fig. 6. As seen in this plot, high membership probability () extend down to mag. At fainter magnitudes the maximum probability gradually decreases.
Fig. 7 shows the histogram of membership probabilities for 2468 stars in the cluster region. It shows a clear separation between cluster members and field stars. This also indicates that the proper motion membership determination made using the method mentioned above is effective for the cluster NGC 3766. We find 818 stars with membership probabilities higher than 70%.

4.1 Effectiveness of membership determination
During the observations of the cluster we can not avoid the contamination
by background and foreground objects. The effectiveness of our membership
determination can be estimated using membership probabilities as described
in Shao & Zhao (1996). The effectiveness of membership determination is
estimated as:
,
where the bigger E is, the more effective the membership determination is.
So we determine the effectiveness of membership determination as 0.65 for NGC 3766. It is shown in Fig. 3 of Shao & Zhao (1996) that the effectiveness of membership determination of 43 open clusters are from 0.20 to 0.90 with peak value 0.55. Compared with the work by Shao & Zhao (1996), we can see that the effectiveness of membership determination for NGC 3766 is significantly high.


4.2 Membership probability of published Be and Ap stars
Present catalogue can be used to assign membership probability of various types of stars in this cluster. We found three Be stars and one Ap star in our catalogue according to the categorization in WEBDA. Membership probabilities of these stars are listed in Table LABEL:vari. The value of for the listed stars indicate that they are member of the cluster.
| Stars | |||
|---|---|---|---|
| 90 | Be | ||
| 90 | Be | ||
| 98 | Be | ||
| 94 | Ap |
5 Fundamental Parameters
5.1 Surface density distribution
Fig. 8 shows the radial density distribution of stars having membership probability . It is easily seen from the figure that the surface density distribution of the stars with radial distance () from the field center greater than 5 arcmin is quite flat, roughly being 2 stars per square arcminutes, which is due to field stars with the same proper motion as NGC 3766. So we can reasonably choose 5 arcmin as the cluster radius. The cluster radius 4 derived by Moitinho et al. (1997) with stars mag is lower than the present estimate. If the distance of the cluster determined by us is adopted (), the corresponding linear radius is 3.6 pc.
5.2 Interstellar reddening, distance and age
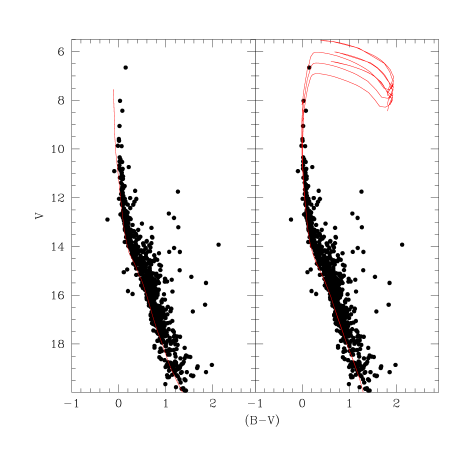
In order to determine the reddening and distance of the cluster, the CMD was plotted in the left panel of Fig. 9 for the stars . The reddening and distance is estimated by fitting the ZAMS given by Schmidt-Kaler (1982) to the observational CMD. The best coincidence of ZAMS line with CMD of the cluster was achieved at the value of color excess mag. Our derived value of reddening agrees fairly well with the value mag estimated by Moitinho et al. (1997). The best fit ZAMS provides the value of apparent distance modulus mag, which corresponds to a distance of 2.50.5 kpc. For this cluster, our estimated value of distance is similar to the value 2.20.3 kpc derived by Moitinho et al. (1997).
The age estimate of the cluster is based on visually fitting the theoretical isochrones described in Girardi et al. (2000). Isochrones of log(age) = 7.20, 7.30 and 7.40 are shown with continuous lines in the right panel of Fig. 9. The superposition of various isochrones on the CMD indicates that CMD is represented well with an isochrone of about 20 Myr. The present age estimate is not too different from the value 21 Myr derived in the previous studies (Moitinho et al. (1997), Mermilliod & Maeder (1986)).
6 Luminosity and Mass function
In order to estimate the luminosity function (LF), histogram of the number of stars were constructed with 1.0 mag intervals in using the stars of and shown in Fig 10. The interval of 1.0 mag was chosen so that there would be enough stars per bin for good statistics, as well as to provide a reasonable number of bins for the determination of mass function’s slope. Fig 10 shows that the LF continues to rise to mag and falls precipitously thereafter due to incompleteness in the photometry. With completeness becoming a problem after mag ( 16 mag), the LF is complete upto mag. There is no apparent structure seen in LF to the level where the photometry is complete.

Using the cluster’s parameters derived in this analysis and theoretical models given by Girardi et al. (2000) we have converted LF to mass function (MF) and the resulting MF is shown in Fig 11. The MF slope can be derived by using the relation log log+constant, where represents the number of stars in a mass bin with central mass and is the slope of MF. This relation fit over the mass range ( mag) gives a slope of -1.600.10 for the MF. Recently, Moitinho et al. (1997) derived the MF slope as -1.410.08 in the mass range . Our derived value of MF slope is in agreement with Moitinho et al. (1997).

7 Mass segregation
To study the cluster dynamical evolution and mass segregation, we selected the stars laying within the cluster radius and having with mag. We subdivided the stars into three magnitude range, i.e. , and mag corresponding to mass range , and . In Fig 12 we present cumulative radial stellar distribution of stars for different masses. An inspection of Fig 12 shows that the cluster exhibit a mass segregation effect. Massive stars seem to be centrally concentrated more than the low masses star. To check whether these mass distributions represent the same kind of distribution or not we perform the Kolmogorov-Smirnov (K-S) test. This indicates that mass segregation has taken place at a confidence level of 97%. Further, it is important to investigate that whether existing mass segregation is caused by dynamical evolution or the imprint of star formation process.
One of the possible causes of mass segregation is the dynamical evolution of the cluster. Over the lifetime of star cluster, encounters between its member stars gradually lead to an increased degree of energy equipartition throughout the cluster. The most important result of this process is that the higher mass cluster members gradually sink towards the cluster center and in the process transfer their kinetic energy to the more numerous lower mass stellar component, thus leading to mass segregation. The time-scale on which a cluster will have lost all traces of its initial condition is well represented by its relaxation time . It is given by
where is the number of cluster members, h is the half-mass radius of the cluster and is the mean mass of the cluster stars (cf. Spitzer & Hart (1971)). The value of and are 283 and 1.5 M⊙ respectively. h has been assumed as half of the cluster radius derived by us. Using the above relation we estimated the dynamical relaxation time 10 Myr for NGC 3766. A comparison of cluster age with its relaxation time indicates that the relaxation time is smaller than the age of the cluster. Therefore, we can conclude that the cluster is dynamically relaxed.
8 The catalog
The catalogue of proper motions with their corresponding uncertainties and membership probabilities for 2500 stars in the region of NGC 3766 is provided here. In the catalogue, Col. (1) contains the running number; Cols. (2) and (3) provide the J2000 equatorial coordinates, while Cols. (4) and (5) provide the pixel coordinates and . Columns (6) to (9) represent relative proper motions and their standard errors. Cols. (10) to (13) gives photometric data i.e., and magnitudes and their corresponding errors. If photometry in a specific band is not available, a flag equal to 99.999 is set for the magnitude and 0.999 for the error. Cols. (14) gives the membership probability . A sample of the data file is given in Table LABEL:cata.

| ID | x | y | B | V | |||||||||
| (1) | (2) | (3) | (4) | (5) | (6) | (7) | (8) | (9) | (10) | (11) | (12) | (13) | (14) |
| [h:m:s] | [d:m:s] | [pixel] | [pixel] | [mas/yr] | [mas/yr] | [mas/yr] | [mas/yr] | [mag] | [mag] | [mag] | [mag] | [] | |
| 1 | 11:35:48.75 | -61:51:46.7 | 4501.195 | 347.482 | -4.522 | 1.269 | 13.090 | 2.856 | 16.599 | 0.013 | 15.141 | 0.009 | 0 |
| 2 | 11:35:05.82 | -61:51:34.0 | 5777.605 | 399.354 | 3.015 | 1.428 | 9.599 | 2.618 | 18.418 | 0.029 | 17.488 | 0.011 | 1 |
| 3 | 11:35:40.38 | -61:51:30.1 | 4749.722 | 417.288 | -3.729 | 1.825 | 3.134 | 1.706 | 16.168 | 0.011 | 15.499 | 0.010 | 23 |
| 4 | 11:35:47.94 | -61:51:28.3 | 4525.247 | 424.681 | 5.196 | 3.054 | -1.309 | 2.975 | 19.413 | 0.001 | 18.549 | 0.062 | 78 |
| 5 | 11:36:53.59 | -61:51:11.6 | 2574.500 | 490.833 | -11.503 | 2.261 | 14.954 | 1.785 | 21.918 | 0.128 | 19.973 | 0.133 | 0 |
| - | —— | —— | —— | —— | —— | —– | —– | —- | —- | —- | —- | —- | – |
9 Conclusions
The purpose of this study is to provide a catalogue of precise proper motions and membership probability of stars in the field of open cluster NGC 3766. We have obtained proper motions and astrometric membership probabilities down to mag in 1530 arcmin2 area around the open cluster NGC 3766. The fundamental parameters, LF, MF and mass segregation are derived using the stars of . The linear radius of the cluster derived in the present study is 3.6 pc. The interstellar reddening is found to be 0.220.05 mag. A distance of 2.50.5 kpc and an age of 20 Myr have been derived for the cluster. The MF slope is estimated using the stars brighter than 16.0 mag in . Present analysis indicates that NGC 3766 is dynamically relaxed and one possible reason of this relaxation may be the dynamical evolution of the cluster.
Finally, we provide the membership probability for different types of stars, already
found in the literature. Here, we also demonstrate that the CCD observations taken
just 6 years apart can provide accurate proper motions and it can be used to separate
the cluster members from field stars down to mag.
ACKNOWLEDGMENTS
This work was based on observations with the MPG/ESO 2.2-m telescope located at La
silla and Paranal Observatory, Chile, under DDT programs 164.O-0561(E) and 077.C-0188(B).
We thank the anonymous referee for a careful reading of the manuscript and for many useful
comments. This research has made use of the VizieR catalogue access tool, CDS, Strasbourg,
France and of the WEBDA open cluster database.
References
- Ahmed et al. (1962) Ahmed, F., 1962, Publ. R. Obs. Edinb., 3, 57
- (2) Aidelman, Y., Cidale, L. S., Zorec, J., Arias, M. L., 2012, A&A, 544, 64
- Anderson et al. (2006) Anderson, J., Bedin, L. R., Piotto, G., Yadav, R. K. S., Bellini, A. 2006, A&A, 454, 1029, [Paper I]
- Balaguere et al. (1998) Balaguer-Núñez, L., Tian, K. P. & Zhao, J. L., 1998, A&AS, 133, 387
- Baumgardt et al. (2000) Baumgardt, H., Dettbarn, C., Wielen, R., 2000, A&AS, 146, 251
- Bellini et al. (2009) Bellini, A., Piotto, G., Bedin, L. R., Anderson, J., Platais, I., Momany, Y., Moretti, A., Milone, A. P., Ortolani, S., 2009, A&A, 493, 959
- Girard et al. (1989) Girard, Terrence M.; Grundy, William M.; Lopez, Carlos E.; van Altena, William F., 1989, AJ, 98, 227
- Girardi et al. (2000) Girardi, L., Bressan, A., Bertelli, G., Chiosi, C., 2000, A&AS, 141, 371
- Lloyd et al. (1980) Lloyd Evans T., 1980, MNRAS, 192, 47
- McSwain et al. (2005) McSwain, M. V.; Gies, D. R., 2005, ASPC, 337, 270
- Mermilliod et al. (1986) Mermilloid, J. C., Maeder, A., 1986, A&A, 158, 45
- Moitinho et al. (1997) Moitinho, Andre; Alfaro, Emilio J.; Yun, Joao Lin; Phelps, Randy L., 1997, AJ, 133, 1359
- Sher et al. (1965) Sher, D., 1965, MNRAS, 129, 237
- Schild et al. (1970) Schild, R. E., 1970, ApJ, 161, 855
- Sanders et al. (1971) Sanders, W. L., 1971, A&A, 14, 226
- Sariya et al. (2012) Sariya, D. P.; Yadav, R. K. S.; Bellini, A., 2012, A&A, 543, 87
- (17) Spitzer, L. & Hart, M. H., 1971, ApJ, 164, 399
- Stetson et al. (1980) Stetson, P. B., 1980, AJ, 85, 387
- Shao et al. (1996) Shao, Z. Y., Zhao, J. L., 1996, Acta Astron Sin, 37, 377
- Shobbrooket al. (1985) Shobbrook, R. R., 1985, MNRAS, 1985, 212, 591
- Shobbrook et al. (1987) Shobbrook, R. R., 1987, MNRAS, 1985, 225, 999
- (22) Schmidt - Kaler Th., 1982, In: Landolt/Bornstein, Numerical Data and Functional Relationship in Science and Technology, New series, Group VI, Vol. 2b, Scaifers K. & Voigt H. H. (eds.) Springer - Verlog, Berlin, p. 14
- Tadross et al. (2001) Tadross, A. L., 2001, New Astronomy, 6, 293
- Vasilevskis et al. (1958) Vasilevskis, S., Klemola, A., Preston, G., 1958, AJ, 63, 387
- Yadav et al. (2008) Yadav, R. K. S.; Bedin, L. R.; Piotto, G.; Anderson, J.; Cassisi, S.; Villanova, S.; Platais, I.; Pasquini, L.; Momany, Y.; Sagar, R., 2008, A&A, 484, 609
- Yilmaz et al. (1976) Yilmaz, F., 1976, A&AS, 26, 1
- Zacharias et al. (2010) Zacharias, N., Finch, C., Girard, T., Hambly, N. et al., 2010, AJ, 139, 2184
- Zhao et al. (1990) Zhao, J. L. & He, Y. P., 1990, A&A, 237, 54
- Zhao et al. (1994) Zhao, J. L. & Shao, Z. Y., 1994, A&A, 288, 89