e-mail: strilchuk@isp.kiev.ua††thanks: 41, Prosp. Nauky, Kyiv 03028, Ukraine\sanitize@url\@AF@joine-mail: strilchuk@isp.kiev.ua ††thanks: 41, Prosp. Nauky, Kyiv 03028, Ukraine\sanitize@url\@AF@joine-mail: strilchuk@isp.kiev.ua
EXCITONIC PARAMETERS OF InxGa1-xAs–GaAs
HETEROSTRUCTURES WITH QUANTUM WELLS
AT LOW TEMPERATURES
Abstract
Characteristics of GaAs/InxGa1-xAs/GaAs heterostructures with a single quantum well, which were obtained at various growth parameters, are evaluated according to the results of measurements of low-temperature photoluminescence (PL) spectra and their corresponding theoretical analysis. The experimentally obtained temperature dependences of the energy position of the PL band maximum, , band half-width, , and intensity, , are examined. The values of energy of local phonons, , exciton binding energy, , and the Huang–Rhys factor, , are determined. A comparison between the values obtained for those quantities and the growth parameters of considered specimens allowed us to assert that the highest-quality specimens are those that are characterized by low values and one-mode phonon spectra.
1 Introduction
InxGa1-xAs–GaAs heterostructures are widely used in modern optoelectronics as structures that are capable of being adapted for the convenient reception, transmission, and transformation of radiation in various spectral ranges. Special attention is attracted to heterostructures with quantized layers owing to their enhanced sensitivity and a possibility to additionally vary the optical spectrum [1, 2, 3, 4, 5, 6, 7]. The energy of an emitted quantum in such heterostructures is governed by the distance between the size-quantization levels of electrons and holes, , which, in turn, depend on the quantum well (QW) width and the composition of a substitutional solid solution ( is the indium content). For instance, for the typical values and , the changes of by 1% and the well width by the width of a monolayer (approximately 3 Å) give rise to the variations by 9 and 4 meV, respectively, in the transition energy [4]. Such a high sensitivity to the parameters imposes strict requirements on both the width and the element composi- tion of QW.
| Specimen | In | , Å | cap, Å | , meV | , meV | |||
|---|---|---|---|---|---|---|---|---|
| , eV | , meV | , rel. units | ||||||
| No. 1 | 0.16 | 84 | 220 | 1.3568 | 7.4 | 1093 | 4.5 | 52 |
| No. 2 | 0.21 | 88 | 230 | 1.33 | 9.9 | 582 | 2.8 | 55 |
| No. 3-1 | 0.20 | 92 | 600 | 1.355 | 7.3 | 4876 | 5 | 70 |
| No. 3-2 | 0.20 | 92 | 600 | 1.3721 | 10.9 | 949 | 2.5 | 46 |
| No. 4-1 | 0.35 | 73 | 600 | 1.253 | 15.2 | 302 | 2.5 | 85 |
| No. 4-2 | 0.35 | 73 | 600 | 1.396 | 13.2 | 988 | 2.5 | 60 |
N o t a t i o n: is the relative content of indium, is the quantum well width, cap is the thickness of the protective GaAs la- yer, is the maximum position in the PL spectrum, is the line half-width, is the PL intensity, and are the activation energies.
Moreover, a shortcoming of those heterostructures consists in a considerable mismatch between the lattice constants in the epitaxial layer and the substrate, which results in the emergence of substantial mechanical stresses and the generation of numerous dislocations. Buffer layers or the formation of quaternary alloys with the phosphorus additive usually reduce the influence of those undesirable factors, but not completely. Therefore, there arises the requirement in a non-destructive quantitative control over the deformation and defect factors.
In this report, we pay attention to a possibility of using the interaction between phonons and excited electrons (the Huang–Rhys factor ) for the characterization of the imperfection degree. This parameter is determined on the basis of the temperature behavior experimentally found for the exciton photoluminescence band half-widths and subjected to the corresponding theoretical analysis.
2 Experimental Specimens and Technique
Low-temperature (5–200 ) photoluminescence (PL) researches are carried out with the use of heterostructures with a single quantum well, GaAs/InxGa1-xAs/GaAs. The specimens were grown up following the MOCVD technology. They were characterized by various contents of indium, various widths of InxGa1-xAs quantum wells, and various thicknesses of protective GaAs layers (Table 1). Luminescence was excited by a He–Ne laser (a quantum energy of 1.96 eV, and the radiation intensity quantum/(cm2s)). To analyze the PL spectra, we used an MDR-23 monochromator with the spectral resolution not worse than 0.2 meV. The signal was registered with the use of a cooled FEP-62 photoelectronic multiplier.
3 Experimental Part
In the photoluminescence spectra of researched specimens, we observed the intensive bands, which correspond to the exciton recombination e1-hh1 in the quantum well in the interval and to the recombination of free charge carriers in the quantum well in the interval . This fact is confirmed by the dependences of the radiation intensity on the excitation one, . The main growth parameters of studied specimens and the corresponding photoluminescence bands are quoted in Table 1.
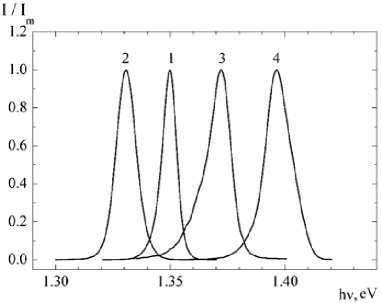
In Fig. 1, a, the normalized PL spectra of the specimens under investigation obtained at are depicted. Attention should be paid to some spectral features. First of all, it is the spread in the energy positions of PL bands, which stems from different values of quantum well widths and indium contents in the InxGa1-xAs quantum well. However, even provided that the corresponding values of and are identical, the energy positions of PL bands can differ substantially. For instance, for specimens 4-1 and 4-2 with the identical and Å, the energy positions of PL maxima are different (see Table 1); namely, for specimen 4-2 and 1.253 for specimen 4-1. In our opinion, the origin of such a discrepancy consists in fluctuations of the In concentration in the QWs of specimens 4-1 and 4-2. Really, if the energy difference between the radiation maxima, , was caused by the difference between the quantum well widths, the latter would be amount to about (this value can be obtained with regard for the fact mentioned above that a change of the QW width by about 3 Å gives rise to a variation of about 4 meV in the transition energy), but such a value is unreal. This reasoning agrees with the results of work [4], where it was noticed that a variation in the spectral positions of exciton peaks for the InxGa1-xAs quantum well is mainly associated with the variations in the In concentration .
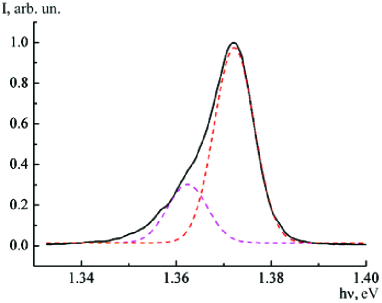
Different half-widths (Table 1) and shapes of examined PL spectra exhibited in Fig. 1, a compose another feature of those spectra. The PL band half-width depends on both the degree of exciton localization in the QW and the character of exciton scattering by phonons, defects, inhomogeneities at heterointerfaces, and so forth. The radiation emission spectra of some specimens demonstrate a characteristic tail of the PL band in the low-energy interval, which may be caused by the participation of phonons in the radiative recombination of excitons in the QW. As an example, we decomposed the PL band of specimen 3-2 into two components: the zero-phonon one and the phonon replica (Fig. 1, b), with the use of the procedure proposed in work [8]. In so doing, we used an approximation that phonons of only one type participate in PL. This approach enabled us to obtain the value for the energy of interacting local phonons and for the Huang–Rhys factor, which characterizes the strength of exciton–phonon interaction.
a
b
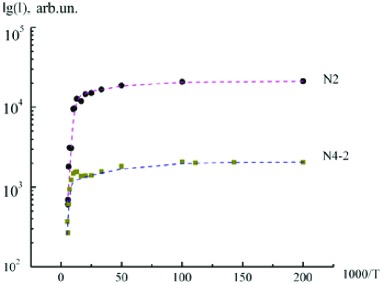
As to the half-width of PL bands (Table 1), it changes from 7.4 meV for specimen 3-1 to 15.2 meV for specimen 4-1. In our case, the Bohr radius of an exciton in the QW is comparable with the QW width. Therefore, with a high probability, the exciton is localized at inhomogeneities of heterointerfaces. The smaller width of the PL band corresponds to a larger localization degree, as it takes place for PL by bound excitons in a bulk semiconductor. The temperature dependences of the PL intensity typical of the specimens under consideration are shown in Fig. 2. At low temperatures (), the PL intensity varies weakly. As the temperature grows, the PL intensity decreases for specimens 1 and 2 and, for specimens 3 and 4, first slightly increases and then falls down, which is connected with the temperature-induced ejection of charge carriers from the quantum well into the barrier.
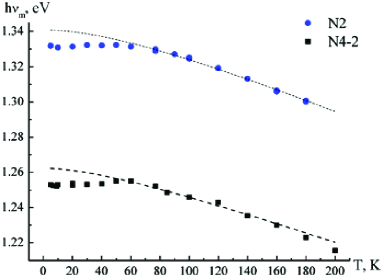
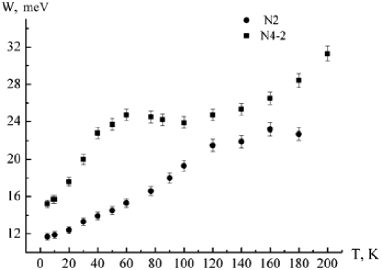
In Fig. 3, the temperature dependences of the radiation maximum position typical of examined specimens are depicted. The dashed curve demonstrates the results of calculation obtained in the framework of the Varshni model. For all specimens, the temperature dependences of the PL maximum position have an S-like form. At low temperatures, a considerable deviation of the calculated values from experimental ones is observed: first, the position of the PL maximum shifts toward low energies (red shift); then, up to a certain temperature, the maximum shifts backward toward high energies. At , the maximum position shifts toward low energies in accordance with the Varshni model.
In Fig. 4, the typical dependences of the PL band half-width on the temperature are shown. For specimens 1 and 2, a monotonous increase of the half-width with the temperature (the dependence of type I) is observed. Specimens 4 are characterized by a sharp initial (to a temperature of 40–80 ) growth of the half-width, then by an insignificant reduction of this parameter followed by its subsequent growth, as the temperature grows further (the dependence of type II). For specimens 3, the dependences of both types are observed.
4 Discussion of Experimental Results
The temperature dependences of the PL intensity obtained for specimens 2 and 4-2 (Fig. 2) were analyzed with the use of the Arrhenius formula
This enabled us to determine two temperature intervals with different slopes: low- and high-temperature ones with the activation energies and , respectively (Table 1). In the low-temperature interval, . Such a small value of testifies that this quantity corresponds to the delocalization energy of excitons bound at inhomogeneities of heterointerfaces in the QW at low temperatures. It is significant that the higher the delocalization energy (and, accordingly, the deeper is the potential well, which is associated with the corrugation of heterointerfaces), the narrower is the PL band, which corresponds to a more localized state of excitons (see, e.g., the PL bands for specimens 1 and 3-1). At temperatures K, the activation energy for the temperature-induced quenching of the PL band owing to the e1-hh1 transitions equals , and, as was indicated above, this is connected with the temperature-induced ejection of charge carriers into the barrier.
The temperature dependences of the PL maximum depicted in Fig. 3 and their comparison with the results of calculations following the Varshni formula allow the binding energy of excitons in the QW to be evaluated. As one can see from Fig. 3, the energy of a quantum emitted at low temperatures () is lower than the energy of interband transitions calculated by the Varshni formula. The corresponding difference is just the binding energy of excitons in the QW to within the accuracy of the energy of exciton localization at heterointerfaces.
The theoretical analysis of the temperature dependences obtained for the scattering parameter (the PL band half-width ) is based on the fact that this quantity comprises the probability of the momentum scattering as a result of several independent processes (by impurities, phonons, and others),
| (1) |
where is the lifetime of nonequilibrium charge carriers. The temperature dependences of the scattering probability are different for different mechanisms. Hence, the temperature dependence can be used to distinguish between their contributions. In particular, the Coulomb scattering by local centers depends on , which is the most pronounced at low enough temperatures. At the same time, the role of the phonon mechanism grows with [9, 10], according to the law
| (2) |
where is the energy of a phonon localized at a radiative-recombination center, and is the phonon emission probability at the recombination (the Huang–Rhys factor). In the case , the latter is given by the following relation:
| (3) |
where is the exciton binding energy, the Bohr radius of an exciton, and and are the static and high-frequency dielectric permittivities, respectively. From this formula and knowing the phonon energy , it is easy to find the binding energy of an exciton [11],
| (4) |
| Specimen | , meV | , meV | , Å | |
|---|---|---|---|---|
| No. 1 | 8 | 0.15 | 9.1 | 122 |
| No. 2 | 6.5 | 0.42 | 20.8 | 54 |
| No. 3-1 | 11 | 0.08 | 6.7 | 168 |
| No. 3-2 | 8 | 0.27 | 16.5 | 8 |
| 12 | 0.149 | 13.6 | 82 | |
| No. 4-1 | 3.2 | 3.1 | 78.7 | 14 |
| 18 | 0.13 | 19.0 | 58.8 | |
| No. 4-2 | 3.5 | 3.4 | 95.4 | 12 |
| 19 | 0.22 | 33.5 | 33 |
Hence, the temperature dependence allows a number of parameters that characterize the heterostructure state – such as , , and [12] – to be obtained, as well as the Stokes shift,
It also enables one to evaluate the position of the phonon-free line by the formula , where is the number of phonon replica.
Special attention should be paid to the quantity . Its magnitude is reciprocal to the charge carrier mobility and is predicted to be much less for a perfect quantum well than that for the corresponding bulk material. However, mechanical stresses and defects can compensate this useful effect. The proposed analysis allows the contributions of different mechanisms to be estimated separately.
The features in the temperature dependences of the PL intensity, maximum position, and half-width obtained in this work can be explained by the presence of localized (defect) states in the studied specimens [6, 7], which are induced by fluctuations of QW dimensions, and/or by a variation of the QW composition. At low temperatures, photo-induced charge carriers (excitons) are captured by the localized potential. As the temperature is elevated to a value that corresponds to the localization energy maximum, a shift of the PL maximum position toward lower energies (the red shift) is observed, because excitons obtain a sufficient thermal energy to overcome the potential barrier and become relatively free. Some of those excitons relax into lower states, which capture them, and recombine there. In this temperature interval, we observe a drastic increase in the half-width of the PL band, in accordance with the growth in the population of states owing to the capture of released charge carriers onto them. As the temperature grows further, the PL maximum shifts into the range of high energies, and the band half-width becomes somewhat narrower due to the thermally equilibrium distribution of excitons. This occurs until the temperature corresponding to the complete delocalization of charge carriers is attained. At higher temperatures, the e1-hh1 transitions dominate in the PL spectrum, and, according to the Varshni formula, the maximum position changes with the temperature as the energy gap width.
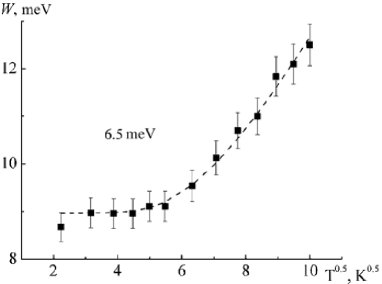
With the use of Eqs. (2)–(4) and the experimentally obtained temperature dependences for the PL band half-width, we determined the parameters , , , and the Bohr exciton radius (see Table 2). Let us consider this dependence of type I (it is inherent to specimens 1, 2, and 3-1). It has a monotonous character and can be described well by Eq. (2), in which the scattering processes with phonons of energies 6 to 11 meV are taken into consideration (Fig. 5, a).
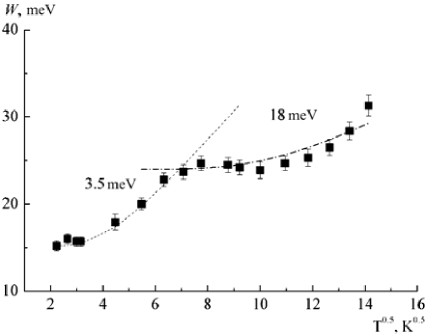
For structures 4, the character of the band half-width dependence on the temperature is of the other type (type II). For those specimens, we determined two values for the energy of local phonons (Fig. 5):
(i) in the interval from 5 to 20 , where a drastic increase of the band half-width is observed, the energy of phonons is 3.5–4 meV;
(ii) in the interval from 30 to 200 , an insignificant narrowing of the PL band is observed, which is followed by the increase of its half-width with the temperature; here, the energy of phonons equals 18–19 meV.
a
b
c
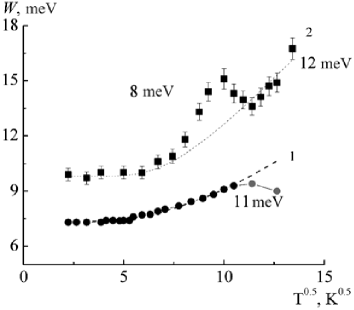
Structures 3 revealed the dependences of both types. Specimen 3-1 demonstrated the dependence of monotonous type I, and the corresponding energy of phonons was 11 meV (Fig. 5,c, curve 1). Specimen 3-2 was characterized by the dependence of type II: the energy of phonons was 8 meV in the interval 5–60 and 12 meV in the interval 60–200 (Fig. 5, c, curve 2).
The magnitudes of exciton binding energy obtained with the help of Eq. (4) for various specimens () considerably exceed the corresponding energy for bulk excitons in InxGa1-xAs () [1], which testifies to the quantization of excitons in the InxGa1-xAs–GaAs quantum well.
Let us compare the values of obtained from the temperature dependences of the line width with the theoretical relations (1)–(4) (see Table 2). For every specimen, it turned out several times less than the characteristic values for bulk or surface (confinement) phonons. An evident reason is the fact that the studied specimens with heterojunctions had rather a large number of defects, probably localized at interfaces. It is known that one of the mechanisms of defect emergence in InGaAs structures consists in the segregation of clusters of the In phase if the optimum epitaxy and temperature regimes were not followed at the stage of heterostructure formation [3]. Hence, the typical defects have to include precipitates of the redundant element, i.e. indium.
Now let us estimate the energy of local phonons that correspond to vibrations in vicinities of defects at the interfaces between InGaAs and In precipitates. It is known that the maximum frequency of harmonic vibrations is determined by the relation [13]
| (5) |
where is Young’s modulus, is the thermal velocity, is the substance density, is the atomic (molecular) mass, and is the atomic (molecular) volume. In vicinities of defect centers, becomes several times smaller, and increases as the ratio between the densities of defect components. The lattice constant increases as the ratio between the atomic sizes of film components, GaAs)InGaAs). Hence, according to the estimations made for the InGaAs heterostructure, and . Whence,
| (6) |
Therefore, we may expect that the energy of local phonons in InGaAs is several times lower than that in the bulk, i.e. .
When comparing the values obtained for , , and with the growth parameters of specimens, we may assert that the specimens with small values of have the highest quality, i.e. the specimens with the highest mobility and the one-mode phonon spectrum.
5 Conclusions
Heterostructures GaAs/InxGa1-xAs/GaAs that have a single quantum well and are characterized by various growth parameters were studied with the use of the method of low-temperature photoluminescence. The following facts were revealed.
(i) The photoluminescence spectra of examined specimens demonstrate intense radiation bands. These bands are induced by the recombination of excitons in the quantum well in a temperature interval of 5–40 and by the recombination of free charge carriers in the quantum well in the interval .
(ii) For all specimens, the temperature dependence of the photoluminescence intensity maximum position has an S-like shape. In the low-temperature interval, the values calculated within the Varshni model considerably deviate from the experimen- tal data.
(iii) The researched specimens revealed both monotonous and nonmonotonous dependences of the photoluminescence band half-width on the temperature.
The features observed in the temperature dependences of the maximum position and the half-width of the PL band testify that all examined specimens contain defect states, in one quantity or another, induced by fluctuations in the QW composition; in particular, the inhomogeneities may occur owing to the segregation of In-phase clusters (in the form of 3D islands). The values of determined from the temperature dependences of the PL band width turned out several times lower than the corresponding characteristic values for bulk and surface phonons for all studied specimens. Specimens with a high intensity of radiation emission and a narrow radiation band were found to be characterized by a small value of the Huang–Rhys factor and a one-mode phonon spectrum. Local phonons of two types – with energies of 3.5–4 and 18–19 meV, respectively – take part in the process of exciton scattering in specimens with low intensities of radiation and wide radiation bands (i.e. with a worse structural quality).
The authors express their sincere gratitude to Corresponding Member of the NAS of Ukraine V.G. Litovchenko for the discussion of the results of this work and useful advices.
References
- [1] I.A. Avrutskii, V.A. Sychugov, and B.A. Usievich, Fiz. Tekh. Poluprovodn. 25, 1787 (1991).
- [2] I.A. Avrutskii and V.G. Litovchenko, Fiz. Tekh. Poluprovodn. 31, 875 (1997).
- [3] M.M. Grigoriev, E.G. Gule, A.I. Klimovska, Yu.A. Korus, and V.G. Litovchenko, Ukr. Fiz. Zh. 45, 853 (2000).
- [4] I.A. Avrutskii, O.P. Osaulenko, V.G. Plotnichenko, and Yu.N. Pyrkov, Fiz. Tekh. Poluprovodn. 26, 1907 (1992).
- [5] H.D. Sun, R. Macaluso, S. Calvez, and M.D. Dawson, J. Appl. Phys. 94, 7581 (2003).
- [6] N.V. Kryzhanovskaya, A.Yu. Egorov, V.V. Mamutin, N.K. Polyakov, A.F. Tsatsulnikov, A.R. Kovsh, N.N. Ledentsov, V.M. Ustinov, and D. Bimberg, Fiz. Tekh. Poluprovodn. 39, 735 (2005).
- [7] F.-I. Lai, S.Y. Kuo, J.S. Wang, R.S. Hsiao, H.C. Kuo, J. Chi, S.C. Wang, H.S. Wang, C.T. Liang, and Y.F. Chen, J. Cryst. Growth 291, 27 (2006).
- [8] M. Soltani, M. Certier, R. Evrard, and E. Kartheusev, J. Appl. Phys. 78, 5626 (1995).
- [9] S.I. Pekar, Zh. Eksp. Teor. Fiz. 20, 510 (1950).
- [10] C.J. Hwang, Phys. Rev. 180, 827 (1969).
- [11] V.G. Litovchenko, N.L. Dmitruk, D.V. Korbutyak, and A.V. Sarikov, Fiz. Tekh. Poluprovodn. 36, 447 (2002).
- [12] V.A. Zuev, D.V. Korbutyak, V.G. Litovchenko, and A.V. Drazhan, Fiz. Tverd. Tela 17, 3300 (1975).
-
[13]
I. Bolesta, Solid State Physics (Lviv, Lviv. Nats.
Univ., 2003) (in Ukrainian).
Received 12.12.12.
Translated from Ukrainian by O.I. Voitenko
Н.М. Литовченко, Д.В. Корбутяк, О.М. Стрiльчук
ЕКСИТОННI
ХАРАКТЕРИСТИКИ InxGa1-xAs–GaAs
ГЕТЕРОСТРУКТУР З
КВАНТОВИМИ ЯМАМИ
ПРИ НИЗЬКИХ ТЕМПЕРАТУРАХ
Р е з ю м е
Проведена оцiнка
характеристик гетероструктур з одиночною квантовою ямою
GaAs/InxGa1-xAs/GaAs з рiзними ростовими параметрами за
результатами вимiрювань низькотемпературних спектрiв
фотолюмiнесценцiї (ФЛ), з вiдповiдним теоретичним аналiзом.
Проаналiзованi експериментально отриманi температурнi залежностi
енергiї максимуму смуги ФЛ (, пiвширини ( та
iнтенсивностi . Визначено параметри (енергiя
локальних фононiв), (енергiя зв’язку екситонiв) та
(фактор Хуанга–Рiс). Проведене зiставлення отриманих значень
, та з ростовими параметрами
зразкiв дає пiдставу стверджувати, що найбiльш якiсними є зразки з малим значенням i одномодовим фононним
спектром.