XMM-Newton Observation of the Persei Cluster
Abstract
We report on the analysis of an archival observation of part of the Persei cluster obtained with XMM-Newton. We detected 102 X-ray sources in the band 0.3-8.0 keV, of which 39 of them are associated with the cluster as evidenced by appropriate magnitudes and colors from 2MASS photometry. We extend the X-ray Luminosity Distribution (XLD) for M dwarfs, to add to the XLD found for hotter dwarfs from spatially extensive surveys of the whole cluster by ROSAT. Some of the hotter stars are identified as a background, possible slightly older group of stars at a distance of approximately 500 pc.
1 Introduction
Open clusters have been a keystone in understanding stellar evolution because they contain stars at the same distance with similar reddening formed at the same time with the same chemical composition, at least to a first approximation. Their members display a range of masses, temperatures, luminosities, rotation rates, and multiplicity which can be explored. Comparison of cluster morphology provides an age sequence as a context for the evolution of stars. The well-known spin-down of low mass stars with age due to magnetic braking provides a good example of insight from clusters. This slowing of rotation results in the decrease of coronal X-rays due to their connection with stellar dynamos. Good summaries of the decrease in stellar activity as stars age for a range of masses are provided by Favata and Micela (2003) and Güdel (2004).
Per is a young open cluster, found to be 50 Myr old from upper main sequence turnoff morphology (Meynet, Mermilliod, and Maeder, 1993). More recently, Stauffer, et al. (1999) have found an age of 90 Myr from the low mass lithium depletion boundary. Although there is some dispersion in the exact calibration of the age of the cluster, the sequence of age (increasing from the Orion Nebula Cluster through the Per cluster through the Pleiades) is generally agreed. Thus, studies find a range in age from 50 to 90 Myr. We will use the shorthand “50 Myr” for the age of the cluster.
This age makes it an excellent comparison for Cepheids and their companions. Indeed, Per itself is a yellow supergiant, with similar parameters to Cepheids, except for its location at a temperature outside the instability strip. As an example of usage of the cluster, we have observed a number of Cepheids with the Hubble Space Telescope Wide Field Camera 3 to identify a population of resolved low-mass stars close to Cepheids which are probable physical companions. X-ray observations showing an activity level comparable to that of Per dwarfs would confirm that they are young companions rather than chance alignments with old field stars (e.g. Evans, et al. 2012). Another interesting aspect of a cluster of this age is that it is the period when young planets have just finished forming, and thus we gain insight into the X-ray environment during the early formation of atmospheres.
Because the cluster is nearby, it covers a wide area in the sky. It was observed with a raster of pointings by ROSAT (Randich, et al. 1996). Essentially all the late F, G, and K members from the membership studies of Prosser (1992) were detected. Three deeper pointed ROSAT observations (22-25 ks) were subsequently made covering part of the cluster (Prosser, et al. 1996). Two additional studies were made using near IR observations to try to identify counterparts of ROSAT sources (Prosser and Randich 1998; Prosser, Randich, and Simon 1998, PRS below). In the second of these, the authors identified a number of G and K stars with lower X-ray luminosity than expected for cluster members, which they termed “bad LX stars”. Finally, a deeper (60 ksec) exposure of a small part of the cluster was made with XMM, which was described briefly by Pallavicini, Franciosini, and Randich (2004). This is the observation which we discuss here, which allows us to investigate fainter sources as well as the spectral properties of the sources. In addition to being relatively nearby (170 pc; Randich, et al. 1996), the Per cluster is also lightly reddened (E(B-V) = 0.09 mag; Meynet, et al. 1993), making the data interpretation relatively robust.
The supergiant Per itself was detected in the ROSAT observations (Prosser, et al. 1996). However, recently Ayres (2011) has suggested that there is evidence that the X-rays might actually be produced by a low-mass X-ray active companion.
In this study we add the results of the deeper XMM image to the existing literature on the cluster. Specifically, in the sections that follow, we discuss the observations, the source detection and near IR matches, the source parameters (luminosity and spectra), the X-ray luminosity distribution (XLD), light curves, and the results. Of particular importance in deriving the cluster parameters (Discussion section, Section 4) is a grouping of stars likely to be a cluster of young stars behind the Per cluster.
2 Observations and Data Analysis
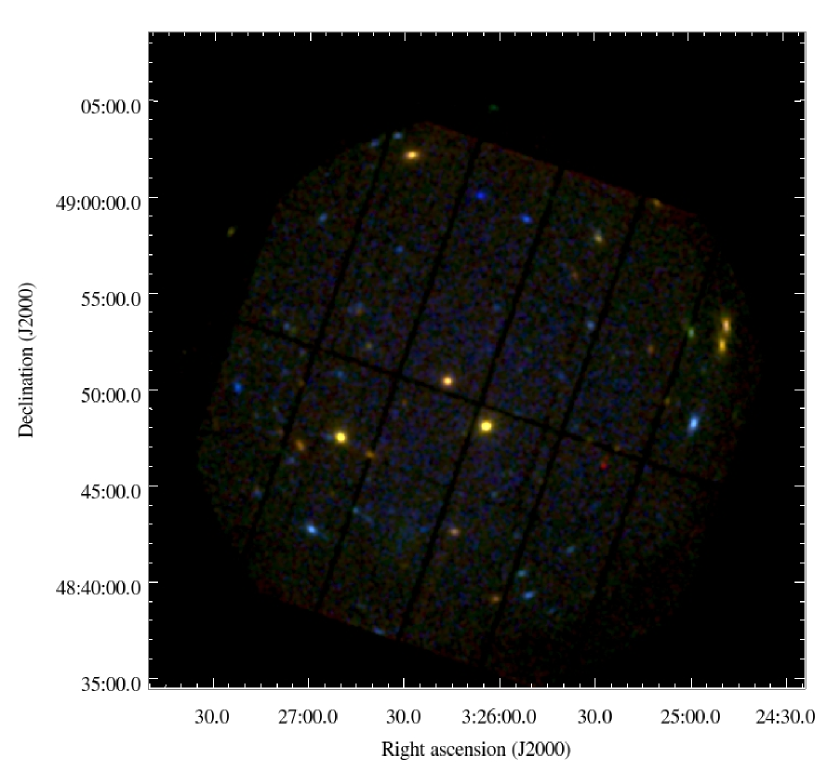
A fraction of the Per cluster was observed by XMM-Newton as part of the Mission Scientist Guaranteed Time (Pallavicini, et al 2004). A 60 ks observation was obtained in Sept 5th 2000-09-05 using EPIC MOS and PN cameras on board XMM-Newton with a pointing at R.A.: and Dec.: . Fig. 1 shows the composite PN, MOS 1 and MOS 2 image of the EPIC field within the Per cluster.
We carried out Data Analysis similar to that in Pillitteri, et al. (2004). We used the standard tasks of SAS v10.0 to reduce the (ODF) and obtain event tables calibrated in arrival time, energy and astrometry. First the events were filtered to be within the band 0.3–8.0 keV, appropriate for the coronal emission we want to investigate. Good time intervals (GTIs) were filtered out after inspecting the light curve of events at energies higher than 10 keV 222See http://xmm.esac.esa.int/sas/current/documentation/threads/EPIC_filterbackground.shtml and removing high background intervals (with rate thresholds of 2.5 ct s-1 for PN and 0.5 ct s-1 for MOS). This optimizes the event lists for the detection of faint X-ray sources.
| ID | R.A. | Dec. | Offaxis | Rate | Err | Exposure Time |
|---|---|---|---|---|---|---|
| J2000 | J2000 | ′ | cts/ks | cts/ks | ks | |
| 1 | 03:26:37.9 | 48:37:28.9 | 15 | 15.7 | 5.55 | 48.3 |
| 2 | 03:25:43.7 | 48:38:32.4 | 14 | 7.76 | 1.63 | 50.7 |
| 3 | 03:26:43.6 | 48:38:47.7 | 14 | 6.75 | 1.66 | 57.3 |
| 4 | 03:26:01.3 | 48:39:10.1 | 12 | 21.7 | 4.83 | 59.9 |
| 5 | 03:25:50.9 | 48:39:22.2 | 13 | 29.4 | 7.41 | 57.4 |
| ID | R.A. | Dec. | 2MASS ID | J | H | K | kT | E.M. | ||
|---|---|---|---|---|---|---|---|---|---|---|
| J2000 | J2000 | mag | mag | mag | keV | cm-3 | ergs s-1 cm-2 | ergs s-1 | ||
| 4 | 03:26:01.3 | 48:39:09.7 | 03260131+4839097 | 12.60 | 11.92 | 11.69 | 0.76 | 51.7 | -13.8 | 28.8 |
| 10 | 03:26:14.2 | 48:42:38.3 | 03261419+4842382 | 12.48 | 11.80 | 11.56 | 0.89 | 51.9 | -13.6 | 29 |
| 19 | 03:26:22.7 | 48:44:20.1 | 03262270+4844201 | 12.77 | 12.31 | 12.20 | 0.86 | 50.7 | -14.9 | 27.7 |
| 22 | 03:26:52.6 | 48:44:37.9 | 03265263+4844378 | 11.10 | 10.77 | 10.76 | 0.88 | 51.1 | -14.4 | 28.1 |
| 42 | 03:24:58.8 | 48:48:14.7 | 03245884+4848147 | 16.47 | 15.69 | 14.52 | – | – | – | – |
2.1 Source Detection
Source detection was performed using the algorithm based on wavelet convolution described in Damiani et al. (1997a,b) and optimized for XMM-Newton (Pillitteri et al. 2004). The threshold used for positive detection of sources was 4.8 above local background fluctuations.
The full list of source parameters is provided in Table 1 in the electronic version. The first few entries are provided in the hardcopy illustrate the content. The columns of the table list the source number, right ascension, declination, distance off axis, source count rate, and effective exposure time (for the summed MOS and PN detectors, assuming a PN–MOS conversion factor of 3.1). We detected 102 sources in 0.3-8.0 keV band.
2.2 Optical Catalogs
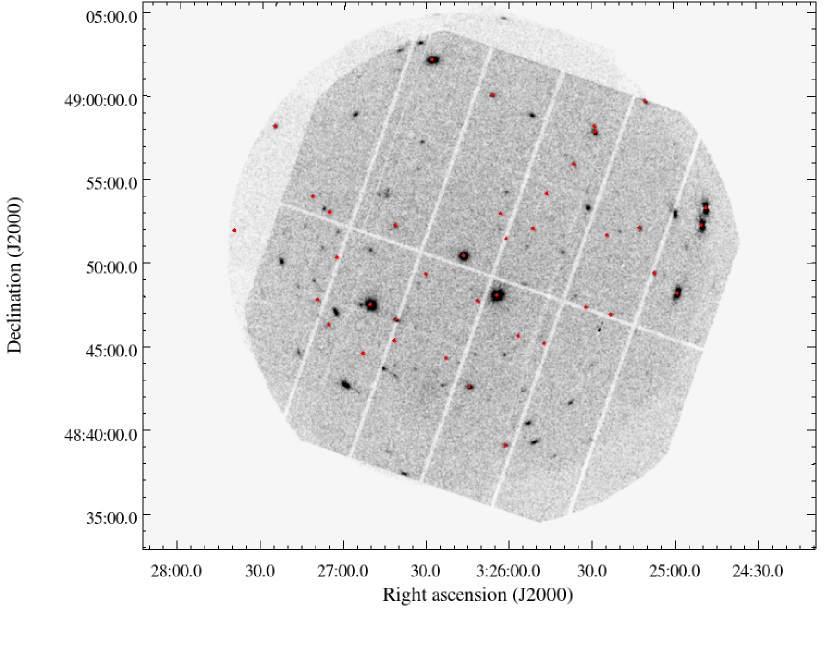
We have cross-correlated the positions of X-ray sources with the optical catalogs of Prosser (1992), Randich, et al (1996) and Deacon and Hambly (2004) with a match radius of 5. Only one object of the catalog by Prosser is in the main field of view of XMM but was not detected. Another object from that catalog is on the edge of the XMM field and was also undetected. Two objects of the Deacon and Hambly catalog are detected in X-rays, and four stars from the Randich et al. catalog are matched with X-ray sources. We have used the 2MASS catalog (Cutri, et al. 2003) to find near IR counterparts to the X-ray sources, finding 39 matches (Fig. 2). X-ray sources detected on the image (Fig. 1) are a mixture of active young stars from the Per cluster and background objects. Any star more massive than M5 would have a K magnitude 13.6 at the age and distance of Per (Siess, 2001). Therefore, we assume that sources without counterparts in the 2MASS catalog are distant active galactic nuclei (AGNs) which are too faint in the IR. Table 2 provides IR photometry for sources identified as stars within 5” of the position of X-ray sources, with with source number, coordinates, 2MASS ID, and J, H, and K magnitudes in successive columns. Parameters derived from fitting (kT, emission measure, and luminosity) are discussed below in Section 3.2. Note that in Table 2, X-ray luminosities have been computed from X-ray fluxes assuming the sources are at the distance of Per. This is probably not true for the “bad LX” sequence (discussed in Sections 3.1 and 4 below).
3 Results
3.1 The X-ray Luminosity
The color–magnitude diagram from the 2MASS photometry is shown in Fig. 3. In it, the sources are numbered with the X-ray source ID (Table 1). The size of the circle is proportional to the X-ray luminosity, which is derived from the count rate using a conversion factor from PIMMS derived from a 1-T APEC spectrum with kT=1 keV and NH = 1020 cm-3. Overlaid on the figure is the isochrone from Siess et al. (2000) for an age of 50 Myr and solar metallicity. The figure shows the well-known decrease in X-ray luminosity with bolometric luminosity along the main sequence. The Siess tracks allow us to infer masses (see Sect. 3.3).
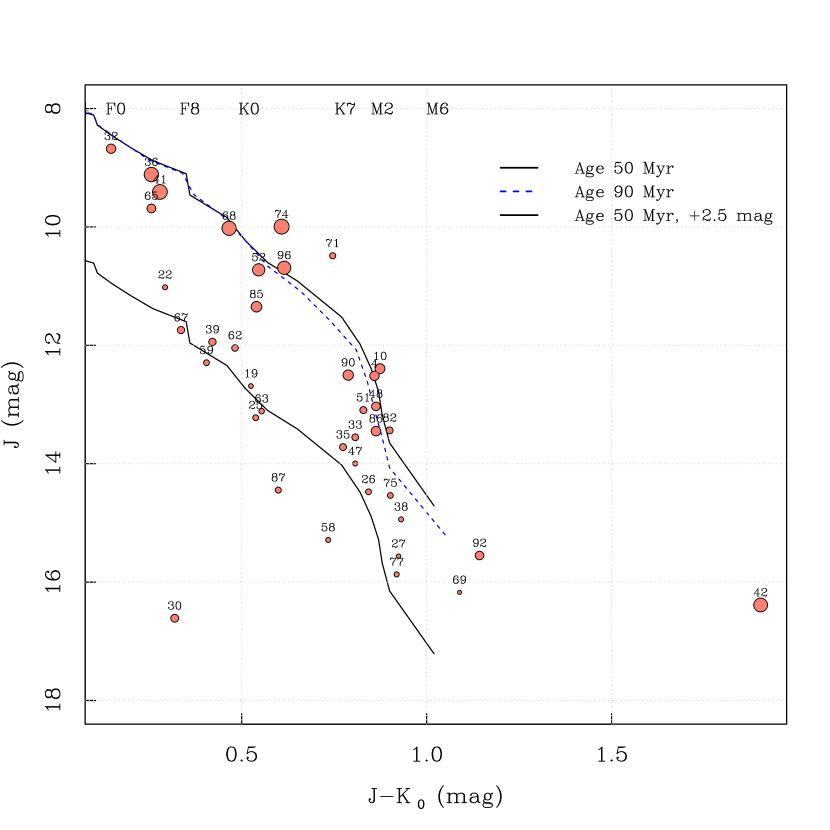
A second sequence below the main cluster sequence is present, near the shifted isochrone (dotted line) in Fig. 3. This sequence is made up of sources 19, 22, 25, 39, 58, 59, 62, 63, 67, and 87 in Table 2. For stars fainter than J 14 mag, the distinction between the two sequences is more ambiguous. However, referring to the morphology of the color-magnitude diagram in Lodieu, et al. (2012; Fig. 6) the main sequence is nearly vertical, and we accept the fainter stars as predominantly belonging to the cluster itself. The lower sequence appears to correspond to sources labeled “bad LX”, in PRS Fig. 5. These sources have a lower X-ray luminosity than the sequence of cluster members. We draw attention to the low-lying sequence in the near IR data (Fig. 3), and will discuss the characteristics of these stars in the succeeding sections. It is possible, of course, that some of the stars near the isochrone of the cluster are not in fact cluster members. Star 71, could for instance be a foreground star.
We have divided the stars in Fig 3 in a straightforward way to examine the dependencies of LX. There is a significant gap between the cluster main sequence, and the lower sequence, the stars classified “bad LX”. Within the cluster sequence, stars have been grouped into “F-G”, “K-early M”, and “late M” according to gaps in the magnitude distribution. Fig. 4 shows the count rate as a function of J magnitude. The F-G stars (asterisks) and the K-M stars (triangles) show the well known progression to lower count rates for cooler stars. The exceptions are a few of the hottest F-G stars, suggesting that their convective envelopes and X-ray production are just becoming established. The bad LX stars occur in a separate location, with lower count rates and fainter magnitudes, except that the faintest stars in both sequences which are mixed in the figure. Note that this is despite the fact that Fig. 3 shows that the “bad LX” stars are in general bluer than the K-M stars in the Per sequence. Similarly, Fig. 5 shows the log count rate as a function of color. The “bad LX” stars clearly have lower count rates than cluster main sequence stars of comparable colors. Thus low count rate “bad LX stars” have properties distinct from cluster members in both near IR photometry (Fig. 3) and in X-rays.


3.2 Spectra
One of the most important parameters to examine for the cluster stars is the temperature derived from the X-ray spectra. In order to use temperature from a large number of sources, we have made 1 temperature fits of APEC models to the spectra with XSPEC software (ver 12.6). These temperatures are listed in Table 2. For low countrates, we did not fit spectra, and the temperature, emission measure, flux and luminosity columns in Table 2 are blank. These sources are omitted from figures. (Luminosities in Fig. 3 were derived as in section 3.1 assuming kT = 1 keV.) Fig. 6 shows the temperatures for the groups of stars as a function of the J-K color. The late M stars in Figs 4 and 5 are all too weak to have a reliable temperature determination. All groups (the F-G stars, the K-M stars and the bad LX stars) have a range to temperatures. However the mean X-ray temperature kT for the bad LX stars (0.57 keV) is lower than the mean for the other 2 groups (0.80 keV). Fig. 7 shows the X-ray temperature as a function of luminosity for all groups. The luminosity is computed on the assumption that all the stars are at the cluster distance. Both the F-G and K-M stars show a range of temperatures along with the well-known decrease in X-ray luminosity for the lower mass stars. These two groups exhibit minimal overlap in the figure and a large dispersion. The dotted line indicates the upper envelope of the bad LX stars, which do not in general reach the highest luminosities of the other groups.
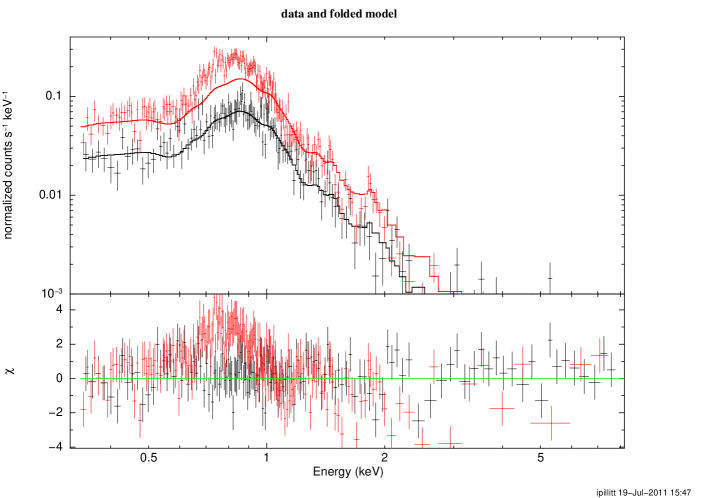
To illustrate the effects of different source temperatures, Fig. 8 shows the spectra of two strong sources, Src 68 and Src 36. Src. 36 is an F star (J = 9.2 mag) with a single temperature fit (Table 2) kT = 0.64. Src 68 has J = 10.11 mag, and kT = 0.9. The softer spectrum of Src 36 is clearly apparent in Fig. 8.
For about half the strong sources, the was satisfactory for a single temperature fit. For the other sources, Table 3 lists the temperatures for 2 temperature fits, together with the off-axis distance and source counts. Source counts include all 3 cameras (MOS1, MOS2, AND PN) taking into account the different effective areas of the 3 cameras. Fig. 9 shows the results. A correlation between the two temperatures is present, as found by Wolk, et al. (2005) and Briggs and Pye (2003). In order to investigate this relation as a function of age, Fig. 9 includes data from the 1-3 Myr Orion Nebula Cluster (ONC) COUP project (Wolk, et al. 2005), the 100 Myr Pleiades (Briggs and Pye 2003) and 30 Myr NGC 2547 (Jeffries, et al. 2006) as well as fits to XMM ONC sources (Table 4) to explore this with XMM and Chandra data. ONC Chandra data were taken from Wolk, et al. for the “characteristic flux” (their Table 4), omitting the data for the 4 stars flagged as poor fits. Their fit to that data (kT2 = 2.14 kT1 + 0.660 keV) is also included in Fig. 9. Data for the Pleiades were taken from the XMM observations of Briggs and Pye (2003), using the two temperatures from the PN (their Table 3), since only one source had determinations for several instruments, and they are all similar. 333Daniel, Linsky, and Gagne (2002) also fit Chandra spectra of several sources, but kT2 was fixed in their solutions. We also include 9 sources from the 30 Myr cluster NGC 2547 (Jeffries, et al. 2006). Data for NGC 2547 is taken from the 2 temperature fits in Jeffries, et al. (2006; their Table 5), omitting sources where kT2 is described as unconstrained in the fits. Sources which are late B stars (#7 and #8) were also omitted. However, their two temperatures match those of the cool stars very well, confirming that the X-rays from these sources come from a low-mass companion.
| Src | kT1 | kT2 | Off Ax | Cts |
| keV | keV | |||
| 4 | 0.18 | 0.88 | 12 | 289 |
| 36 | 0.5 | 0.86 | 8.1 | 7030 |
| 41 | 0.46 | 0.9 | 3.5 | 10200 |
| 52 | 0.24 | 0.98 | 1.8 | 3170 |
| 68 | 0.77 | 1.42 | 13 | 2100 |
| 74 | 0.81 | 1.48 | 13 | 2380 |
| 85 | 0.74 | 1.52 | 9 | 651 |
| 90 | 0.81 | 2.6 | 12 | 279 |
| 96 | 0.57 | 1.24 | 11 | 2520 |
| Obsid | Src | kT1 | kT2 |
|---|---|---|---|
| keV | keV | ||
| 0212480301 | 304 | 0.97 | 2.49 |
| 0093000101 | 281 | 0.78 | 1.86 |
| 0212480301 | 221 | 0.30 | 1.58 |
| 0212480301 | 237 | 0.51 | 1.33 |
| 0212480301 | 280 | 0.81 | 1.57 |
| 0093000101 | 281 | 0.78 | 1.86 |
| 0093000101 | 229 | 0.84 | 1.76 |
| 0093000101 | 200 | 0.73 | 1.86 |
| 0093000101 | 194 | 0.96 | 2.14 |
| 0093000101 | 196 | 0.25 | 1.30 |
| 0093000101 | 309 | 0.20 | 0.99 |
| 0093000101 | 132 | 1.04 | 3.71 |
| 0093000101 | 158 | 0.25 | 1.02 |

Fig. 9 shows that both the kT1 and kT2 temperatures are smaller on average for the 50 Myr Per stars than for the younger ONC stars (1-3 Myr; Megeath, et al. 2012). This is expected as a result of the decrease in stellar activity as stars age. (The single point for Per with kT2 2 is for a source which is both weak compared to the others and off axis, and hence has a significant systematic error in addition to the measurement error.) The Pleiades stars (100 Myr) fall among the Per stars, but the hottest of both kT1 and kT2 for Pleiades stars is cooler than those for the Per stars. Similarly, the NGC 2547 stars (30 Myr) largely overlap the Per stars. The lines at the bottom of Fig. 9 indicate the range of kT1 values ordered from the youngest cluster (ONC) to the oldest (the Pleiades). This shows the decrease in stellar activity as stars age. Once on the Zero Age Main Sequence (ZAMS), rotation and hence dynamo activity decreases as stars spin down. Jeffries et al. discuss activity at 30 Myr in NGC 2547 for G, K, and M stars. At this age, solar mass stars have just contracted to the ZAMS. They argue that coronal temperatures decrease up to this point as gravity increases. The decrease in the harder component in solar mass stars was previously noted by Güdel, Guinan, and Skinner (1997) and subsequently by Telleschi, et al. (2005)
There is a correlation between kT1 and kT2 in Fig. 9, particularly for Per and the ONC. There is a suggestion, however, that the relation for Per is less steep than for the ONC. That is, even for the same soft component temperature kT1, the hard component decreases as stars age. The Pleiades stars (100 Myr) cluster among the Per stars, although the coronae appear generally cooler than the Per sample and there appears to be much less differentiation among the individual stars, with 5 of the 8 being well described as kT1 = 0.35 0.050 keV and kT2 = 0.950 0.100 keV. Due to this clustering no slope can be determined for the Pleiades stars. In fact the concept may no longer be relevant at that age if the hot component is gone. Typically older cool stars have a corona that is dominated by a one-temperature cool plasma. If the cool component at 100 Myr has already reached this asymptotic minimum, then these stars may be best described merely a single temperature which is a function of time.
This discussion, of course, is produced from a sample for all clusters that is biased in the sense that the two temperature fits are only possible for the strongest X-ray sources. In addition, in the Per cluster, a number of strong sources are satisfactorily fit with one temperature. Furthermore, the samples from different clusters may contain a different distribution of spectral types, again creating possible bias.
3.3 X-ray Luminosity Distribution (XLD)
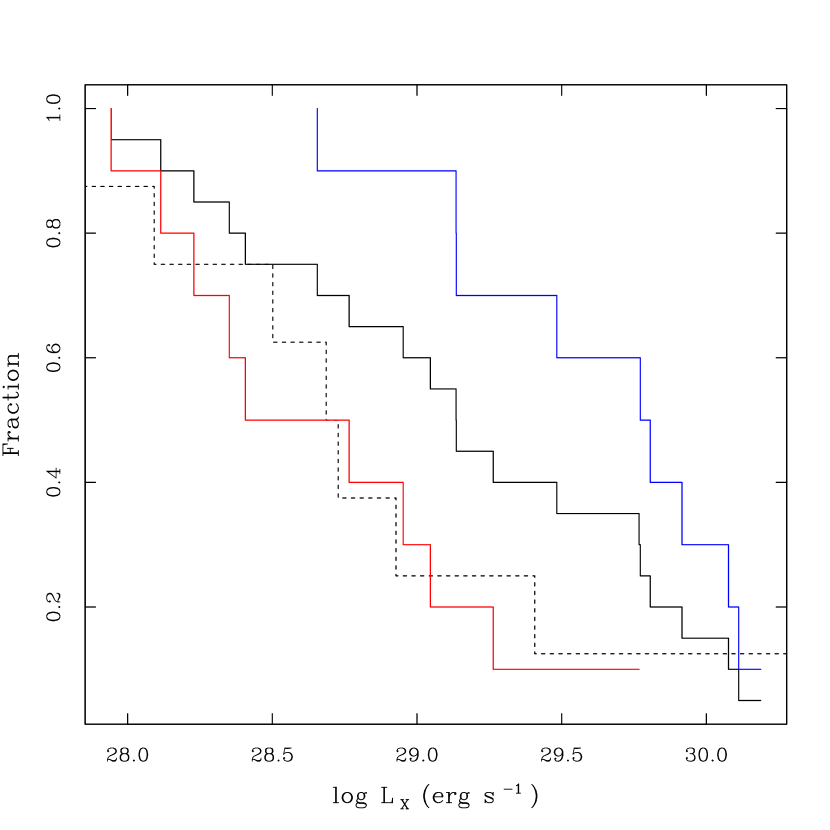
Although the XMM field covers only a small part of the Per cluster, the exposure is deeper than the ROSAT images. We derive an X-ray luminosity distribution (XLD) to compare with the ROSAT results for the full cluster area using the ASURV software package. As discussed in Sect. 2.2, there are two sequences. The brighter sequence is from the cluster itself. There is also a fainter sequence, corresponding to the “bad LX” stars, which will be discussed further in Section 4. The XLD is derived from the upper cluster sequence. Fig. 3 shows that it contains a natural divide in the J–(J-K)0 diagram, with a gap in both color and magnitude. The sources 32, 36, 41, 52, 65, 68, 71, 74, 85, and 96 in Table 2 belong to the earlier side of the low-mass main sequence stars (G-K stars). Others in that sequence are assigned to the cooler low-mass star group (M stars). The division in (J-K)0 comes at the end of the K dwarf color, so the first group contains F, G, and K stars. Since the number of sources in the part of the cluster we are sampling is small, we are not able to subdivide this group further. The cooler group contains M stars. Since we do not have have a list of authenticated faint cluster members, we do not have upper limits for nondetections of faint members. Fig. 10 provides the results. The luminosity distribution for the F, G, and K stars is similar to the results from Randich, et al. (1996) for the full cluster. For instance, the mean log LX from that study is 29.63 ergs sec-1 (F dwarfs), 29.74 ergs sec-1 (G dwarfs), and 29.56 ergs sec-1 (K dwarfs), comparable to the blue line in Fig. 10. For the M dwarfs, the deeper XMM data provide a distribution that continues more smoothly to lower luminosities than the Randich, et al. distribution which has a mean log LX if 28.96 ergs sec-1. For completeness, we derive an XLD for the “bad LX” distribution as though it were at the same distance as the cluster even though this is likely an incorrect assumption (see Section 4). Thus, the XMM results for the Per cluster are in agreement with the previous ROSAT results for the XLD for F, G, and K stars, but they extend the XLD to fainter sources for M stars. Fig. 10, for instance provides a basis for inferring the properties of possible low-mass companions of Cepheids (Evans, et al. 2012), necessary for calculating X-ray exposure times.
3.4 X-ray Time Variability
We have examined the light curves of the sources to look for time variability, since flares are expected at the young age of Persei cluster. However because most of the sources have relatively low counts and 60 ksec is a short interval, we discuss here only six bright sources that show possible variability in inspection by eye. Fig. 11 shows the PN light curves of these bright sources, all of which belong to the “cluster” sequence. Source 36 shows a smooth rise of about 1 level and a flare-like event at 43 ks. The flare has peak rate 50% larger than the pre-flare rate and a significance 2 . The duration is 3-4 ks. Other possible small flares are visible at about the 1 level. Sources 41, 68, and 96 are largely constant, with possible variability at the 1 level. Source 74 shows a possible sequence of flares, the first at 13ks with a duration of 8 ks and peak rate about 80% larger than minimum observed rate. Source 90 is interesting because it has a very low count-rate in the first half of the observation, then a slow increase and a steeper fall within 10 ks. The peak rate in this event is about 8 times the quiescent rate. In summary, in the brief window of the observation, several sources show evidence of low level variability, but only one has a significant flare.

4 Discussion: Bad LX Sources
We have used the deep XMM exposure of the Per cluster to sample the XLD of a section of the cluster. In particular we have added a sample of M stars to the previous work. This confirms that the distribution fits nicely between the youngest clusters (e.g. the Orion Nebula Cluster) and the older Pleiades.
An unusual feature of both the ROSAT and the XMM images of the cluster is the additional sequence, dubbed the “bad LX” stars by PRS. It was first identified in the ROSAT images, however it is clearly evident in the near IR color-magnitude data of the XMM X-ray sources (Fig. 3) as well. The simplest explanation is the geometric one, that the “bad LX” sequence comes from a more distant grouping behind the Per cluster. Interpreting Fig. 3 in this way, the sequence is 2.5 magnitudes fainter than the Per sequence as shown by the shifted isochrone in Fig. 3, which translates into a factor of 3 further in the distance, making it about 500 pc away. This ignores possible additional reddening at that distance. However, the faintest pair of stars in the “bad LX” sequence are in the late-K and M region where the main sequence in Fig. 3 is nearly vertical. Their (J-K)0 is not consistent with significant additional reddening as compared with the cluster sequence. The increase in the ‘bad LX” distance of 3 implies an addition of 1. to the log LX or log count rate. Fig. 5 provides a good check on this possibility. Even if the log count rate were adjusted by this amount, it would still fall a little below the Per sequence for the same J-K. This suggests that the grouping may also be a little older than the 50 Myr Per cluster. There is evidence for this in Fig. 6, in that the average kT (in the relevant J-K band) is a little smaller than for the Per stars with the same colors. Thus there is a suggestion in Fig. 6 that the “bad LX” stars may be slightly older than the Per stars. However there are only 8 stars and several parameters involved (distance, reddening, age/temperature) so this is not a conclusion, rather a possible interpretation of the available data. For a second comparison, in Fig. 10, if the estimated addition to the “bad LX” of 1. is subtracted from the log LX of the F-G-K stars of the cluster (blue line), it would be moved nearly to the log LX LXD (dotted line). It is not surprising from Fig. 3 that faint M stars are not detected at the distance of the “bad LX”, and hence the F-G-K stars (blue line) are the best comparison at that distance. While the small number of“bad LX” stars preclude firm conclusions, we at least offer a plausible interpretation of a group about the same age as the Per cluster or possibly a little older.
PRS remarked that the “bad LX” stars are frequently classified as nonmembers of the Per cluster on the basis of radial velocities. Of the 7 “bad LX” in their Table 4 with radial velocities, 5 are listed as nonmembers on the basis of radial velocities, and for the other two, the membership status is questionable.
There is one restriction on the distance of the “bad LX” stars, which is that they cover a large part of the Per area surveyed by PRS. That is, it cannot be so much further behind that it covers only a small fraction of Per cluster area, which is quite extended on the sky. However, Per cluster members have been found in ground-based studies in an area on the sky about twice as wide at the PRS ROSAT observations (Prosser 1992). Thus a grouping about twice as far away as the Per cluster is consistent with the spread of “bad LX” stars on the sky.
In summary, a grouping behind the Per cluster is a plausible explanation for the “bad LX” sequence. This interpretation is key to deriving a XLD appropriate for the 50 Myr stars in the Per cluster itself.
5 Summary
We have investigated an archival XMM-Newton image of part of the Per cluster, partly because the age of this cluster makes it appropriate for comparison with low-mass companions of Cepheids. In particular, this data adds observations of X-ray faint M stars to the wider but shallower observations of the whole cluster area by ROSAT. The count rate sequence for the M stars continues the sequence for hotter dwarfs in both J magnitude and J–K color. XLD’s have been derived for both the hotter dwarfs, and also the M stars. The “bad LX” sequence identified by PRS is appears to be a background grouping at a distance of about 500 pc and an age similar (or slightly older) than the Per cluster, as shown by near IR magnitudes and colors, as well as X-ray luminosities and temperatures.
References
- Ayres (2011) Ayres, T. R. 2011, ApJ, 738, 120
- Briggs Pye (2003) Briggs, K. R. and Pye, J. P. 2003, M. N. R. A. S., 345, 714
- Cutri etal (2003) Cutri, R. M., Skrutskie, M. F., van Dyk, S., et al. 2003 VizieR Online Data Catalog 2246, 0
- (4) Damiani, F., Maggio, A., Micela, G., and Sciortino, S. 1997a ApJ, 483, 350
- (5) Damiani, F., Maggio, A., Micela, G., and Sciortino, S. 1997b ApJ, 483, 370
- Daniel etal (2002) Daniel, K. J., Linsky, J. L. and Gagné, M. 2002, ApJ, 578, 486
- Deacon and Hambly (2004) Deacon, N. R. and Hambly, N. C. 2004, A&A, 416, 125
- Evans, et al. (2012) Evans, N. R., Tingle, E., Bond, H. E., Schaefer, G., Karovska, M., Mason, B., DePasquale, J., Pillitteri, I., Wolk, S., Guinan, E., and Engle, S. 2012, AAS 219, #444.
- Favata and Micela (2003) Favata, F. and Micela, G. 2003, SpSci Rev. 108, 577.
- Guedel etal (1997) Güdel, M., Guinan, E. F., and Skinner, S. L. 1997, ApJ. 483, 947
- Guedel (2004) Güdel, M. 2004, AApRv, 12, 71
- Jeffries, et al (2006) Jeffries, R. D., Evans, P. A., Pye, J. P., and Briggs, K. R. 2006, MNRAS, 367, 781
- Lodieu, et al (2012) Lodieu, N. Deacon, N. R., Hambly, N. C., and Boudreault, S. 2012, MNRAS, in press (astro-ph 1207.6978)
- Megeath etal (12) Megeath, S. T. et al. 2012, arXiv:1209.3826)
- Meynet etal (93) Meynet, G., Mermilliod, J.-C., and Maeder, A. 1993, A&AS, 98, 477
- Pallavicini etal (2004) Pallavicini, R., Francioscini, E., and Randich, S. 2004, Mem S. A. It., 75, 434
- Pillitteri etal (2004) Pillitteri, I., Micela, G., Sciortino, S., Damiani, F., and Harnden, F. R. 2004, A&A, 421, 175
- Prosser (1992) Prosser, C. F. 1992, AJ, 103, 488
- Prosser etal (1996) Prosser, C. F., Randich, S., Stauffer, J. R., Schmitt, J. H. M. M., and Simon, T. 1996, AJ, 112, 1570
- Prosser Randich (1998) Prosser, C. F., and Randich, S. 1998, AN, 319, 201 (PRS)
- Prosser Randich Simon (1998) Prosser, C. F., Randich, S., and Simon, T. 1998, AN, 319, 215
- Randich etal (1996) Randich, S., Schmitt, J. H. M. M., Prosser, C. F., and Stauffer, J. R. 1996, A&A, 305, 785
- Siess etal (2000) Siess, L., Dufour, E., and Forestini, M. 2000 A&A, 358, 593
- Stauffer etal (1999) Stauffer, J. R., Barrado y Navascues, D., Bouvier, J., Morrison, H. L., Harding, P., Luhman, K. L., Stanke, T., McCaughrean, M., Terndrup, D. M., Allen, L., and Assouad, P. 1999, ApJ, 527, 219
- telleschi etal (2005) Telleschi, A., Guedel, M., Briggs, K., Audard, M., Ness, J.-U., and Skinner, S. L. 2005, ApJ, 622, 653.
- wolk etal (2005) Wolk, S. J., Harnden, F. R., Flaccomio, E., Micela, G., Favata, F., Shang, H., and Feigelson, E. D. 2005, ApJS, 160, 423
| ID | R.A. | Dec. | Offaxis | Significance | Rate | Exp. Time |
|---|---|---|---|---|---|---|
| (J2000) | (J2000) | ′ | ct ks-1 | ks | ||
| 1 | 03:26:37.9 | 48:37:28.9 | 15. | 15.7 | 5.55 | 48.3 |
| 2 | 03:25:43.7 | 48:38:32.4 | 14. | 7.76 | 1.63 | 50.7 |
| 3 | 03:26:43.6 | 48:38:47.7 | 14. | 6.75 | 1.66 | 57.3 |
| 4 | 03:26:01.3 | 48:39:10.1 | 12. | 21.7 | 4.83 | 59.9 |
| 5 | 03:25:50.9 | 48:39:22.2 | 13. | 29.4 | 7.41 | 57.4 |
| 6 | 03:25:53.0 | 48:40:30.2 | 11. | 23.6 | 5.10 | 65.1 |
| 7 | 03:25:37.7 | 48:41:43.5 | 11. | 14.8 | 2.79 | 63.7 |
| 8 | 03:26:54.5 | 48:42:17.0 | 12. | 5.31 | 0.423 | 72.5 |
| 9 | 03:25:54.7 | 48:42:28.4 | 9.4 | 7.77 | 1.48 | 78.0 |
| 10 | 03:26:14.3 | 48:42:39.6 | 9.0 | 33.6 | 6.19 | 87.3 |
| 11 | 03:26:59.1 | 48:42:45.1 | 12. | 60.4 | 16.5 | 73.9 |
| 12 | 03:26:24.1 | 48:42:46.3 | 9.2 | 9.78 | 1.35 | 88.1 |
| 13 | 03:26:41.3 | 48:43:18.9 | 10. | 8.97 | 1.59 | 87.5 |
| 14 | 03:26:34.0 | 48:43:44.8 | 9.0 | 6.56 | 1.05 | 92.5 |
| 15 | 03:26:45.5 | 48:43:46.0 | 10. | 20.9 | 3.34 | 77.4 |
| 16 | 03:26:41.5 | 48:43:56.6 | 9.5 | 5.43 | 0.459 | 91.3 |
| 17 | 03:25:29.8 | 48:44:00.1 | 9.8 | 5.89 | 1.18 | 68.8 |
| 18 | 03:26:18.4 | 48:44:06.8 | 7.7 | 4.90 | 0.396 | 98.5 |
| 19 | 03:26:22.6 | 48:44:20.2 | 7.7 | 5.95 | 0.435 | 103. |
| 20 | 03:26:01.7 | 48:44:35.7 | 7.1 | 11.0 | 1.03 | 99.9 |
| 21 | 03:26:12.3 | 48:44:37.2 | 7.0 | 6.29 | 0.512 | 98.1 |
| 22 | 03:26:52.7 | 48:44:38.3 | 10. | 5.96 | 0.512 | 89.6 |
| 23 | 03:27:16.4 | 48:44:43.2 | 13. | 13.0 | 2.85 | 69.8 |
| 24 | 03:26:47.2 | 48:45:14.9 | 9.1 | 5.13 | 0.562 | 96.0 |
| 25 | 03:25:47.2 | 48:45:15.7 | 7.2 | 6.32 | 0.809 | 88.4 |
| 26 | 03:26:41.4 | 48:45:23.3 | 8.4 | 6.94 | 0.773 | 103. |
| 27 | 03:25:56.5 | 48:45:40.6 | 6.2 | 5.34 | 0.399 | 105. |
| 28 | 03:25:13.8 | 48:45:56.4 | 10. | 5.52 | 1.27 | 56.2 |
| 29 | 03:25:27.2 | 48:46:03.6 | 8.6 | 15.1 | 1.45 | 74.3 |
| 30 | 03:27:05.5 | 48:46:20.4 | 11 | 11.9 | 2.22 | 86.8 |
| 31 | 03:25:26.3 | 48:46:28.9 | 8.5 | 6.38 | 0.483 | 75.7 |
| 32 | 03:26:40.8 | 48:46:38.7 | 7.4 | 24.2 | 4.84 | 55.7 |
| 33 | 03:25:23.0 | 48:46:58.3 | 8.7 | 10.5 | 1.23 | 71.4 |
| 34 | 03:27:02.8 | 48:47:07.7 | 10. | 33.0 | 6.97 | 93.4 |
| 35 | 03:25:32.0 | 48:47:24.2 | 7.2 | 11.0 | 1.39 | 59.6 |
| 36 | 03:26:50.2 | 48:47:33.3 | 8.1 | 182. | 63.3 | 111. |
| 37 | 03:26:53.8 | 48:47:34.4 | 8.6 | 11.2 | 0.99 | 108. |
| 38 | 03:26:11.1 | 48:47:45.8 | 3.9 | 7.64 | 0.512 | 131. |
| 39 | 03:27:09.3 | 48:47:48.2 | 11. | 9.50 | 1.71 | 84.7 |
| 40 | 03:25:35.9 | 48:48:05.7 | 6.3 | 6.23 | 0.521 | 96.1 |
| 41 | 03:26:04.2 | 48:48:08.5 | 3.5 | 224. | 78.7 | 129. |
| 42 | 03:24:58.9 | 48:48:12.8 | 12. | 94.7 | 48.1 | 52.7 |
| 43 | 03:27:16.7 | 48:48:39.9 | 12. | 6.89 | 0.861 | 82.1 |
| 44 | 03:25:54.4 | 48:48:49.2 | 3.5 | 6.36 | 0.571 | 119. |
| 45 | 03:26:32.9 | 48:48:52.0 | 5.0 | 6.41 | 0.355 | 136. |
| 46 | 03:27:10.9 | 48:49:00.3 | 11. | 9.67 | 0.888 | 90.4 |
| 47 | 03:26:30.1 | 48:49:22.2 | 4.3 | 8.51 | 0.527 | 140 |
| 48 | 03:25:07.1 | 48:49:25.4 | 10. | 15.4 | 3.26 | 52.4 |
| 49 | 03:27:22.6 | 48:50:06.5 | 12. | 27.3 | 6.26 | 77.0 |
| 50 | 03:25:56.8 | 48:50:15.6 | 2.2 | 5.12 | 0.212 | 132 |
| 51 | 03:27:02.5 | 48:50:21.4 | 9.2 | 11.5 | 1.44 | 79.9 |
| 52 | 03:26:16.4 | 48:50:29.6 | 1.8 | 117. | 21.3 | 149 |
| 53 | 03:25:40.5 | 48:50:41.9 | 4.5 | 11.8 | 2.19 | 84.1 |
| 54 | 03:26:50.3 | 48:50:49.6 | 7.1 | 14.2 | 1.73 | 103. |
| 55 | 03:27:07.8 | 48:50:57.2 | 10. | 7.97 | 1.20 | 97.2 |
| 56 | 03:24:55.6 | 48:51:00.1 | 12. | 7.16 | 1.94 | 52.6 |
| 57 | 03:25:53.4 | 48:51:03.5 | 2.4 | 5.91 | 0.512 | 128. |
| 58 | 03:26:00.8 | 48:51:30.9 | 1.1 | 5.44 | 0.506 | 88.7 |
| 59 | 03:25:24.2 | 48:51:42.3 | 7.1 | 8.19 | 0.768 | 85.2 |
| 60 | 03:27:02.3 | 48:51:55.3 | 9.0 | 10.0 | 1.35 | 105. |
| 61 | 03:25:19.7 | 48:51:57.0 | 7.9 | 6.87 | 0.687 | 78.5 |
| 62 | 03:27:39.6 | 48:51:56.7 | 15. | 6.78 | 1.12 | 23.6 |
| 63 | 03:25:51.0 | 48:52:06.0 | 2.8 | 7.18 | 0.65 | 124. |
| 64 | 03:26:03.3 | 48:52:07.9 | 0.86 | 5.86 | 0.586 | 139. |
| 65 | 03:25:12.4 | 48:52:07.6 | 9.1 | 15.2 | 3.56 | 70.2 |
| 66 | 03:27:14.1 | 48:52:14.8 | 11. | 6.53 | 0.559 | 86.6 |
| 67 | 03:26:41.3 | 48:52:17.3 | 5.6 | 16.9 | 1.62 | 133. |
| 68 | 03:24:50.0 | 48:52:18.6 | 13. | 80.6 | 57.8 | 36.4 |
| 69 | 03:26:02.8 | 48:52:59.9 | 1.6 | 5.47 | 0.305 | 136. |
| 70 | 03:24:59.4 | 48:53:01.0 | 11. | 47.5 | 26.1 | 32.4 |
| 71 | 03:27:05.0 | 48:53:05.1 | 9.6 | 8.74 | 0.936 | 95.5 |
| 72 | 03:27:07.3 | 48:53:19.1 | 10. | 15.9 | 2.06 | 94.9 |
| 73 | 03:25:31.3 | 48:53:21.5 | 6.2 | 23.1 | 3.35 | 92.9 |
| 74 | 03:24:48.3 | 48:53:20.9 | 13. | 90.6 | 85.4 | 27.9 |
| 75 | 03:27:11.3 | 48:54:01.5 | 11. | 8.36 | 0.759 | 88.2 |
| 76 | 03:26:47.4 | 48:54:10.7 | 7.1 | 6.92 | 0.637 | 119. |
| 77 | 03:25:45.9 | 48:54:11.8 | 4.4 | 5.97 | 0.541 | 111. |
| 78 | 03:26:44.1 | 48:54:11.8 | 6.6 | 17.9 | 1.90 | 108. |
| 79 | 03:26:00.9 | 48:54:17.4 | 2.9 | 10.8 | 1.26 | 128. |
| 80 | 03:26:44.1 | 48:54:23.5 | 6.6 | 9.13 | 0.848 | 111. |
| 81 | 03:26:33.2 | 48:55:42.2 | 5.9 | 5.87 | 0.488 | 123. |
| 82 | 03:25:36.2 | 48:55:59.1 | 6.8 | 10.8 | 1.38 | 90.1 |
| 83 | 03:25:39.4 | 48:56:30.3 | 6.7 | 5.35 | 0.594 | 91.4 |
| 84 | 03:26:31.5 | 48:57:20.0 | 7.0 | 15.2 | 1.68 | 105. |
| 85 | 03:25:28.6 | 48:57:53.0 | 9.0 | 37.8 | 8.82 | 73.8 |
| 86 | 03:27:25.0 | 48:58:12.5 | 14. | 20.6 | 5.32 | 27.4 |
| 87 | 03:25:28.7 | 48:58:14.3 | 9.2 | 7.49 | 0.862 | 72.2 |
| 88 | 03:25:51.5 | 48:58:53.7 | 7.8 | 29.8 | 4.88 | 87.4 |
| 89 | 03:26:55.9 | 48:58:57.3 | 11. | 20.4 | 3.77 | 69.8 |
| 90 | 03:25:10.3 | 48:59:44.0 | 12. | 20.9 | 7.98 | 34.9 |
| 91 | 03:25:39.0 | 48:59:57.1 | 9.6 | 5.37 | 0.308 | 72.4 |
| 92 | 03:26:06.0 | 49:00:07.0 | 8.5 | 21.3 | 3.24 | 86.5 |
| 93 | 03:26:54.7 | 49:01:12.8 | 12. | 5.52 | 0.545 | 70.7 |
| 94 | 03:26:40.1 | 49:01:36.6 | 11. | 5.46 | 0.522 | 74.7 |
| 95 | 03:25:51.5 | 49:02:07.6 | 11. | 7.80 | 1.43 | 45.1 |
| 96 | 03:26:27.7 | 49:02:13.5 | 11. | 101. | 35.1 | 71.9 |
| 97 | 03:25:48.2 | 49:02:40.4 | 12. | 5.74 | 0.625 | 23.9 |
| 98 | 03:26:39.8 | 49:02:47.8 | 12. | 14.3 | 3.37 | 66.9 |
| 99 | 03:26:32.2 | 49:03:13.5 | 12. | 24.6 | 5.31 | 60.8 |
| 100 | 03:26:23.4 | 49:04:16.4 | 13. | 6.47 | 1.60 | 13.9 |
| 101 | 03:26:01.9 | 49:04:42.3 | 13. | 14.9 | 5.41 | 22.9 |
| 102 | 03:26:26.3 | 49:04:54.7 | 14. | 6.26 | 3.12 | 12.9 |
| ID | R.A. | Dec. | 2MASS ID | J | H | K | kT | E.M. | ||
|---|---|---|---|---|---|---|---|---|---|---|
| (J2000) | (J2000) | mag | mag | mag | keV | cm-3 | erg s-1 cm-2 | erg s-1 | ||
| 4 | 03:26:01.3 | 48:39:09.7 | 03260131+4839097 | 12.60 | 11.92 | 11.69 | 0.76 | 51.73 | -13.8 | 28.8 |
| 10 | 03:26:14.2 | 48:42:38.3 | 03261419+4842382 | 12.48 | 11.80 | 11.55 | 0.89 | 51.92 | -13.6 | 29.0 |
| 19 | 03:26:22.7 | 48:44:20.1 | 03262270+4844201 | 12.77 | 12.31 | 12.12 | 0.86 | 50.65 | -14.9 | 27.7 |
| 22 | 03:26:52.6 | 48:44:37.9 | 03265263+4844378 | 11.10 | 10.77 | 10.76 | 0.88 | 51.06 | -14.4 | 28.1 |
| 42 | 03:24:58.8 | 48:48:14.7 | 03245884+4848147 | 16.47 | 15.69 | 14.52 | – | – | – | – |
| 33 | 03:25:23.0 | 48:46:56.2 | 03252295+4846562 | 13.64 | 13.04 | 12.78 | 0.81 | 51.24 | -14.3 | 28.2 |
| 35 | 03:25:31.8 | 48:47:21.4 | 03253182+4847213 | 13.80 | 13.18 | 12.98 | 0.81 | 51.38 | -14.1 | 28.4 |
| 25 | 03:25:47.2 | 48:45:13.6 | 03254715+4845136 | 13.31 | 12.87 | 12.72 | 0.18 | 53.95 | -11.9 | 30.7 |
| 27 | 03:25:56.6 | 48:45:38.1 | 03255664+4845381 | 15.65 | 14.90 | 14.67 | – | – | – | – |
| 41 | 03:26:04.2 | 48:48:07.1 | 03260421+4848070 | 9.49 | 9.21 | 9.16 | 0.64 | 53.17 | -12.4 | 30.2 |
| 38 | 03:26:11.1 | 48:47:45.0 | 03261110+4847450 | 15.02 | 14.37 | 14.04 | – | – | – | – |
| 32 | 03:26:40.8 | 48:46:36.8 | 03264075+4846368 | 8.76 | 8.58 | 8.57 | 0.47 | 52.18 | -13.4 | 29.1 |
| 26 | 03:26:41.2 | 48:45:21.0 | 03264121+4845210 | 14.6 | 13.86 | 13.67 | – | – | – | – |
| 36 | 03:26:50.1 | 48:47:32.1 | 03265010+4847320 | 9.20 | 9.01 | 8.89 | 0.64 | 53.10 | -12.4 | 30.1 |
| 39 | 03:27:09.4 | 48:47:49.2 | 03270936+4847491 | 12.03 | 11.63 | 11.56 | 0.53 | 52.62 | -13.1 | 29.4 |
| 30 | 03:27:05.7 | 48:46:20.1 | 03270565+4846201 | 16.70 | 16.05 | 16.33 | – | – | – | – |
| 68 | 03:24:49.7 | 48:52:18.4 | 03244971+4852183 | 10.11 | 9.72 | 9.59 | 0.90 | 52.89 | -12.6 | 29.9 |
| 48 | 03:25:07.2 | 48:49:26.0 | 03250721+4849260 | 13.12 | 12.4 | 12.20 | – | – | – | – |
| 65 | 03:25:12.3 | 48:52:05.3 | 03251232+4852052 | 9.77 | 9.56 | 9.47 | 0.53 | 51.69 | -13.9 | 28.7 |
| 59 | 03:25:24.3 | 48:51:40.8 | 03252428+4851407 | 12.38 | 12.02 | 11.92 | 0.34 | 52.07 | -13.6 | 28.9 |
| 63 | 03:25:50.7 | 48:52:05.3 | 03255074+4852052 | 13.20 | 12.72 | 12.59 | 0.54 | 51.69 | -13.9 | 28.7 |
| 58 | 03:26:01.0 | 48:51:30.9 | 03260103+4851309 | 15.37 | 14.97 | 14.59 | – | – | – | – |
| 47 | 03:26:30.0 | 48:49:20.9 | 03262999+4849209 | 14.08 | 13.49 | 13.22 | 0.73 | 50.92 | -14.6 | 27.9 |
| 52 | 03:26:16.4 | 48:50:28.4 | 03261639+4850284 | 10.81 | 10.32 | 10.21 | 0.77 | 52.45 | -13.1 | 29.5 |
| 67 | 03:26:41.3 | 48:52:16.1 | 03264130+4852160 | 11.83 | 11.54 | 11.44 | 0.65 | 51.71 | -13.8 | 28.7 |
| 51 | 03:27:02.4 | 48:50:19.4 | 03270241+4850193 | 13.18 | 12.56 | 12.30 | 0.58 | 51.14 | -14.4 | 28.1 |
| 62 | 03:27:39.6 | 48:51:54.0 | 03273962+4851539 | 12.13 | 11.72 | 11.60 | 0.60 | 51.49 | -14.0 | 28.5 |
| 74 | 03:24:48.4 | 48:53:19.9 | 03244838+4853199 | 10.08 | 9.55 | 9.42 | 0.96 | 53.06 | -12.5 | 30.1 |
| 82 | 03:25:36.1 | 48:55:57.4 | 03253612+4855573 | 13.52 | 12.93 | 12.57 | 0.82 | 51.32 | -14.2 | 28.4 |
| 77 | 03:25:46.0 | 48:54:10.0 | 03254597+4854100 | 15.95 | 15.21 | 14.99 | – | – | – | – |
| 69 | 03:26:02.8 | 48:52:59.2 | 03260275+4852591 | 16.26 | 15.64 | 15.12 | – | – | – | – |
| 71 | 03:27:05.1 | 48:53:04.5 | 03270505+4853044 | 10.57 | 9.981 | 9.78 | 0.97 | 51.40 | -12.7 | 29.8 |
| 75 | 03:27:11.2 | 48:53:60.0 | 03271116+4853599 | 14.62 | 13.87 | 13.67 | – | – | – | – |
| 90 | 03:25:10.4 | 48:59:45.4 | 03251041+4859453 | 12.59 | 12.01 | 11.75 | 1.01 | 52.25 | -13.3 | 29.3 |
| 85 | 03:25:28.7 | 48:57:51.5 | 03252866+4857515 | 11.43 | 10.98 | 10.84 | 0.96 | 52.11 | -13.4 | 29.1 |
| 87 | 03:25:28.9 | 48:58:14.3 | 03252893+4858143 | 14.53 | 13.99 | 13.88 | – | – | – | – |
| 86 | 03:27:24.9 | 48:58:11.9 | 03272491+4858118 | 13.53 | 12.88 | 12.62 | 0.97 | 52.03 | -13.5 | 29.0 |
| 92 | 03:26:06.0 | 49:00:06.4 | 03260595+4900064 | 15.64 | 14.79 | 14.44 | 34 | 52.58 | -12.8 | 29.8 |
| 96 | 03:26:27.6 | 49:02:12.4 | 03262764+4902123 | 10.77 | 10.26 | 10.11 | 0.94 | 52.75 | -12.8 | 29.8 |