VLBI observations of the shortest orbital period black hole binary, MAXI J1659152
Abstract
The X-ray transient MAXI J1659152 was discovered by Swift/BAT and it was initially identified as a GRB. Soon its Galactic origin and binary nature were established. There exists a wealth of multi-wavelength monitoring data for this source, providing a great coverage of the full X-ray transition in this candidate black hole binary system. We obtained two epochs of European VLBI Network (EVN) electronic-VLBI (e-VLBI) and four epochs of Very Long Baseline Array (VLBA) data of MAXI J1659152 which show evidence for outflow in the early phases. The overall source properties (polarization, milliarcsecond-scale radio structure, flat radio spectrum) are described well with the presence of a compact jet in the system through the transition from the hard-intermediate to the soft X-ray spectral state. The apparent dependence of source size and the radio core position on the observed flux density (luminosity dependent core shift) support this interpretation as well. We see no evidence for major discrete ejecta during the outburst. For the source proper motion we derive 2 upper limits of 115 as/day in right ascension, and 37 as/day in declination, over a time baseline of 12 days. These correspond to velocities of 1400 km/s and 440 km/s, respectively, assuming a source distance of 7 kpc.
keywords:
ISM: jets and outflows – X-rays: binaries – stars: individual (MAXI J1659152).1 Introduction
Galactic black hole X-ray binaries (BHXRB) are key to understanding the power sources of accreting compact objects and the physical processes of accretion and jet formation. A great number of these systems have been identified as transient X-ray sources, and sometimes they are referred to as microquasars (Mirabel et al., 1992; Mirabel & Rodríguez, 1994), owing to their ability to produce collimated, highly relativistic ejecta analogous to those powered by supermassive black holes in the centres of active galactic nuclei (AGN). There are two types of jets in BHXRBs: compact, synchrotron self-absorbed jets that are typical of the canonical hard spectral state (e.g. Stirling et al., 2001; Dhawan et al., 2000), and transient ejecta during X-ray state transitions from the hard state to the soft state, crossing a region in the X-ray luminosity vs. X-ray hardness space often referred to as the “jet-line” (Fender et al., 2004, 2009). Whether there is a universal jet-line region for all BHXRB, what its boundaries are, and most importantly, what the underlying physics is, remain a matter of debate111A recent result shows that the location of the jet line may vary from outburst to outburst in a single object (Miller-Jones et al., 2012). Most notably, we point out that high angular resolution observations on milliarcsecond (mas) scales have rarely been available in the past, although there has been an increasing number of VLBI observations in the past 5 years, thanks in part to the more flexible, real-time e-VLBI operations of the EVN (see e.g. Tudose et al., 2007). Using the e-VLBI technique with the EVN to observe transients has the advantage of the quick turnaround time, providing more efficient ways to schedule follow-up EVN and/or VLBA observations, as previously demonstrated for various types of transients (Miller-Jones et al., 2010; Paragi et al., 2010a; Moldon, Ribó & Paredes, 2011; Yang et al., 2011). The rapid feedback is important for a better understanding of the evolution of the mas-scale source properties early on during the outburst event (especially for transients with no firm identification at their discovery). It also gives the opportunity, as we demonstrate in this paper, to test observing strategies and look for closer VLBI calibrators for targets with less favourable locations, such as low-declination (∘) sources for the EVN. The focus of this paper is a new BHXRB, which benefited from both.
On 2010 September 25 Swift/BAT discovered a new transient, which was initially identified as a gamma-ray burst and was designated as GRB 100925A (Mangano et al., 2010). The MAXI/GSC team detected a hard X-ray transient positionally coincident with this GRB candidate, and catalogued it as MAXI J1659152 (Negoro et al., 2010). Soon it became clear from optical spectroscopy by the ESO/VLT X-shooter that the transient showed broad emission and absorption lines at zero redshift, indicating that the source was likely a Galactic X-ray binary (de Ugarte Postigo, 2010). The source followed an evolutionary track on the X-ray hardness-intensity diagram (HID) and also had variability/timing properties typical of BHXRBs, in particular type-B and type-C quasi-periodic oscillations (QPO) (Kalamkar et al., 2011). The X-ray lightcurves from Swift, XMM-Newton and RXTE showed irregularly shaped dips that recurred with a period of 2.4 hours, making the source the shortest orbital period Galactic black hole binary candidate known (Kuulkers et al., 2012; Kennea et al., 2011). The two groups that reported these results also showed that the companion star is most likely an M5 dwarf, and that the system is likely located at a distance of 7 kpc (but see Sect. 4.1). In addition, using the scaling relation between the spectral index and the QPO frequency, the mass of the BH is estimated to be M⊙ (Shaposhnikov et al., 2012). If this estimate is correct, then MAXI J1659152 would be the most massive stellar black hole known in the Galaxy.
The apparent high distance from the Galactic plane ( kpc) makes MAXI J1659152 a good candidate for being a “runaway microquasar” (Yamaoka et al., 2012; Kuulkers et al., 2013), which received a large kick velocity during the formation of the black hole in the system. With high resolution VLBI observations one could in principle measure the proper motion even during a single outburst, as was demonstrated by Mirabel et al. (2001) in case of XTE J1118+480. The claimed mass of M⊙ for MAXI J1659152 (Shaposhnikov et al., 2012) is incompatible with the runaway microquasar scenario, therefore constraining the proper motion with VLBI is particularly interesting in this case. However, for rapidly evolving outbursts, the short timescales can make such a measurement quite challenging.
Just 1.5 days after the initial trigger, MAXI J1659152 was detected at the 5 mJy level at 5 GHz with the Westerbork Synthesis Radio Telescope (WSRT) (van der Horst et al., 2010a). This was rapidly followed by a series of EVN e-VLBI (Paragi et al., 2010b) and VLBA target of opportunity observations at 5 GHz. This paper summarizes the results of all the VLBI observations. We describe the initial e-VLBI experiment with the selection of secondary calibrators, and the follow-up EVN and VLBA observations in Sect. 2. Data reduction and results will be presented in Sect. 3. The compact jet model, as a framework for the interpretation of the mas-scale structure is presented in Sect. 4. In Sect. 5. we compare the mas-scale properties of MAXI J1659152 to those of other BHXRBs with similar evolution on an X-ray hardness-intensity diagram. Conclusions will be drawn in Sect. 6.
2 Observational strategy and secondary calibrator selection
The first observation of MAXI J1659152 was carried out on 2010 September 30 with the EVN at 5 GHz in realtime e-VLBI mode with the EVN MkIV Data Processor (“e-EVN”; experiment code RP016A). After the initial clock-searching and setup checking, the project started at 13:00 UT and lasted 5.5 hours. The participating telescopes were Effelsberg, Medicina, Onsala, Toruń, the phased array Westerbork Synthesis Radio Telescope (WSRT), Jodrell Bank (MkII), Cambridge and Hartebeesthoek. The data rate per telescope was 1024 Mbps, except for Medicina, Hartebeesthoek (both 896 Mbps) and Cambridge (128 Mbps, limited by the MERLIN microwave link to Jodrell Bank). We used 2-bit sampling and observed both left and right circular polarizations. The target was phase-referenced to the nearby calibrator J17071415 (2.2 degrees away), selected from the VLBA Calibrator list222http://www.vlba.nrao.edu/astro/calib/index.shtml. The coordinates used for correlation of the phase reference source were (J2000)=17:07:20.390556 ( mas) and (J2000)=14:15:23.12829 ( mas).
Because of the low declination of the field, the source elevations were low, especially for the EVN: the maximum elevation for most EVN telescopes was around 20 degrees, and it was below 20∘ at some telescopes for a significant fraction of the observing time. This limits the accuracy of determining the interferometer phase for the target using calibrator measurements. The coherence time is shorter, and systematic errors due to small deviations from the correlator delay model result in errors in the astrometry, as well as decreasing the fidelity of the final image. At the frequency of our observations, tropospheric and ionospheric phase errors have comparable effect on the data, however at low elevations the tropospheric errors will likely dominate. Both at the EVN and the VLBA correlators the tropospheric delays are determined from a zenith value which is then mapped to lower elevations. A small error in the tropospheric zenith delay, imperfections in the mapping function itself, or inhomogeneities in the troposphere will lead to a significant differential phase error between the calibrator and the target close to the horizon. This results in correlation amplitude losses, degraded image fidelity, and poor astrometry. The closer the reference source, the smaller the differential phase errors between the reference and the target fields.
Therefore we looked for additional radio sources closer to MAXI J1659152. Unfortunately, this field is not covered by the VLA B-array FIRST survey (Becker, White & Helfand, 1995), which is an excellent resource to look for potential secondary calibrators for VLBI observations (Frey et al., 2008). Instead, we selected 8 radio sources from the VLA D-array NVSS survey (Condon et al., 1998) that were located within half a degree of the target and had total flux densities exceeding 10 mJy. These were cross-checked against our 5 GHz WSRT data (from ongoing total flux density monitoring). One target, NVSS J170003.28145622.9 (hereafter J17001456) had a nearly flat spectrum. We included this source in the EVN observing schedule to verify its compact structure on milliarcsecond scales. The phase referencing cycle was 90s on J17071415 and 150s on MAXI J1659152. Approximately every 16 minutes we also observed the secondary calibrator J17001456. Additional calibrators OQ208, J1724-1443, J1751+0939 and J1310+3220 were observed for a short time to check amplitude calibration of the EVN; 3C286 was included for calibrating the WSRT synthesis array data recorded parallel to the VLBI observations. After the successful detection of both the transient and J17001456 (see Sect. 3.) we carried out further VLBI observations, all at 5 GHz. However, in the case of J17001456 we quickly updated the coordinates because they were found to be in error by about one arcsecond, which is a significant fraction of the WSRT phased-array beam at 5 GHz. The second epoch was observed with the VLBA (BV070A) on October 2. The VLBA data were recorded at the telescopes at a recording rate of 512 Mbps, in dual-polarization mode using 2-bit sampling, and were correlated with DiFX (Deller et al., 2011). The third epoch was observed with the e-EVN on October 4 (RP016B), with a similar setup to the first experiment but adding the 40m Yebes telescope to the array. Because MAXI J1659152 was still detectable with very long baselines (Paragi et al., 2010b), additional VLBA observations were organized (BV070B-D) on 2010 October 6, 14 and 19, until the transient faded below the detection threshold of our WSRT monitoring. The time between observing epochs was set based on the initial e-EVN results and the X-ray spectral and timing properties as observed by RXTE.


| Array | Date | MJD | peak | noise | Major | Minor | PA | Radius | ||
|---|---|---|---|---|---|---|---|---|---|---|
| mJy/b | mJy/b | mas | mas | deg. | mJy | mas | K | |||
| EVN | 30.09.2010 | 55469.7 | 6.24 | 0.052 | 20.70 | 9.67 | 9.55 | 7.31 | 5.3 | 1.4 |
| 1.88 | 13.0 | 0.1 | ||||||||
| 0.46 | 2.0 | 0.6 | ||||||||
| VLBA | 02.10.2010 | 55472.0 | 3.92 | 0.060 | 6.45 | 2.15 | 14.6 | 6.25 | 2.4 | 6.0 |
| 1.58 | 6.1 | 0.2 | ||||||||
| 0.99 | 4.7 | 0.2 | ||||||||
| EVN | 04.10.2010 | 55473.7 | 2.45 | 0.062 | 14.00 | 6.58 | 11.4 | 2.72 | 1.1 | 12.5 |
| VLBA | 06.10.2010 | 55474.0 | 0.87 | 0.057 | 4.28 | 1.71 | 1.9 | 1.07 | 1.0 | 5.9 |
| VLBA | 14.10.2010 | 55484.0 | 0.40 | 0.056 | 4.25 | 1.70 | 2.64 | 0.45 | ||
| VLBA | 19.10.2010 | 55489.0 | 0.30 | 0.057 | N/A | N/A | N/A | 0.30 | N/A | N/A |
3 Data reduction and results
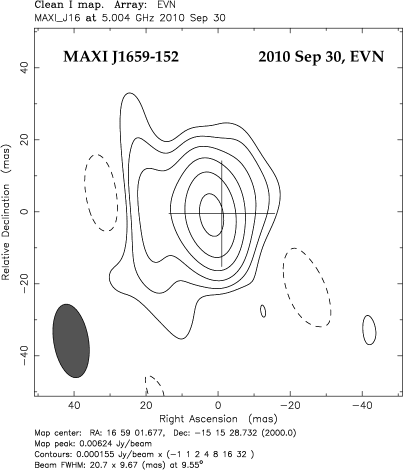
The EVN and the VLBA data were reduced according to the standard procedures outlined in the EVN Data Analysis Guide333http://www.evlbi.org/user_guide/guide/userguide.html and the AIPS Cookbook444http://www.aips.nrao.edu/CookHTML/CookBook.html, respectively. After the initial amplitude calibration, parallactic angle correction (EVN) and Earth Orientation Parameter correction (VLBA), the data were fringe-fitted in AIPS. At the first three epochs, when MAXI J1659152 was still brighter than 1 mJy, we also looked for polarized emission in the VLBI data. We performed cross-hand fringe-fitting on a bright calibrator to remove the inter-channel R–L delay and phase offsets at the reference antenna. For the EVN data we used OQ208, whereas for the first epoch VLBA dataset we used NRAO530. We then imaged and self-calibrated OQ208 in Difmap (Shepherd et al., 1994), and the self-calibrated OQ208 data were used to determine the antenna polarization leakage terms with LPCAL in AIPS (for both the EVN and VLBA data). The phases of both the science target and the secondary calibrator were phase-referenced to J17071415. The secondary calibrator, J17001456, was imaged and self-calibrated in Difmap. This source has resolved structure on a scale of a few mas (see Fig. 1). In the higher resolution VLBA data, the average position of the maximum brightness peak in the brighter, South-Western component is (J2000)=17:00:03.333340 and (J2000)=14:56:21.97584. The statistical error from the four measurements is 170 as in right ascension and 250 as in declination. Accounting for the positional error of the primary phase-reference source, this increases to 320 as and 560 as, respectively.
The image was imported back into AIPS where phase solutions were derived with CALIB using a solution interval of 30 minutes, and applied to the target. This step helped to improve the image fidelity of the target, as well as the astrometric precision of the results. Note that we used the highest quality VLBA map to self-calibrate all epochs, except for the first epoch EVN data because the accurate coordinates of J17001456 were not known during the correlation of the first experiment, therefore exact alignment of the VLBA and the first epoch EVN phase-centers is not possible below the mas level. Choosing a 30 minute solution interval ensured that we corrected for a smoothly changing residual phase resulting from the imperfect troposphere model, rather than short timescale phase fluctuations. In the case of the EVN, we did not solve for Cambridge and Hartebeesthoek because they had low signal-to-noise ratios on J17001456. In addition, at the first epoch the secondary calibrator phase errors were higher than expected for the WSRT, likely because the a priori position had an error of about an arcsecond, which is a significant fraction of the phased-array WSRT beam. In that case the WSRT phases (only) were self-calibrated on the target, which had a comparable total flux density to the secondary calibrator at the first epoch. This additional phase self-calibration, using a 30 minute solution interval, did not significantly affect the final result. The final images of the target were made in Difmap, with no further self-calibration at the other epochs.
In the following discussion we utilize the fact that MAXI J1659-152 had a flat spectrum during the first two EVN epochs. As part of a broadband monitoring campaign, the source was observed with the Karl G. Jansky Very Large Array (VLA) at multiple frequencies on 2010 September 29 and October 1. On the former date the flux density was mJy at 4.9 GHz and mJy at 8.5 GHz, while on the latter date those were mJy and mJy, respectively. The resulting spectral indices are and , consistent with an index of 0. We note that there are no significant detections of polarization at those epochs, with upper limits of a few percent on the degree of polarization. Further details on the VLA data analysis can be found in van der Horst et al. (in preparation).
3.1 Results
The resulting VLBI maps are shown in Fig. 2, and the map parameters and modelfit results are listed in Table 1. At the first epoch on 2010 September 30 the source is well resolved, as also clearly evidenced by the decreasing visibility amplitude with increasing baseline length seen in the -data, especially on the most sensitive baselines that include either Effelsberg or Westerbork. Fitting a single elliptical Gaussian model component to the -data gives a total flux density of 8.7 mJy and a characteristic size of 8 mas (well exceeding the uniformly weighted beamsize including all baselines), elongated at 132 degrees (measured from North through East). Analyzing the Westerbork synthesis array data taken during the VLBI observations, the total flux density of MAXI J1659152 was 9.8 mJy, i.e. the single component contains most of the flux density from the target. To recover all of the WSRT total flux density, three model components were fitted to the data (see Table 1). Note that the naturally weighted EVN images shown in Fig. 2 do not include the baselines to Hartebeesthoek, for better reconstruction of the extended emission. The uniformly weighted image including Hartebeesthoek data suggests there is extension to the South-East on mas scales, in agreement with the modelfit results. This image contains a total cleaned flux density of 6.3 mJy. The naturally weighted image on the other hand has a total cleaned flux density of 9.6 mJy, recovering practically all of the integrated flux density. It shows an extension roughly to the East up to 20 mas. It is hard to judge from these data alone whether the apparent extension to the West-North-West is real or not, but this feature agrees in orientation with the major axis PA of the fitted elliptical Gaussian component.
The higher resolution VLBA image on October 2 shows a partially resolved central component containing 6.3 mJy. Fitting a single elliptical Gaussian component resulted in a major axis of 115 degrees, close to the single-component fit EVN value. There is extended emission on both sides of the source roughly in this direction. This extended emission is only detected on the shortest spacings. But since it does not disappear even with further point source model phase self-calibration, and the overall structure is similar to the EVN result, we conclude that the extended emission is likely real. The source was therefore fitted with three circular Gaussian components, with a total flux density of 8.8 mJy. By the second EVN observation, on October 4, the total flux density of MAXI J1659152 had decreased to 2.95 mJy according to our WSRT measurement. We fitted a circular Gaussian brightness distribution model directly to the -data. The entire integrated flux density was recovered this way in a single component (consistent with the WSRT value within the errors), with a radius of 1.1 mas. MAXI J1659152 was detected in two more VLBA observations. Although the source looks compact in the images from epochs 3 and 4, the source was still resolved according to our modelfit results (see Table 1). At the fifth epoch the fitted Gaussian component size was smaller than the theoretical resolution limit of our array, therefore we consider the minimum resolvable angular size as an upper limit (see Lobanov, 2005). MAXI J1659152 faded below the detection level of 300 Jy/beam (5) on 2010 October 19.
No polarized emission was detected at any of these epochs. The first EVN epoch, with the highest peak in total intensity and lowest noise in polarized intensity, provides the strongest constraint. The 150 Jy/beam upper limit (5) in polarized intensity corresponds to a 2.5% upper limit in fractional polarization.
Using the higher resolution VLBA data, the derived average position for MAXI J1659152 is (J2000)=16:59:01.676891 and (J2000)=15:15:28.73237. The error in declination is 220 as, consistent with the measured errors in the secondary reference source position. In right ascension the error is much larger, 690 as. The peak in the (lower resolution) first epoch EVN map is about 2 mas East of the average position. This is unusual since due to calibration errors at low elevations, one expects to see larger errors in declination than in right ascension (cf. Yang et al., 2012). Therefore, this is likely the sign of a source structural effect. The October 4 EVN position is within the 2 error. The total errors in and , including the uncertainty in the primary phase-reference source position, are 740 as and 550 as, respectively.

4 Discussion
4.1 A compact jet in MAXI J1659152?
The images in Fig. 2 clearly show resolved or partially resolved structures at the first three epochs, indicative of an outflow. The maximum brightness temperatures resulting from fitting circular Gaussian components to the -data at each epoch range from K (see Table 1.). These high brightness temperatures, together with the observed flat radio spectrum (see Sect. 3), are indicative of optically thick synchrotron radiation, which is also consistent with the observed low fractional polarization (2.5%). An optically thick synchrotron spectrum may originate in partially self-absorbed compact jets (for details see Appendix). In fact, such partially self-absorbed compact jets have been resolved with VLBI in the BHXRB candidate SS433 (Paragi et al., 1999), and the confirmed BHXRB systems GRS1915+105 (Dhawan et al., 2000) and Cyg X-1 (Stirling et al., 2001). Various other observational evidence points to the fact that in general, BHXRBs produce compact jets in the canonical hard X-ray state (Fender et al., 2004, 2009). Our highest resolution data do not show a resolved core-jet structure, but the images from the first two epochs clearly show extensions roughly to the East and to the North-West, that may be related to an outflow. The model-fitting results are also consistent with an elongated structure in a similar direction. One explanation for the overall fuzzy appearance of the ‘core’ could be angular broadening of the images due to interstellar scattering. Definitive evidence for scatter-broadening would be multi-frequency measurements that showed a dependence of the observed source size. However, the nearby secondary calibrator source J17001456 showed no evidence for scatter-broadening.
We have two other pieces of circumstantial evidence for supporting the self-absorbed jet nature for the bulk of the radio emission. Curiously, MAXI J1659152 appeared to be the most compact at the last detection on 2010 October 14, when the total flux density was less than 1 mJy. At earlier epochs (and especially with the larger EVN beam) a larger overall source size was measured because of the extended emission (outflow). The radius of maximum brightness temperature, and consequently the measured size of the compact jet region, depends on the radio luminosity (Blandford & Königl, 1979). The measured size values from Table 1, are plotted in the left panel of Fig. 5 as a function of flux density. While the scatter is significant, there seems to be a trend of increasing angular size with increasing flux density, as expected for compact jets. The different array configurations of the EVN and VLBA observations probably affect the size measurements, so we cannot compare the size-flux dependence with model predictions. The important point here is that changes in total jet power or bulk Lorentz factor will change the source flux as well as apparent size: initially the source brightens and grows, but as the flare fades it shrinks – this is not expected in cases where the radio emission is related to discrete ejecta or a shell of matter that was ejected from the system.
A strong dependence of size with flux density was previously found in another microquasar, Cyg X-3 (Newell et al., 1998). In that case the authors claimed to have observed superluminal expansion and contraction on timescales of hours. Another similarity is that while a collimated radio jet is clearly present during outbursts of Cyg X-3 (e.g. Mioduszewski et al., 2001), the optically thick base morphologically does not resemble a core-jet structure. Instead, it looks like the ‘fuzzy’ core of MAXI J1659152. In the case of Cyg X-3, the scatter-broadening effect is well established, with a scattering disk size of 18 mas at 5 GHz (Mioduszewski et al., 2001). However, the explanation of scattering is inconsistent with the small size we measured in the last epoch. This same argument (i.e. the measured source size being smaller than the scattering size) could also imply that Newell et al. (1998) may not have measured actual physical sizes, thereby weakening the claim for apparent superluminal expansion in Cyg X-3 (Mioduszewski et al., 2001). In the case of MAXI J1659152, a scattering screen, if present, must be well localized at the target position because scatter-broadening is not observed in the nearby calibrators.


Besides the apparent correlation between the source core flux density and its size, we compare the dependence of the apparent core position with the variable core size, because in compact jets these are intimately related. In Fig. 3 we show the intensity profile for a simple compact jet model (see Appendix). The observed radio core position as well as its apparent size change with observing frequency. This is because at different frequencies the optical depth is different; an effect known as the frequency dependent core-shift in AGN (Lobanov, 1998). The true position of the black hole is not easy to determine with high accuracy. Hada et al. (2011) used multi-frequency observations to pinpoint the location of the jet base in M87, and they concluded that the supermassive black hole is within 14–23 Schwarzschild radii of the 43 GHz radio core (a projected angular separation of 41 as). The only similar measurement for Galactic microquasars was made in SS433. Paragi et al. (1999) used the well-established kinematic model of the ballistically moving, optically thin jet components to locate the binary system in between the approaching and receding sides of the optically thick radio core components. The separation between the binary system and the observed radio core position decreased with increasing frequency, i.e. they observed the frequency dependent core-shift in a Galactic microquasar.
Because we observed MAXI J1659152 at a single frequency, we cannot probe the frequency dependent core shift. However, any change of optical depth during an outburst (due to e.g. an increase in relativistic particle number density and/or an increase in the magnetic field strength) will result in a similar effect when we compare core positions and sizes at various epochs at a single frequency. This will result in a larger separation of the observed peak radio emission and the compact object, and at the same time a larger observed size for the compact jet. This effect can be probed with VLBI at a single frequency, even if, as mentioned above, the core shift, , cannot be measured in most cases. By simply scaling our model with the initial optical depth, we find that is roughly proportional to the FWHM of the jet profile, , in which case the difference of peak positions will be proportional to the difference of the measured core sizes between the various epochs. In Fig. 4 we plot the relative peak positions of MAXI J1659152. Note the apparent positions in right ascension continuously drift from roughly East towards the West at the various epochs, indicating either proper motion or varying source structure. Because the first epoch map clearly shows an extension to the East, it is plausible that we see a shrinking compact jet as the source flux density decreases. In the right panel of Fig. 5 we plot the difference in core position versus difference in core size, with respect to the first epoch. The data show a smooth change in source size along with a smooth change in core (more precisely, compact jet peak) position in a way that is compatible with the expected relation between and for compact jets. Monitoring VLBI observations of similar transients at multiple frequencies can potentially confirm these effects: the core size and position change with luminosity ( luminosity dependent core-shift), as well as with observing frequency (frequency dependent core shift, shown in Fig. 3).
On the other hand, one may interpret the positional change as source proper motion. Here we take a conservative approach. Because the first epoch was clearly affected by source structure and the time baseline is very short, we give a 2 upper limit of 1380 as in right ascension and 440 as in declination; in twelve days (epochs 2–5), these correspond to proper motion upper limits of as/day and as/day555We note that in order to minimize the structural effects in right ascension, one could use the last two VLBA detections to constrain the proper motion in right ascension, when the source was most compact. Although the time baseline is somewhat shorter (9 days), the measured statistical errors in right ascension for the secondary calibrator are also smaller. Using these we would arrive at a very similar proper motion constraint in right ascension as in declination.. To convert these to velocities, we have to know the source distance, which is not strongly constrained, as is typically the case for X-ray transients. Based on the relation between optical outburst amplitude and the orbital period in similar systems (Shahbaz & Kuulkers, 1998), Kuulkers et al. (2012) estimated a distance of 7 kpc for MAXI J1659-152. As pointed out by Miller-Jones et al. (2011), this does not take into account the effect of orbital inclination to the line of sight; at high inclinations the observed brightness of the disc would be underestimated, and consequently, the derived distance would be an overestimate. In a subsequent paper, Kuulkers et al. (2013) derived an updated distance of 8.63.7 kpc, using the original amplitude-period relation. Correcting for the inclination angle of the orbit, the distance would be lowered to 7.1 kpc at , and 4.0 kpc for . The corresponding heights above the Galactic plane are kpc, kpc and kpc, respectively (Kuulkers et al., 2013). Our VLBI images do not show a highly beamed source structure, with a very compact core and one-sided ejection, and they do not show symmetric double-sided ejecta in the plane of the sky either. Assuming that the jets are perpendicular to the accretion disk, this would mean that the orbit of the binary is likely moderately inclined to the line of sight, preferring the 7 kpc value. Finally, by carefully taking into account various arguments, Jonker et al. (2012) estimated a source distance of kpc, although this error bar may be underestimated given the number of assumptions involved.
Assuming a distance of 7 kpc, our proper motion constraints correspond to upper limits on the space velocity of 1400 km s-1 in right ascension and 440 km s-1 in declination. In the high inclination angle case (corresponding to a distance of 4 kpc), these numbers would change to 800 km s-1 and 250 km s-1, respectively. These values are not particularly constraining, since there are no measured black hole kicks as large as 1400 km s-1. Yamaoka et al. (2012) argued that MAXI J1659152 is a runaway microquasar, just like XTE J1118+480, which has a velocity of 145 km s-1 with respect to the Local Standard of Rest (Mirabel et al., 2001). Kuulkers et al. (2013) concluded that this was a likely scenario for MAXI J1659152 because shorter period (less massive) systems should have the highest runaway velocities; this scenario would also explain the large distance from the Galactic plane. Our twelve day time baseline was too short to significantly constrain the velocity. With the accurate coordinates measured during this outburst, future VLBI observations in the next activity cycle will give an accurate space velocity measurement for MAXI J1659152. For future X-ray transients with a more prolonged flaring activity, it will be possible to use this method to probe the runaway microquasar scenario if the transient is within a few kpc. Further improvement on the positional accuracy can be obtained if one can find a secondary calibrator closer to the target, especially one within the primary beam of the telescopes. But as we have seen in here, varying source structure will likely be a limiting factor in most cases.
4.2 X-ray properties and radio structure
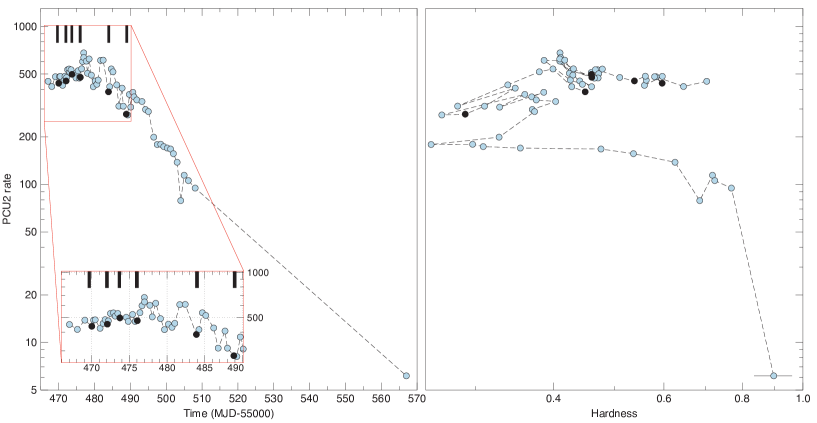
The observed radio structure of MAXI J1659152 is consistent with a compact jet, which is typical for the canonical hard state of BHXRBs. We will now consider the X-ray properties of the transient. The RXTE lightcurve and HID (615 keV/26 keV) are shown in Fig. 6; black points show measurements closest to the VLBI epochs. The source already left the canonical hard state and was in the hard intermediate state (HIMS) by the time of the first EVN epoch. The presence of a compact jet in the HIMS state is not unprecedented; Cyg X-1 is known to show a compact jet in this state. During the evolution to the soft intermediate state (SIMS), radio quenching was reported from MAXI J1659152 on October 8 (van der Horst et al., 2010b) and type-B QPOs appeared on October 12 (Munoz-Darias et al., 2011), which are usually followed by relativistic jet ejections. Note that radio quenching and subsequent bright, discrete ejecta are typical of BHXRBs during their transition to the soft state. However, while our measurements confirm the radio quenching, we do not see discrete ejecta in MAXI J1659152. Instead, the source simply faded below our detection limit. Because of the relatively rapid cadence (2 days) of our observations during the radio bright state of the source, and because no other flaring events were reported from total flux density monitoring campaigns, it is quite unlikely that we missed an ejection event. We note also that our final VLBA observation was taken when the source was in its softest X-ray state (see Fig. 6), and by that time the RXTE count rate was well into its decay phase, therefore we do not expect significant radio flaring after this time. The lack of ejecta may indicate that MAXI J1659152 underwent a failed transition. However, as was shown by Munoz-Darias et al. (2011), the X-ray state transition was fully completed, according to the well established criteria: the total rms variability went down to almost 1%, unlike H1743322. It is true however that the soft state in MAXI J1659152 was very short-lived and appeared significantly harder than that in most BHXRBs. Munoz-Darias et al. (2011) proposed that this may be due to the high inclination of the system, in which case we see less of the soft disc emission while the emission from the spherical, non-thermal corona should be largely inclination independent. A similar lack of bright, transient ejecta was reported for the transition of Cyg X-1 to the soft state in 2010 June (Rushton et al., 2012). However, Cyg X-1 is also peculiar in that it has a non-canonical soft state (significantly higher fractional rms variability than typical transient BHXRB outbursts). VLBI observations of many more transient events are necessary to draw general conclusions about the formation of transient ejecta, whether they appear in all soft-state transitions, and where exactly the ‘jet-line’ is located in the hardness-intensity diagram (which may vary from system to system, and even within a given system; Miller-Jones et al., 2012).
Jonker et al. (2012) discuss the well-known radio–X-ray correlation in BHXRBs (e.g. Corbel et al., 2003; Gallo et al., 2003; Jonker et al., 2004). During the canonical hard state, the observed correlation is ; more recently it has been shown that a number of systems follow a much steeper correlation with (Coriat et al., 2011; Gallo et al., 2012). At the beginning of its outburst, while the luminosity was in excess of erg s-1, Jonker et al. (2012) found MAXI J1659-152 to follow the steeper correlation, but to be significantly more radio luminous at a given X-ray luminosity than the rest of the sources on the steeper correlation track. To explain this discrepancy, they proposed that the source either falls on the outlier branch, but with suppressed X-ray luminosity owing to the high inclination, or that the radio emission was possibly dominated by optically thin ejecta at early times, increasing the average radio luminosity. In contrast, in figure 9 of Corbel et al. (2013), MAXI J1659-152 does not appear to be significantly radio overluminous for the steeper correlation track. A re-examination of the original data of Jonker et al. (2012) revealed a discrepancy in the assumed distance of H1743-322, the single source that best defines the steeper correlation track (Coriat et al., 2011). Assuming instead the accepted distance of 8 kpc for H1743-322, MAXI J1659-152 would no longer appear significantly radio overluminous (P. Jonker, priv. comm.). However, this does not address an additional motivation for the possibility of optically-thin radio flares namely the reported detection of a high level of linear polarisation from a preliminary analysis of WSRT data (van der Horst et al., 2010a). Reanalysis of these WSRT data however showed no significant linear polarization (see Sect. 3), in agreement with our VLBI results, which show no evidence for optically thin ejecta. The small observed physical size, the flat spectrum, the lack of significant proper motion and the low linear polarization suggest that the radio emission was dominated by a compact jet.
5 Conclusions
We presented a series of VLBI (realtime e-VLBI at the EVN plus VLBA) monitoring results for the BHXRB candidate MAXI J1659152. The VLBI maps show evidence for an outflow on a scale of 10-mas. The compact jet scenario fits the data well: the low polarization, flat spectrum as well as the observed source size and luminosity dependent core shift all support this interpretation. During the full phase transition from the HIMS through the SIMS to the soft state, we do not see evidence for the luminous, discrete ejecta that are typical for BHXRBs in this state, possibly indicating that the outflow rate was not sufficient to form powerful shocks, as seen in the case of Cyg X-1. As Yamaoka et al. (2012) and Kuulkers et al. (2013) pointed out, MAXI J1659152 could potentially be a runaway microquasar. Further VLBI observations during another outburst will be necessary to measure the proper motion of the system with high accuracy. With the method presented here, it should be possible to provide useful constraints on black hole transient proper motions even during a single outburst if the outburst lasts long enough. The runaway microquasar hypothesis could then be tested.
Acknowledgments
We thank the anonymous referee for the constructive comments, which helped to improve our paper significantly. ZP thanks to Andrei Lobanov for discussions about the compact jet model. e-VLBI research infrastructure in Europe is supported by the European Union’s Seventh Framework Programme (FP7/2007-2013) under grant agreement RI-261525 NEXPReS. The EVN is a joint facility of European, Chinese, South African and other radio astronomy institutes funded by their national research councils. The WSRT is operated by ASTRON (Netherlands Institute for Radio Astronomy) with support from the Netherlands foundation for Scientific Research. The National Radio Astronomy Observatory is a facility of the National Science Foundation operated under cooperative agreement by Associated Universities, Inc. This work made use of the Swinburne University of Technology software correlator, developed as part of the Australian Major National Research Facilities Programme and operated under license. The research leading to these results has received funding from the European Community’s Seventh Framework Programme (FP7/2007-2013) under grant agreement ITN 215212.
References
- Becker, White & Helfand (1995) Becker R.H., White, R.L., Helfand, 1995, ApJ, 450, 559
- Blandford & Königl (1979) Blandford R.D., Königl A., 1979, ApJ, 232, 34
- Blandford & Rees (1974) Blandford R.D., Rees M.J., 1974, MNRAS, 169, 395
- Condon et al. (1998) Condon J.J. et al., 1998, AJ, 115, 1693
- Corbel et al. (2003) Corbel S., Nowak M.A., Fender R.P., Tzioumis A.K., Markoff S., 2003, A&A, 400, 1007
- Corbel et al. (2013) Corbel S., Coriat M., Brocksopp C., Tzioumis A.K., Fender R.P., Tomsick J.A., Buxton M.M., Bailyn C.D., 2013, MNRAS, 428, 2500
- Coriat et al. (2011) Coriat M., Corbel S., Prat L. et al., 2011, IAU Symp., 275, 255
- Deller et al. (2011) Deller A.T., Brisken W.F., Phillips C.J., Morgan J., Alef W., Cappallo R., Middelberg E., Romney J., Rottmann H., Tingay S.J., Wayth R., 2011, PASP, 123, 275
- de Ugarte Postigo (2010) de Ugarte Postigo A., Flores H., Wiersema K., Thoene C.C., Fynbo J.P.U., Goldoni P., 2010, GCN Circ., 11307
- Dhawan et al. (2000) Dhawan V., Mirabel I.F., Rodriǵuez L.F., 2000, ApJ, 543, 373
- Fender et al. (2004) Fender R.P., Belloni T.M., Gallo E., 2004, MNRAS, 355, 1105
- Fender et al. (2009) Fender R.P., Homan J., Belloni T.M., 2009, MNRAS, 396, 1370
- Frey et al. (2008) Frey S., Gurvits L.I., Paragi Z., Mosoni L., Garrett M.A., Garrington S.T., 2008, A&A, 477, 781
- Gallo et al. (2003) Gallo E., Fender R.P., Pooley G.G., 2003, MNRAS, 344, 60
- Gallo et al. (2012) Gallo E., Miller B., Fender R.P., 2012, MNRAS, 423, 590
- Georganopoulos & Marscher (1996) Georganopoulos M., Marscher A.P., 1996, Emission From the Inner Jet of Blazars. In: Energy Transport in Radio Galaxies and Quasars, Hardee P.E., Bridle A.H., Zensus J.A. (eds.), ASP Conference Series, vol. 100, 67
- Hada et al. (2011) Hada K., Doi A., Kino M., Nagai H., Hagiwara Y., Kawaguchi N., 2011, Nature, 477, 185
- Hjellming & Han (1995) Hjellming R.M., Han X., 1995, Radio properties of X-ray binaries. In: X-ray Binaries, Lewin W.H.G., van Paradijs J., van den Heuvel E.P.J. (eds.), Cambridge Astrophysics Series, Vol. 26, 326
- Hjellming & Jonston (1988) Hjellming R.M., Johnston K.J., 1988, ApJ, 328, 600
- Jonker et al. (2004) Jonker P.G., Gallo E., Dhawan V. et al., 2004, MNRAS, 351, 1359
- Jonker et al. (2012) Jonker P.G., Miller-Jones J.C.A., Homan J. et al., 2012, MNRAS, 423, 3308
- Kalamkar et al. (2011) Kalamkar M., Homan J., Altamirano D., van der Klis M., Casella P., Linares. M., 2011, ApJ, 731, L2
- Kennea et al. (2011) Kennea J.A., Romano P., Mangano V. et al., 2011, ApJ, 736, 22
- Königl (1981) Königl A., 1981, ApJ, 243, 700
- Kuulkers et al. (2012) Kuulkers E., Kouveliotou C., van der Horst, A.J. et al., 2012, in The First Year of MAXI: Monitoring variable X-ray sources — 4th International MAXI Workshop, T. Mihara, M. Serino (eds), IPCR CR-127, p.81
- Kuulkers et al. (2013) Kuulkers E., Kouveliotou C., Belloni T. et al., 2013, A&A, 552, A32
- Lobanov (1998) Lobanov A.P., 1998, A&A, 330, 79
- Lobanov (2005) Lobanov A.P., arXiv:astro-ph/0503225
- Mangano et al. (2010) Mangano V., Hoversten E.A., Markwardt C.B., Sbarufatti B., Starling R.L.C., Ukwatta T.N., 2010, GCN Circ., 11296
- Miller-Jones et al. (2010) Miller-Jones J.C.A., Sivakoff G.R., Altamirano D. et al., 2010, ApJ, 716, L109
- Miller-Jones et al. (2011) Miller-Jones J.C.A., Madej O.K., Jonker P.G. et al., 2011, Astron. Telegram, 3358
- Miller-Jones et al. (2012) Miller-Jones J.C.A., Sivakoff G.R., Altamirano D. et al., 2012, MNRAS, 421, 468
- Mioduszewski et al. (2001) Mioduszewski A.J., Rupen M.P., Hjellming R.M., Pooley G.G., Waltman E.B., 2001, ApJ, 553, 766
- Mirabel et al. (1992) Mirabel I.F., Rodríguez L.F., Cordier B., Paul J., Lebrun F., 1992, Nature, 358, 215
- Mirabel & Rodríguez (1994) Mirabel I.F. and Rodríguez L.F., 1994, Nature, 371, 46
- Mirabel et al. (2001) Mirabel I.F., Dhawan, V., Mignani, R. P., Rodrigues, I., Guglielmetti, F., 2001, Nature, 413, 139
- Moldon, Ribó & Paredes (2011) Moldon J., Ribó, M., Paredes J.M., 2011, A&A, 533,L7
- Munoz-Darias et al. (2011) Muñoz-Darias T., Motta S., Stiele H., Belloni T.M., 2011, MNRAS, 415,292
- Negoro et al. (2010) Negoro H., Yamaoka K., Nakahira S. et al., 2010, Astron. Telegram, 2873
- Newell et al. (1998) Newell S.J., Garrett M.A., Spencer R.E., 1998, MNRAS, 293, L17
- Paragi et al. (1999) Paragi Z., Vermeulen R.C., Fejes I., Schilizzi R.T., Spencer R.E., Stirling A.M., 1999, A&A, 348, 910
- Paragi et al. (2010a) Paragi Z., Taylor G.B., Kouveliotou C. et al., 2010a, Nature, 463, 516
- Paragi et al. (2010b) Paragi Z., van der Horst A.J., Granot J. et al., 2010b, Astron. Telegram, 2906
- Rybicki & Lightman (1979) Rybicki G.B., Lightman A.P., 1979, Radiative processes in astrophysics, Wiley-Interscience, New York
- Rushton et al. (2012) Rushton A., Miller-Jones J.C.A., Campana R., Evangelista Y., Paragi Z., Maccarone T.J., Pooley G.G., Tudose V., Fender R.P., Spencer R.E., Dhawan V., 2012, MNRAS, 419, 3194
- Shahbaz & Kuulkers (1998) Shahbaz T., Kuulkers E., 1998, MNRAS, 295, L1
- Shaposhnikov et al. (2012) Shaposhnikov N., Swank J.H., Markwardt C., Krimm H., 2012, in The First Year of MAXI: Monitoring variable X-ray sources — 4th International MAXI Workshop, T. Mihara, M. Serino (eds), IPCR CR-127, p.51
- Shepherd et al. (1994) Shepherd M.C., Pearson, T.J., Taylor, G.B., 1994, BAAS, 26, 987
- Stirling et al. (2001) Stirling A.M., Spencer R.E., de la Force C.J., Garrett M.A., Fender R.P., Ogley R.N., 2001, MNRAS, 327, 1273
- Tudose et al. (2007) Tudose V., Fender R.P., Garrett M.A., Miller-Jones J.C.A., Paragi Z. Spencer R.E., Pooley G.G., van der Klis M., Szomoru A., 2007, MNRAS, 375, L11
- van der Horst et al. (2010a) van der Horst A.J., Granot J., Paragi Z., Kouveliotou C., Wijers R.A.M., Ramirez-Ruiz E., 2010a, Astron. Telegram, 2874
- van der Horst et al. (2010b) van der Horst A.J., Linford J.D., Taylor G., Paragi Z., Lundgren A., de Ugarte Postigo A., Belloni T.M., Kuulkers E., Granot J., Kouveliotou C., Wijers R.A.M., Garrett M.A., 2010b, Astron. Telegram, 2918
- Yamaoka et al. (2012) Yamaoka, K., Allured, R., Kaaret, P. et al., 2011, PASJ, 64, 32
- Yang et al. (2011) Yang J., Paragi Z., Corbel S., Gurvits L.I., Campbell R.M., Brocksopp C., 2011, MNRAS, 418, L25
- Yang et al. (2012) Yang, J., Xu, Y.-H., Li, Z.-X., Paragi, Z., Campbell, R.M., Gurvits, L., Shen, Z.-Q., Hong, X.-Y., Xia, B., 2012, MNRAS, 426, L66
Appendix A Compact jet model
A conical jet model to describe the intensity profile of the radio jets in the galactic XRB SS433 was developed by Hjellming & Jonston (1988), hereafter HJ88. Here we follow HJ88, but instead of the large-scale jet we will concentrate on the properties of the optically thick inner core, also taking into account more general considerations for the variation of magnetic field with distance, as done for case of AGN jet models (see below). Let us assume a conical and freely expanding jet with radius proportional to the distance to the central engine. Synchrotron radiation is emitted by electrons moving in a tangled magnetic field with average strength . We assume that the energy spectrum of the radiating electrons – filling the entire volume of the jet – has a power-law form, , where is the energy spectral index, which is generally thought to be 2 ( will be considered in the present paper). The optically thin spectrum of the source will have a spectral index (; e.g. Rybicki & Lightman (1979)). The magnetic field and the particle density are assumed to depend on as and ; for a conical geometry, can vary between 1 and 2 (Blandford & Rees, 1974). If and , the energy density of the magnetic field and the kinetic energy density of the electrons are in equipartition at any along the flow (Blandford & Königl, 1979). All quantities determined below are expressed in the emitting frame of the fluid.
The optical depth to synchrotron radiation through the jet axis can be written as (cf. Lobanov, 1998)
| (1) |
where and . For the equipartition values of and , independent of the energy spectral index. In this case the optical depth scales as and the location of the radio core is inversely proportional to the observing frequency (Blandford & Königl, 1979). The actual value of the constant depends on the selection of and , the jet inclination to the line of sight (assumed to be constant).
Following HJ88, the contribution to the flux density of a portion of the jet of length can be written
| (2) |
where is the geometrical correction function for conical jets and , , … constants are given by Hjellming & Han (1995). The actual value of the constant is determined by the opening angle of the flow, the magnetic field strength and number density of electrons, etc., at a reference distance . Note that Eq. (2) and Eq. (1) are more general than that given originally by HJ88, since and are not fixed. These values, together with the energy spectral index – through – determine the shape of the jet intensity profile (see Fig. 3).
The jet intensity first rises sharply with and reaches its maximum at (at a given frequency). Within a few its flux density will decrease significantly. One can also determine the brightness variation in the core with frequency. The optically thick limit of the integrated flux density from Eq. (2) gives (Königl, 1981)
| (3) |
While the peak of the jet intensity profile is roughly proportional to the frequency, the integrated spectrum of the core remains flat or slightly inverted, as typically observed in radio-loud AGN. The spectral index can vary between , with the equipartition value of .
In our model is assumed to be constant throughout the region of interest (in the core at a given frequency). If changes smoothly with decreasing (consequently, at increasing ), then Eq. (2) is approximately valid only in a frequency range , for which is determined. In the inner jets (at GHz) however, the geometry of the flow may be different from conical due to external pressure gradients (e.g. Georganopoulos & Marscher, 1996) and may change very fast. Clearly, our simple model does not describe this scenario well. External pressure gradients may be caused for example by a dense, optically thick stellar wind. As most of the jet environment is expected to be ionized, this results in additional free-free absorption, and the jet intensity profile will depend also on the distribution of the absorbing medium.