A family of cometary globules at the periphery
of Cyg OB1: the star HBHA 3703-01 and the reflection nebula GM 2-39
Abstract
The interstellar medium in the region of a family of cometary globules including the reflection nebula GM 2-39 has been analyzed basing on our observations with the slit spectrograph, the results of our previous observations with a Fabry–Perot interferometer in the H line, Spitzer archival data together with CO microwave data. The structure of globules’ IR emission, velocity field of ionized gas in the H line and of molecular gas in the CO line have been considered. We have detected a CO cavern around the eastern globules and faint high-velocity H features of surrounding gas. The most probable sources of ionizing radiation and wind of the Cyg OB1 association responsible for the globules’ formation are proposed. Based on our multicolour photometry, it has been found that the brightest compact source in the southern ‘head’ of the cometary globule – the star HBHA 3703-01 (IRAS 20153+3850) – is a B(5–6)V star with =1.18 mag. The strong and broad H emission line was revealed in its spectrum. The spectral energy distribution of HBHA 3703-01 in the 0.44–24 m range has been modeled. It is shown that the star has a hot dust envelope with K and . Besides, the star HBHA 3703-01 illuminates the encompassing diffuse nebula GM 2-39 with a diameter of about 30 arcsec. With regard to all obtained observational data for HBHA 3703-01, this object may be classified as the Herbig Ae/Be star.
keywords:
ISM: kinematics and dynamics – ISM: clouds – ISM: lines and bands – infrared: ISM – ISM: individual objects: GM 2-39 – stars: individual: HBHA 3703-011 Introduction
The concept of a globule was introduced as early as in 1940s for ‘dark nebulae’ – opaque compact clouds with sharply delineated boundaries on the background of emission nebulae. Described for the first time by Hawarden & Brand (1976) and Sandquist (1976), cometary globules (CGs) are characterised by cometlike morphology – a compact opaque dust ‘head’, frequently surrounded by a bright rim, and a long dust ‘tail’. It is supposed that such a shape of CGs is formed as a result of the action of ultraviolet radiation (Reipurth, 1983) and/or of shock waves initiated by supernovae or stellar winds (Brand 1981; Brand et al. 1983; Sahu et al. 1988; Pittard 2011) on small dense clouds immersed in a rarefied medium. As a rule, CGs’ tails are oriented radially from the source that has formed them. The problem of the origin of CGs is still discussed. The study of their nature is of special interest because of their connection with the process of star formation: in heads of many globules compact IR sources – young stellar objects (YSOs) – have been detected.
The launch of IR space observatories opened a new stage in the study of CGs formation processes and their generic connection with star-forming regions. Dense dust clouds and their ‘fine structure’, formed by radiation and wind from young stars and determining the process of formation of a new generation of stars, are studied today very intensely using IR observations. The most impressive results have been obtained for the Carina Nebula (NGC 3372) from observations with the Spitzer and Hubble space telescopes (Smith et al., 2010a; Smith et al., 2010b). Here, multiple new Herbig–Haro objects with distinct bipolar jets, cometary globules with signs of star formation, circumstellar gas-dust discs (proplyds) have been detected. The spatial distribution of IR emission in different spectral bands revealed a clear picture of continuing star formation in dust pillars, which result from the action of young stars on the remnants of the parent molecular cloud.
In this paper we study the structure and kinematics of the interstellar medium towards a family of CGs (, ) detected in the archival data of the Spitzer Space Observatory in the field of the supershell in Cygnus. We carried out spectral observations of a compact stellar object in the head of the southern globule. The purpose of this work is the analysis of kinematics of ionized and molecular gas, revealing a physical association between different components of the stellar and gas populations of the region and search for traces of the Cyg OB1 stars’ wind action on cometary globules.
The description of IR images of CGs and their comparison with optical images is given in Section 2. In Section 3 we report the results of our study of the kinematics of the ionized gas towards the family of CGs using the data of our long-term interferometric H observations of the gas-dust complex in Cygnus. In Section 4 we present evidence for the association of the family of IR globules with a complex of molecular clouds and stars at the periphery of Cyg OB1; we have searched for probable kinematic signs testifying to the action of stellar wind on gas near CGs. In Section 5 we present the results of photometric and spectral observations of the star HBHA 3703-01 and the model of the dust envelope around this star. In Section 6 we summarize the main results together with their implications.
2 Family of cometary globules in the infrared and optical ranges
The family of cometary globules in the region – ; – was detected in the infrared using observational data of the Spitzer Space Observatory obtained from the Spitzer Legacy Survey of the Cygnus-X Complex111Spitzer Proposal, ID 40184 (2007) (Hora et al. 2008, http://www.cfa.harvard.edu/cygnusX). The archival data were downloaded from the Spitzer Heritage Archive222http://sha.ipac.caltech.edu. We had at our disposal images of the region in five wavebands: 3.6 m, 4.5 m, 5.8 m, 8.0 m observed with the InfraRed Array Camera (IRAC) and 24 m with the Multi-Band Imaging Photometer for Spitzer (MIPS). The spatial resolution of the images obtained with these cameras is 0.6 and 2.45 arcsec per pixel, respectively. We composed mosaics of the images using the MOPEX software333http://ssc.spitzer.caltech.edu/dataanalysistools/tools/mopex.
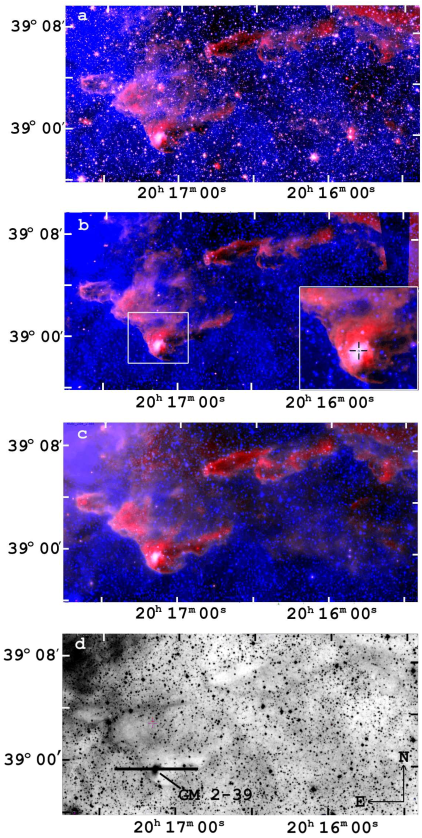
Figures 1abc show the images of the region in the 3.6, 8 and 24 m bands. It is visible that the family of IR globules consists of several lined in a chain, identically oriented CGs with sizes from to 7 arcmin. The morphology of the IR globules in all the wavebands is the same as a whole. (The ‘blurred’ image in the 24 m band is due to a lower resolution and, probably, to the fact that heated dust responsible for the main emission in this band can be present also in the neighbourhood of the globules.) The IR images of the globules coincide with the regions of opaque dust in Fig. 1d surrounded with gas emitting in the optical range. The bright contours of the IR globules are inside their optical boundaries.
| Location | l,b | N1 | N2 | |
|---|---|---|---|---|
| , km s-1 | ||||
| (1) | (2) | (3) | (4) | (5) |
| Eastern globules | – | 36 | 11 | |
| – | 12 | |||
| 4 | ||||
| Western globules | – | 30 | 16 | |
| – | 11 | |||
| 3 | ||||
| CO cavern around WR 139 | – | 230 | 147 | |
| (region II) | – | 12 | ||
| 28 | ||||
| CO cavern near HD 193595 | – | 63 | 45 | |
| and HD 228841 (region III) | – | 7 |
In the IR range as in the optical the ‘three-head’ structure and the tail of the eastern IR globule are visible; the size of the largest head reaches 3 arcmin. The heads are ‘filled’ with IR emission of different structure: the northern oval head is limited with a bright contour and has a cellular IR structure (Fig. 1b); in the ‘middle’, cone-shaped one, the brightness of IR emission decreases toward the tail. The brightest southern head hosts the reflection nebula GM 2-39 detected in the optical range by Gyulbudaghian & Maghakian (1977) (Fig. 1d). Its size does not exceed 1 arcmin, and the integrated stellar magnitude on Palomar Sky Survey images is nearly identical in the red and blue light. GM 2-39 is the brightest extended IR source in the area; its morphology in the optical and IR ranges is identical (Fig. 1b). In the western IR globules having an elongated shape and smaller size, we reveal bright, sometimes intermittent contours with a brightening in the region of the supposed head and at the end of the tail. (Note that the studied objects are not classical cometary globules, typical of which is not only a distinct bright head, but also a long dust tail. Probably, the western globules are fragments of the tails of the eastern heads; a ‘classical’ cometary nebula is only the southern part of the eastern globule.)
Peculiarities of the globules in the IR range are thin small filaments in the form of ‘whiskers’ near the heads (Fig. 1ab). Similar IR filaments have been detected in a large number of cometary globules. As an example, let us mention globules in the Carina Nebula (Smith et al., 2002). The filaments in front of the southern head are curled toward the tail; they resemble rims noticeable in the optical range at the peripheries of the heads of cometary globules in the Gum Nebula (Reipurth, 1983). From the east the ‘Three-headed’ IR globule is also bordered with an optical rim, a much broader one than that of IR (Fig. 1d). Between the IR head and its optical rim a sharp boundary, especially prominent in the case of the southern head, is seen (Fig. 1b). The western globules are limited with bright IR contours; however, there are no optical counterparts for them. Note that there are regions of cool dust in the tails of the eastern and one of the western globules (Fig. 1).
Thus, the morphology of CGs in the IR bands is as a whole consistent with the optical images: dust head and tail, restricted with bright IR and/or optical rims. The optical emission encircles the IR globules. However, in the IR range there is a characteristic feature that has no optical counterpart: thin filaments in front of the heads of the ‘Three-headed’ CG. The structure of other globules in the IR range is also more expressive than in the optical, since at the periphery the globules are bordered with bright IR rims in all considered spectral bands.
3 Velocities of ionized gas in the region studied
Detecting physical connection between different components of ionized gas, dust, dense molecular clouds and stellar population of the extended region around the considered CGs requires their radial velocities. It is difficult to find such a connection, because the region belongs to a heavily populated field, that is viewed along the spiral arm.
In the analysis of velocities of ionized gas towards CGs and their neighbourhood we used the results of our observations of the Cygnus gas-dust complex in the H line carried out with a Fabry–Perot interferometer (IFP) mounted in the Cassegrain focus of the 125-cm reflector of the Crimean Laboratory (Sternberg Astronomical Institute, Moscow State University). A technique of observations and their processing were described in detail by Lozinskaya et al. (1998). The field of view and angular resolution of the observations was 10 arcmin and 3–4 arcsec, respectively; the actual spectral resolution was 10–15 km s-1. The line profile was approximated with one or several gaussian curves in the supposition that the FWHM of each component is larger than the halfwidth of the instrumental profile and signal-to-noise ratio is .
In 1993–1995 we obtained 15 IFP-images in a broad vicinity of CGs. Here, as everywhere in the Cygnus complex, multipeak profiles of the H line are observed. They consist of one or several bright main components with velocities of the peaks within the interval km s-1 and of faint ‘shifted’ components in the line wings with velocities up to km s-1 and km s-1. The radial velocities of the main component are due to systematic motions created by the galactic rotation and spiral density shock waves. Those of the shifted components are caused by local high-velocity flows of gas related to shock waves initiated by supernovae and/or stellar winds. At large negative velocities we cannot eliminate also a contribution from distant HII regions of the Perseus Arm.
For allocation of characteristic systematic motions of ionized hydrogen in the field of CG and their neighbourhoods we have plotted ‘diagrams of occurrence’ of radial velocities in selected areas. Using them, we have found radial velocities of gas characteristic of the region as the average values at half-maximum of the corresponding diagram together with root-mean-square errors of their estimate . The obtained velocities are listed in Table 1 in columns: (1) region identification (CO caverns are shown in Fig. 2b); (2) Galactic or equatorial coordinates; (3) number of points N1 at which radial velocities were measured; (4) range of the prevalent radial velocities of systematic motions (emphasized in boldface); (5) number of measurements N2 from which the velocity range was determined. Given for each of the four areas in the first line are velocities of systematic motions of gas, in the second and third lines are velocities of shifted positive and negative components of the H line. The field of radial velocities in the broad neighbourhood of globules considered here was analyzed also by Esipov et al. (1996) and Sitnik (2011).
The detected intervals of systematic radial velocities of ionized hydrogen are typical of the population of the Cygnus Arm and are consistent with the corresponding velocities of molecular clouds of this arm according to the data of Leung & Thaddeus (1992) (see also Sitnik & Lozinskaya 2009) and with modern CO observations of the Cyg X region with a high angular resolution (Gottschalk et al. 2012 and references therein).
4 Stellar population, structure and kinematics of gas in the vicinity of the cometary globules
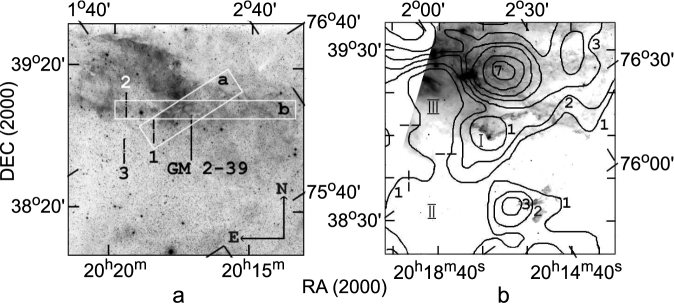
According to adopted concepts (Reipurth, 1983; Brand, 1981; Brand et al., 1983; Sahu et al., 1988; Pittard, 2011), cometary globules are shaped by shock waves and/or ultraviolet radiation, so the head should point to the energy source, and the tail is extended radially from it. In our case individual CGs as well as the entire family of CGs lined in a chain are oriented such that the heads ‘look’ towards the plane of the Galaxy (see Fig. 2a). Accordingly, the energy source should be sought for in a region southeast/east from CGs. Note that the considered region includes many optical globules (Fig. 1d, 2a); however, not all of them show up in the IR range and not all are surrounded by bright optical rims.
We can reveal toward the globules and their neighbourhood in the southeast sector of the complex the following components of the interstellar medium and stellar population.
1. A CO cavern () is observed at the velocity km s-1 (Leung & Thaddeus, 1992) towards the eastern globules(region I in Fig. 2b). According to Table 1, ionized hydrogen that the globules are embedded in radiates at the same systematic velocities km s-1. In a 36 arcmin region including the family of globules, the emission in the H166 radio recombination line at velocity km s-1 is also observed (Landecker, 1983).
2. CGs are at the periphery of the young stellar association Cyg OB1, inside a large-scale shell around Cyg OB1 and Cyg OB3 detected in the optical, radio and IR ranges (Brand & Zealey, 1977; Lozinskaya & Sitnik, 1988; Lozinskaya & Repin, 1990). The distance to Cyg OB1 is 1.5 kpc (Garmany & Stencel, 1992; Sitnik & Mel’nik, 1996). The median radial velocity of the stars of Cyg OB1 found from the velocities for 34 of 70 stars of the association is 4 km s-1 with a dispersion of 8.9 km s-1 (Sitnik, 2003), which is consistent with the quoted above velocities of ionized gas and CO emission and allows us to suggest a close spatial location of Cyg OB1 and globules. Note that in the studied direction of the Cygnus Arm, except for the cluster Be 86 which is a member of Cyg OB1 (Forbes et al., 1992), no other young stellar group has been detected.
3. At a separation of to the east and southeast from the chain of CGs, on its extension, at least three stars with a powerful wind are localized: HD 228841 (Of), HD 193595 (Of) and WR 139 (Fig. 2a). Both Of stars are members of Cyg OB1 association (Blaha & Humphreys, 1989; Garmany & Stencel, 1992), and WR 139 is its probable member (Van der Hucht, 2001). All three stars are observed in a region with depleted CO emission (Leung & Thaddeus, 1992) detected at velocities km s-1 inside the supershell around Cyg OB1, Cyg OB3 (regions II, III in Fig. 2b). This CO cavern, which is probably formed by combined action of stellar wind and radiation of the stars of Cyg OB1 (Lozinskaya & Sitnik, 1988; Sitnik, 2011), is limited from the north by a complex of molecular clouds at velocity km s-1. The star HD 228841 is on the extension of the chain of CGs and is separated from the nearest heads of CGs by 6 pc (see Fig. 2). The star WR 139 is located in the same direction at a projected distance of 13 pc from the heads of CGs. The star HD 193595 is located at 9 pc to the east from the family of globules; the chain of CGs is partially deployed toward it. The extension of the chain of CGs at the distance of Cyg OB1 is 9 pc, and the sizes of the globules are not larger than 3 pc.
4. Toward the family of globules high-velocity motions of ionized hydrogen with characteristic velocities km s-1 and km s-1 are observed (see Table 1). Earlier, high-velocity motions of ionized hydrogen in this region were attributed to the filamentary nebula Simeiz 55 (Esipov et al., 1996) (Fig. 2a). In the sky plane the nebula is a part of the supershell around the Cyg OB1 association. The family of globules is observed on the background of this nebula (Fig. 2a). The nature of high-velocity motions and filamentary morphology of Simeiz 55 are not completely clear, because in the nebula neither synchrotron radio emission, which would testify to a supernova explosion, nor a star with a powerful wind have been detected.
High-velocity motions of ionized hydrogen in the neighbourhood of the family of globules could be evidence for the physical association of cometary globules with nearby stars of the Cyg OB1 association. To find probable kinematic signs of the Of stars wind action on gas in the neighbourhood of the globules, we have analyzed high-velocity components in the H line. Along the chain of the globules, we have plotted distributions of radial velocities as functions of projected distances to each of the stars (so-called P/V diagrams) (Fig. 3). The regions for which P/V diagrams were plotted are shown in Fig. 2a.
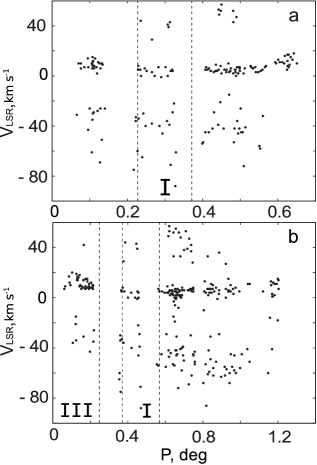
In Fig. 3a high velocities of the shifted components in the H line (up to km s-1) are found at a separation of (2.5 pc) from the star HD 228841 and are visible up to the supershell around Cyg OB1, where they become equal to the mean velocity of the surrounding medium. We see no definite decrease in the radial velocity that could be attributed to a head-on collision of the shock driven by the wind of HD 228841 with the heads of the globules. Indirect evidence for the interaction between the wind of the star and the family of CGs can be the shape of the heads prolate perpendicularly to the direction toward the star as well as the presence of the CO cavern surrounding the eastern globules (see item 1) and of fine IR filaments curled away from the star. The existence of high-velocity motions observed beyond (7 pc), that is farther than the heads, can be explained by gas circumflowing the family of CGs. The main non-shifted component of the line in Fig. 3 sums up the emission of non-perturbed gas near the star and in the line of sight.
In Fig. 3b high velocities, up to 60–80 km s-1 , are visible at a projected separation of (12 pc) from HD 193595, and decrease by the absolute value to the velocity of the surrounding medium at (21 pc). The family of globules is within the limits of this distance. Note also that HD 193595 and the family of CGs are at the opposite sides of the CO cavern detected at velocity km s-1 (region III in Fig. 2b). In Fig. 3b this rarefied region of the interstellar medium extends to not less than (7 pc) from HD 193595. Therefore, high velocities of ionized hydrogen are found only far from the star.
Thus, the family of CGs falls within the zone of action of the wind from the Of stars HD 228841 and HD 193595. The surrounding ionized gas swept by the wind of these stars expands at a velocity of up to 60–80 km s-1 and circumflows the family of cometary globules, since we see high velocities along the entire chain of CGs. We have found no obvious kinematic signs of braking of high-velocity gas due to interaction with the Three-headed globule.
From what was said it follows that the generic association between the family of CGs and the above-mentioned stars of Cyg OB1 is possible. This is based on the following arguments. The family of CGs is surrounded by ionized gas radiating at systematic velocities km s-1. The median radial velocity of the Cyg OB1 stars is 4 km s-1. At the same velocities a CO cavern is observed around the eastern globules (region I in Fig. 2b). This small cavern was formed in a complex of clouds limiting another CO cavern detected at km s-1 and connected with the Cyg OB1 association (see regions II and III in Fig. 2b and in Table 1). The above-mentioned Of and WR stars belong to Cyg OB1. In the sky plane the stars lie on the extension of the chain of CGs within the limits of the action of their UV emission and wind. Important signs of the probable physical association of these stars with the cometary globules are radial elongation of the chain of CGs relative to the stars and its morphology: the heads with a bright rim point toward the stars, large bright globules are closer to the stars than small ones. IR rims observed near the heads of globules and curled toward the tails belong to type 1 in the classification of Smith et al. (2002) (see Fig. 33 therein). This is one more argument for the association of the stars and globules, since such a shape is formed under the action of wind and radiation of a massive star or cluster.
5 The star HBHA 3703-01 and the nebula GM 2-39 associated with cometary globules
The nebula GM 2-39 hosts the star GSC 03151-00990 (; (2000)) identified with the infrared source IRAS 20153+3850 (Fig. 1bd). The star is also included in the catalog of H emission objects (Kohoutek & Wehmeyer, 1999) as HBHA 3703-01. According to the classification of emission spectra of stars in this catalog, the H emission line in the spectrum of HBHA 3703-01 has a medium intensity on the background of a moderate continuum. The catalog lists the star’ brightness of mag.
To get more complete information about the star and surrounding interstellar medium we carried out the spectral and photometric observations.
5.1 Photometric observations of HBHA 3703-01
The photometric observations were carried out with the 60-cm reflector of the Crimean Observatory of the Sternberg Astronomical Institute equipped with Apogee AP-47p camera. A total of 158 images in the bands were obtained in September–November 2012. All reductions were made using IRAF444IRAF is distributed by the National Optical Astronomy Observatory, which is operated by AURA under cooperative agreement with the National Science Foundation, MAXIM and programs of V.P. Goranskij.
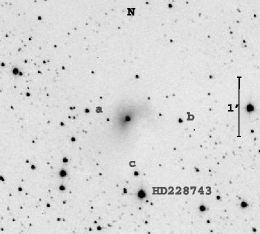
The comparison stars were calibrated with respect to the star HD 228743. Its stellar magnitudes ( mag, mag, mag, mag, mag and mag) were obtained using the following photometric standards: PG2336, PG0231, RU149 (Landolt, 1992), M92, NGC 7790 (Stetson, 2000), M81 (Richmond et al., 1994). The reduction of to and to was done with equations from Bessell (1979). The image of HBHA 3703-01 and comparison stars are shown in Fig. 4.
The colour terms for transformation of instrumental magnitudes to standard were determined using observations of standards in M 92 and NGC 7790 (Stetson, 2000) and in M82 (Richmond et al., 1994). The equations ; ; ; and were solved for colour terms: , , , .
The results of our photometric observations of HBHA 3703-01 are presented in Table 2. The star brightness varies from night to night, but these variations do not exceed 3; therefore, the conclusion on star photometric variability would be premature.
| JD-2400000 | ||||||||||||
|---|---|---|---|---|---|---|---|---|---|---|---|---|
| 56187.3 | – | – | 15.89 | 0.05 | 14.96 | 0.01 | – | – | – | – | – | – |
| 56216.2 | – | – | 15.99 | 0.04 | 14.99 | 0.01 | – | – | 13.89 | 0.01 | 13.22 | 0.01 |
| 56218.2 | – | – | 15.95 | 0.06 | 14.89 | 0.02 | – | – | – | – | – | – |
| 56219.2 | – | – | 16.02 | 0.03 | 15.01 | 0.02 | – | – | 13.86 | 0.01 | 13.26 | 0.02 |
| 56240.2 | – | – | 16.02 | 0.02 | 14.94 | 0.01 | 14.29 | 0.01 | 13.87 | 0.01 | 13.29 | 0.02 |
| 56243.2 | – | – | 16.06 | 0.02 | 15.03 | 0.03 | 14.29 | 0.01 | – | – | 13.27 | 0.02 |
| 56247.2 | – | – | 15.97 | 0.02 | 15.00 | 0.02 | 14.28 | 0.01 | – | – | 13.17 | 0.02 |
| 56252.1 | 16.45 | 0.08 | 16.04 | 0.03 | 15.02 | 0.05 | 14.27 | 0.01 | – | – | 13.30 | 0.02 |
| mean | 16.45 | 0.08 | 15.99 | 0.10 | 14.98 | 0.07 | 14.28 | 0.02 | 13.87 | 0.02 | 13.25 | 0.04 |
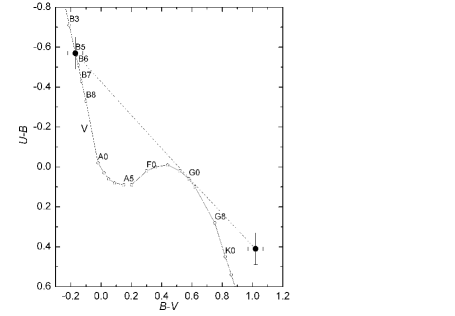
The comparison of mean colour indices of HBHA 3703-01, mag, mag, with normal colour indices of main-sequence stars shows that HBHA 3703-01 is a B(5–6)V star with the colour excess mag. For that we used intrinsic colour indices from Straižys (1977) and the reddening line of Cyg OB2 in form , derived by Turner (1989). We note that there are only three stars HD 193032 (B1 III), HD 192422 (B0.5I) and HD 228841 (O7.5I) with known -data and the two-dimensional spectral classification in a close () vicinity of HBHA 3703-01. Photometry of these stars provides an average that is in a good agreement with Turner’s data. The position of HBHA 3703-01 on the , diagram is indicated in Fig. 5.
We estimated the visual absolute magnitude of HBHA 3703-01 using our data – mag and mag – assuming that the star belongs to the Cyg OB1 complex at the distance 1.5 kpc. It turned out to be mag, in a good agreement with the visual luminosity of B6 stars on the zero-age main sequence (ZAMS, mag, Straižys 1982).
The colour excess, =1.18 mag, derived by us, characterises the total light extinction involving the interstellar and circumstellar components. The problem of light extinction toward HBHA 3703-01 is complicated, since the star is embedded in an extremely inhomogeneous dust medium. The nearest to HBHA 3703-01 star with the known reddening – HD 228841 (Of7.5p) with mag, member of Cyg OB1 – is located at about 18 arcmin from the emission star outside the region of large extinction. Adopting for HBHA 3703-01 this value as its interstellar extinction, the circumstellar reddening component of HBHA 3703-01 may be estimated as about 0.3 mag.
The reflection nebula GM 2-39 surrounding the star HBHA 3703-01 is well visible on images in all bands. The measured colour indices of the nebula, mag, mag, are considerably bluer than that of the star: mag, mag, due to the strong scattering of the stellar light in this nebula.
5.2 Spectral observations of HBHA 3703-01 and of its environment
Long-slit spectra at low spectral resolution were obtained with a large-aperture spectrograph in the Cassegrain focus of the 125-cm reflector of the Crimean Laboratory of the Sternberg Astronomical Institute in 2011 and 2012 years. We used a diffraction spectrograph with a 600 lines/mm grating. The observations were conducted with a slit about 8 arcmin long and 4 arcsec wide; the scale along the slit was 1.98 arcsec per pixel. As a detector an ST-402 camera was used (array size 765510 pixels, pixel size 99 m). The actual spectral resolution was = 6.0 Å. The typical achieved signal-to-noise ratio () is about 10. The spectrograph slit was directed east–west (the localization of the spectrograms is shown in Fig. 1d). Table 3 gives the log of observations: for each spectrum it lists the date, spectral range and total exposure . The spectrophotometric standards 40 Cyg and 57 Cyg (Glushneva et al., 1998) were used for flux calibration. The spectra were processed by the standard CCDOPS software as well as by SPE code created by S.G. Sergeev in the Crimean Astrophysical Observatory (Sergeev & Heisberger, 1993). The primary processing included dark current subtraction, extracting individual spectra from CCD images and their wavelength calibration.
| Date | JD-2400000 | , Å | , s |
|---|---|---|---|
| 05/06.10.11 | 55840 | 5700–7200 | 600 |
| 26/27.10.11 | 55861 | 5700–7200 | 900 |
| 15/16.09.12 | 56186 | 4000–5700 | 1800 |
| 10/11.10.12 | 56211 | 4000–5700, 5700–7200 | 1800, 1800 |
| 15/16.10.12 | 56216 | 4000–5700, 5700–7200 | 1800, 1800 |
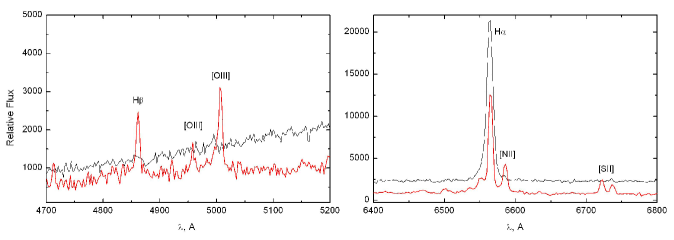
The star HBHA 3703-01 was placed at the slit centre. The only line detected in the observed spectrum of the star is broad H ( Å). After excluding the instrumental profile, of the line is Å; this corresponds to a high velocity, km s-1. The large linewidth can be caused by stellar wind, star rotation or turbulent motions in the outer envelope of the star. We measured the equivalent widths of H on four spectrograms obtained in 2011 and 2012 and did not find any variations exceeding the measurement errors. The mean equivalent width is Å. Most likely, the emission line is formed by the collisional excitation mechanism. By this, the object is similar to Herbig Ae/Be stars, characteristic of star-forming regions.
We measured also the absolute flux in for HBHA 3703-01 erg cm-2s-1. When corrected for light extinction with =3.65 mag, we find erg cm-2s-1. Adopting distance to the star = 1.5 kpc found for the Cyg OB1 association, we obtain the luminosity in the line erg s-1, or photons per second. A typical B(5–6)V star delivers much less photons in the range Å; therefore, the H line can not be produced by a process of photoionization followed by recombination. As will be shown below, HBHA 3703-01 may be classified as the Herbig Ae/Be star. The origin of the emission lines in such stars is still under discussion.
In the spectrum of ionized gas, along the entire spectrograph slit (8 arcmin), the emission lines H, [O iii] 4959, 5007 Å, H, [N ii] 6548, 6584 Å, [S ii] 6717, 6731 Å are seen. Figure 6 shows the spectrum of the star HBHA 3703-01 after subtraction of the nebula background and the emission spectrum of ionized gas.
The reflection nebula GM 2-39 has a diameter of about 30 arcsec and is well seen in the optical and infrared, but it is invisible on our spectrograms owing to its low surface brightness.
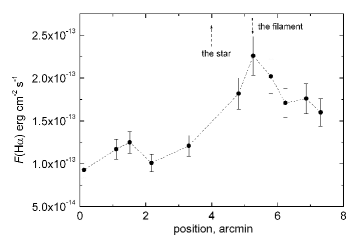
The emission spectrum of ionized gas of the surroundings is due by its origin to the general field of ultraviolet radiation of the hot stars WR 139, HD 193595 and HD 228841. The intensity of the emissions vary along the slit with the inhomogeneity of interstellar medium. Figure 7 shows the distribution of the H flux of ionized gas along the slit from east to west. At 1.3 arcmin to the east from the star HBHA 3703-01 there is a dense optical filament = rim of the southern head of the globule. On the slit at this place the emission lines of hydrogen, sulfur and nitrogen are especially enhanced.
We measured the intensity ratio of basic emission lines of ambient ionized gas. The average values along the slit are: , , . These values are typical of the interstellar medium with solar abundances and they fall into the position of typical H ii regions on diagnostic diagrams [N ii]/H – [O iii]/H and [S ii]/H – [O iii]/H (Kniazev et al., 2008).
The mean value of is very close to its limiting value for low densities, allowing to determine only an upper limit of the electron density in the ambient gas, cm-3.
5.3 Model of the spectral energy distribution of HBHA 3703-01 with a dust envelope
The object HBHA 3703-01 is well visible on original Spitzer images in the 3.6, 4.5, 5.6, 8, 24 and 70 m IR bands. On all images except for 70 m it looks as a starlike object surrounded by a nebula. On the last image only the nebula is visible. Using these images except for 70 m, we estimated its fluxes in each of the bands in units of erg cm-2s-1Å-1: , , , and . We subtracted the nebular emission surrounding the object from the measured fluxes. The object HBHA 3703-01 was observed also during the 2MASS survey (its catalogue ID is 20170810+3859295); its magnitudes are, respectively, , , . The large colour index, , tells that the star has an excess of IR emission most likely associated with a hot (1000 K) circumstellar gas-dust envelope.
In addition, observations of HBHA 3703-01 were obtained by the AKARI infrared satellite (Kawada et al., 2007). According to these data, the fluxes from HBHA 3703-01 in the 65, 90, 140 and 160-m bands (in units of erg cm-2s-1Å-1) are , , and . Integration of SED in the 65–160-m range indicates that the total emission of dust in this range exceeds the luminosity of the central star by a factor of a few. Such a large flux may be due to the low angular resolution of AKARI (1–2 arcmin) (Doi Y. et al., 2012). In addition to the circumstellar envelope, its field of view covers an appreciable part of the dust cloud visible on the 24-m image and heated by the radiation field of the Cyg OB1 stars. Thus, the AKARI fluxes refer not only to the emission of the circumstellar envelope of HBHA 3703-01 but also to the nebula GM 2-39 and to some part of its environment. In what follows we do not consider these fluxes.
Figure 8 shows the SED of HBHA 3703-01 in the 0.44–24-m spectral range plotted together with our photometric data and 2MASS (, , ), as well as fluxes from the Spitzer images (3.5–24 m). The figure also shows the 8–21-m MSX mission data (Egan et al., 2003). All fluxes were corrected for interstellar extinction that corresponds to mag using the extinction law from Rieke & Lebofsky (1985). This value is less than the one used above in the estimation of the spectral type of the star, since some part of the extinction toward the central source may be due to the circumstellar envelope. The SED of HBHA 3703-01 taking into account the circumstellar dust envelope was calculated using the CSDUST3 software, which was described in detail by Egan et al. (1988). We have done the following assumptions:
1. The dust envelope was considered to be spherically symmetric with inner and outer radii and , respectively. The dust density distribution in the envelope was set as .
2. The spectral energy distribution of the B(5–6)V central star was assumed to be blackbody with temperature = 15,000 K and luminosity . Precisely this luminosity is obtained with a distance of 1.5 kpc and with the observed bolometric flux.
3. The dust envelope consists of amorphous silicate and graphite particles with radius , and number densities and , respectively. The factors of efficiency of absorption and scattering were calculated in accordance with the theory of Mie (1908) for spherical particles. The refractive index of the material of the particles was taken from Dorschner et al. (1995). In the calculations we determined the optical depth of the envelope at a wavelength of 0.55 m (), , , , , , and the exponent in the dust density distribution law. Figure 8 presents the calculated SED of the object HBHA 3703-01, which was obtained under the above assumptions.
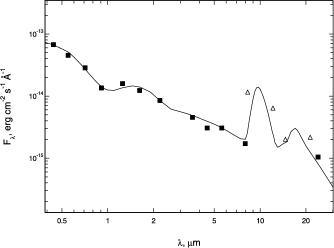
The best agreement between the computed and observed SED is achieved for the following parameters: , , m, m, /, , K.
Thus, in the circumstellar dust envelope of HBHA 3703-01 silicate particles prevail. The silicate dust temperature at the inner boundary of the envelope is =1350 K. Exponent in the dust density distribution law is a typical value in accreting envelopes of Herbig Ae/Be stars (see, e.g., Shu et al. 1987). The total mass of the dust envelope radiating in the considered spectral range is . For the ratio this yields the total mass of the circumstellar envelope . Note that the estimated mass of the envelope depends on the outer radius of the envelope; finding the envelope mass requires far-infrared observations with a high angular resolution. Therefore, we estimate only the mass of the material radiating in the wavelength range m.
Thus, the object HBHA 3703-01 located at the center of the diffuse nebula GM 2-39, in the region of the southern head of the IR globule, is a B(5–6)Ve star with a dust envelope, whose temperature at the inner boundary is about 1400 K. The star illuminates the nebula GM 2-39. The nebula GM 2-39 is distinguished from the ambient background of the molecular cloud just because of the presence of the above-mentioned star.
Thus, the star HBHA 3703-01 satisfies completely the criteria for Herbig Ae/Be stars (Herbig, 1960): (1) spectral type of A or earlier with emission lines, (2) location in an ‘obscured region’ and (3) the star would illuminate a bright reflection nebulosity in its vicinity.
In the area studied, no strong centimetre-wavelength radio continuum source is present that could be associated with a compact ionized region. Only one compact radio source has been detected there, MITG J201703+3900 (Griffith et al., 1991) with flux density mJy at GHz. Most probably, it is a nonthermal extragalactic source, its spectral index () in the 1.4–5 GHz interval is 2.32.
6 Conclusion
Our study of the interstellar medium toward a family of cometary globules detected in the archival data of the Spitzer Space Observatory in the region of a supershell in Cygnus allow us to draw the following conclusions.
The analysis of kinematics of the interstellar medium in the neighbourhood of the family of CGs and of the stellar population in the regions suggests a physical association between CGs and the Cyg OB1 association at a distance of 1.5 kpc. (Ionized hydrogen and CO molecular clouds near the family of CGs have velocity km s-1; the median radial velocity of the stars of Cyg OB1 is km s-1.)
The considered family of globules can be a remnant of a pillar directed toward the centre of the Cyg OB1 association. The pillar is decaying in the process of star formation under the action of ionizing radiation and wind of the stars of Cyg OB1.
The family of CGs is within the zone covered by the wind and ionizing radiation of the Of stars HD 228841 and HD 193595 belonging to Cyg OB1. The chain of CGs extends radially with respect to these stars. The morphology of CGs in the IR bands is as a whole consistent with the optical images: dust head and tail bordered with bright IR and/or optical rims. The optical emission encircles the bright IR globules.
The ambient ionized gas is characterized by high-velocity features in the H line (up to 60–80 km s-1 with respect to the systematic velocity); this is a consequence of the action of the wind from these stars. The gas swept out by the wind circumflows the family of cometary globules, since high velocities are observed along the entire chain of CGs. We have found no obvious kinematic signs of braking of the high-velocity gas at the interaction with the ‘Three-headed globule’. Indirect indications to the interaction of the wind from the star and the family of CGs can be the presence of a CO cavern surrounding the eastern globules and fine IR filaments curled away from the stars.
We have observed a compact stellar object in the southern head of the brightest globule – the star HBHA 3703-01 identified with the infrared source IRAS 20153+3850. Our multicolour photometric observations allow us to estimate the spectral type of HBHA 3703-01 as B(5–6)V and to measure its colour excess mag. Low-resolution spectral observations of HBHA 3703-01 have revealed the broad H emission with Å, which corresponds to a high velocity, km s-1. The absolute visual magnitude of the star obtained under the assumption that the star belongs to the Cyg OB1 starburst complex locates it on the H-R diagram near ZAMS in the region of Herbig Ae/Be objects.
HBHA 3703-01 is surrounded by the reflection nebula GM 2-39; its diameter is about . The nebula is distinguished against the background of the overall molecular cloud just because of the presence of the star, which illuminates a part of the interstellar medium nearest to the star and results in the formation of an optical reflection nebula.
Using archival data of observations of HBHA 3703-01 obtained by the Spitzer Space Telescope, we have estimated the fluxes in the 3.6, 4.5, 5.6, 8 and 24 m bands. (On all IR images HBHA 3703-01 looks as a starlike object surrounded with a nebula; the emission of this nebula is subtracted from the measured fluxes.) We have also used our photometric data for HBHA 3703-01 together with the 2MASS magnitudes (, , ). According to these data, we have derived the SED of HBHA 3703-01 in the 0.44–24 m range. All observations were corrected for the interstellar extinction with mag.
The obtained SED can be rather well described within the framework of the model of emission of the central source (a blackbody with temperature K) surrounded by a dust envelope with parameters listed above.
The derived dust density distribution in the envelope is typical of the envelopes of Herbig Ae/Be stars.
Acknowledgments
This work was based on the data of IFP observations in the H line, spectral observations on the 125-cm reflector and photometric observations on the 60-cm reflector of the Crimean Laboratory of the Sternberg Astronomical Institute, Moscow State University. We used archival data of the Spitzer, AKARI and 2MASS observations, radio data in the CO line and the database of the Centre des données astronomiques, Strasbourg, France. This research was supported by the Russian Foundation for Basic Research (project codes 10-02-00091-a, 12-02-31356). OVE is also grateful for the financial support of the ‘Dynasty’ Foundation. We thank S.V. Antipin who made some of the photometric observations. We thank the anonymous referee for the constructive comments that improved the quality of the paper.
References
- Bessell (1979) Bessell M.S., 1979, PASP, 91, 589
- Blaha & Humphreys (1989) Blaha C., Humphreys R. 1989, AJ, 98, 1598
- Brand (1981) Brand P.W.J.L., 1981, MNRAS, 197, 217
- Brand & Zealey (1977) Brand P.W., Zealey W.J., 1977, A&A, 38, 363
- Brand et al. (1983) Brand P.W.J.L., Hawarden T.G., Longmore A.J., Williams P.M., Caldwell J.A.R., 1983, MNRAS, 203, 215
- Doi Y. et al. (2012) Doi Y. et al., PKAS, 27, 111
- Dorschner et al. (1995) Dorschner J., Begemann B., Henning Th., Jäger C., Mutschke H., 1995, A&A, 300, 503
- Droege et al. (2007) Droege T.F., Richmond M.W., Sallman M., 2007, PASP, 119, 1083
- Egan et al. (1988) Egan M.P., Leung C.M., Spagna G.F., 1988, Comp. Phys. Comm., 48, 271
- Egan et al. (2003) Egan M. P. et al., 2003, Air Force Research Laboratory Technical Report AFRL-VS-TR-2003-1589, VizieR online data catalogue, V/114
- Esipov et al. (1996) Esipov V.F., Lozinskaya, T.A., Mel’nikov V.V., Pravdikova V.V., Sitnik T.G., Nichols-Bohlin J., 1996, Astron. Lett., 22, 509
- Forbes et al. (1992) Forbes D., English D., De Robertis M. M., Dawson P.C., 1992, AJ, 103, 916
- Garmany & Stencel (1992) Garmany C.D., Stencel C.D., 1992, A&AS, 94, 214
- Glushneva et al. (1998) Glushneva I.N., Doroshenko V.T., Fetisova T.S., Khruzina T.S., Kolotilov E.A., Mossakovskaya L.V., Ovchinnikov S.L., Voloshina I.B., 1998, VizieR Online Data Catalog III/208555http://cdsarc.u-strasbg.fr/viz-bin/Cat?cat=III%2F208&
- Gottschalk et al. (2012) Gottschalk M., Kothes R., Matthews H.E., Landecker T.L., Dent W.R.F., 2012, A&A, 541, A79
- Griffith et al. (1991) Griffith M., Heflin M., Conner S., Burke B., Langston G., 1991, ApJS, 75, 801
- Gyulbudaghian & Maghakian (1977) Gyulbudaghian A.L., Maghakian T.Y., 1977, Doklady Akad. Nauk Armenian SSR, 64, 104
- Hawarden & Brand (1976) Hawarden T.G., Brand P.W.J.L., 1976, MNRAS, 175, 19
- Herbig (1960) Herbig G.H., 1960, ApJS, 4, 337
-
Hora et al. (2008)
Hora J.L. et al., 2008, New Light on Young Stars: Spitzer’s
View of Circumstellar Disks, Proc. Fifth Spitzer Conf.
CalTech, Pasadena, CA666http://www.ipac.caltech.edu/spitzer2008/
talks/JosephHora Spitzer2008Conference.pdf - Kawada et al. (2007) Kawada M. et al., 2007, PASJ, 59, S389
- Kniazev et al. (2008) Kniazev A.Y., Pustilnik S.A., Zucker D.B., 2008, MNRAS, 384, 1045
- Kohoutek & Wehmeyer (1999) Kohoutek L., Wehmeyer R., 1999, A&AS, 134, 255
- Landecker (1983) Landecker T.L., 1983, JRAS Canada, 77, 264
- Landolt (1992) Landolt A., 1992, AJ, 97, 337
- Leung & Thaddeus (1992) Leung H.O., Thaddeus P., 1992, ApJS, 81, 267
- Lozinskaya & Sitnik (1988) Lozinskaya T.A., Sitnik T.G., 1988, SvA Lett., 14, 100
- Lozinskaya & Repin (1990) Lozinskaya T.A., Repin S.V., 1990, SvA, 34, 580
- Lozinskaya et al. (1998) Lozinskaya T.A., Pravdikova V.V., Sitnik T.G., Esipov V.F., Mel’nikov V.V., 1998, Astron. Reports, 42, 453
- Mie (1908) Mie G., 1908, Ann. Physik, 25, 377
- Pittard (2011) Pittard J.M., 2011, MNRAS, 411, L41
- Reipurth (1983) Reipurth B., 1983, A&A, 117, 183
- Richmond et al. (1994) Richmond M.W. et al., 1994, AJ, 107, 1022
- Rieke & Lebofsky (1985) Rieke G.H., Lebofsky M.J., 1985, ApJ, 288, 618
- Sahu et al. (1988) Sahu M., Pottasch S.R., Sahu K.C., Wesselius P.R., Desai J.N., 1988, A&A, 195, 269
- Sandquist (1976) Sandquist A., 1976, MNRAS, 177, 69P
- Sergeev & Heisberger (1993) Sergeev S.G., Heisberger F., 1993, A Users Manual for SPE. Wien
- Shu et al. (1987) Shu F.H., Adams F.C., Lizano S., 1987, Annual Rev. Astron. Astrophys., 25, 23
- Sitnik (2003) Sitnik T.G., 2003, Astron. Lett., 29, 311
- Sitnik (2011) Sitnik T.G., 2011, Astron. Reports, 55, 616
- Sitnik & Lozinskaya (2009) Sitnik T.G., Lozinskaya T.A., 2009, Astron. Lett., 35, 121
- Sitnik & Mel’nik (1996) Sitnik T.G., Mel’nik A.M., 1996, Astron. Lett., 22, 122
- Smith et al. (2002) Smith L.J., Norris R.F. Crowther P.A., 2002, MNRAS, 337, 1309
- Smith et al. (2010a) Smith N., Bally J., Walborn N.R., 2010a, MNRAS, 405, 1153
- Smith et al. (2010b) Smith N. et al., 2010b, MNRAS, 406, 952
- Stetson (2000) Stetson P.B., 2000, PASP, 112, 925
- Straižys (1977) Straižys V., 1977, Multicolor Stellar Photometry. Photometric Systems and Methods. Mokslas Publishers, Vilnius
- Straižys (1982) Straižys V., 1982, Metal-deficient Stars. Mokslas Publishers, Vilnius
- Turner (1989) Turner D.G., 1989, 1989, AJ, 98, 2300
- Van der Hucht (2001) Van der Hucht K.A., 2001, New Astron. Rev., 45, 135