Resolving the optical emission lines of Ly blob ‘B1’ at : another hidden quasar
Abstract
We have used the SINFONI near-infrared integral field unit on the VLT to resolve the optical emission line structure of one of the brightest ( erg s-1) and nearest () of all Ly blobs (LABs). The target, known in the literature as object ‘B1’ (Francis et al. 1996), lies at a redshift where the main optical emission lines are accessible in the observed near-infrared. We detect luminous [O]Å and H emission with a spatial extent of at least kpc (). The dominant optical emission line component shows relatively broad lines (600–800 km s-1, FWHM) and line ratios consistent with AGN-photoionization. The new evidence for AGN photo-ionization, combined with previously detected C and luminous, warm infrared emission, suggest that B1 is the site of a hidden quasar. This is confirmed by the fact that [O] is relatively weak compared to [O] (extinction-corrected [O]/[O] of about 3.8), which is indicative of a high, Seyfert-like ionization parameter. From the extinction-corrected [O] luminosity we infer a bolometric AGN luminosity of erg s-1, and further conclude that the obscured AGN may be Compton-thick given existing X-ray limits. The large line widths observed are consistent with clouds moving within the narrow line region of a luminous QSO. The AGN scenario is capable of producing sufficient ionizing photons to power the Ly, even in the presence of dust. By performing a census of similar objects in the literature, we find that virtually all luminous LABs harbor obscured quasars. Based on simple duty-cycle arguments, we conclude that AGN are the main drivers of the Ly in LABs rather than the gravitational heating and subsequent cooling suggested by cold stream models. We also conclude that the empirical relation between LABs and overdense environments at high redshift must be due to a more fundamental correlation between AGN (or massive galaxies) and environment.
Subject headings:
galaxies: high-redshift — galaxies: evolution — galaxies: active — galaxies: halos1. Introduction
The nature of the large, spatially extended regions of luminous line emission found around many types of active galactic nuclei (AGN) at both low and high redshifts (e.g., radio galaxies, quasars and Seyferts) have been studied for over three decades (e.g. Heckman et al., 1982; Tadhunter et al., 1986; Baum & Heckman, 1989; McCarthy et al., 1987; Fu & Stockton, 2009). More recently, qualitatively similar structures were found also toward other lines of sight that are not (or, at least, not obviously) associated with luminous AGN (e.g. Francis et al., 1996; Steidel et al., 2000; Prescott et al., 2008; Erb et al., 2011). These nebulae, often referred to as Ly halos or “blobs”, are most conspicuous at the redshifted wavelength of Ly, reaching sizes of order 100 kpc and line luminosities of erg s-1 (up to kpc and erg s-1 for some high redshift radio galaxies, HzRGs).
For the origin of the Ly emitting gas as well as its main source of ionization there are as many theories as there are Ly blobs (LABs). Their rarity and association with large amounts of warm, ionized gas suggests a link with massive galaxy assembly, with the Ly either tracing the giant gas reservoir from which the galaxy is being formed, or the gas that has been expelled by the subsequent superwind from a starburst or AGN. Many radio-quiet LABs show evidence for the presence of an AGN (e.g. Francis et al., 1996; Basu-Zych & Scharf, 2004; Chapman et al., 2004; Dey et al., 2005; Scarlata et al., 2009; Geach et al., 2009; Yang et al., 2009; Colbert et al., 2011), as well as obscured starbursts (Geach et al., 2005; Colbert et al., 2011) and outflowing superwinds (e.g. Bower et al., 2004; Wilman et al., 2005; Weijmans et al., 2010). The LAB phenomenon has also been connected to the popular ‘cold flow’ model of galaxy formation, in which the Ly is largely powered by collisionally excited H in filamentary streams leading to the object (e.g. Fardal et al., 2001; Dijkstra & Loeb, 2009). While these predictions are consistent with some of the main blob phenomenology such as their luminosity (function) and morphologies, these models are difficult to test empirically in the presence of heavy star-formation, dust, outflows, merging, or AGN. Also, some LABs show relatively high metallicities or metallicity gradients, indicating that at least the central gas has already been enriched (Francis et al., 1996; Overzier et al., 2001).
In the Ly halos associated with radio galaxies, the Ly line emission is predominantly powered by photo-ionization from an AGN, often with a smaller contribution from shock waves associated with radio jets (e.g. Humphrey et al., 2008). The main arguments in favor of AGN photoionization are the biconical morphologies of the emission line gas observed in some sources, the energetics and line ratios of the extended emission, and the presence of emission line gas well beyond the radio structure (e.g. McCarthy et al., 1990; Villar-Martin et al., 1997; Villar-Martín et al., 2002, 2003; Best et al., 2000; Humphrey et al., 2008). In addition to this, shocks are often invoked to explain the highly perturbed gas motions, shock-like line ratios, high gas temperatures, and energetics of the extended emission most closely associated with the radio structures or in regions well beyond the photoionizing volume (e.g. Dopita & Sutherland, 1995; Villar-Martín et al., 1999; Solórzano-Iñarrea et al., 2001; Nesvadba et al., 2007a; Humphrey et al., 2008). A fraction of HzRGs at have exceptionally luminous Ly halos best explained by an additional source of ionizing photons (besides the AGN) that must originate from star formation taking place on scales of tens of kpc throughout the halo (e.g. Pentericci et al., 1998; Villar-Martín et al., 2007a; Hatch et al., 2008). These starbursts sometimes produce powerful outflows that eject energy into the surrounding gas (Zirm et al., 2005), analogous to the strong starburst-driven outflows observed in some LABs.
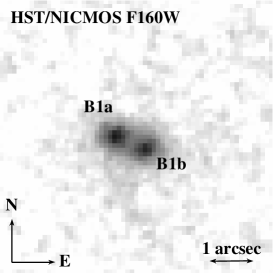
In this Paper we study the LAB J2143–4423 (‘B1’) at discovered by Francis et al. (1996). B1 has a Ly luminosity of erg s-1 (Francis et al., 1996; Palunas et al., 2004). B1 is also a luminous mid-IR source ( mJy at 24 m), possibly with polycyclic aromatic hydrocarbon (PAH) emission detected at 7.7 m and substantial underlying continuum (Colbert et al., 2006, 2011). This may suggest that B1 harbors an obscured starburst (star formation rate of 420 yr-1 ), as well as an obscured AGN (Colbert et al., 2011). The object is radio-quiet with a (3) upper limit on its radio flux of 3.3 mJy (Francis et al., 1996). Francis et al. (2001) identified two red galaxies separated by a projected 8 kpc near the peak111The exact location of the peak Ly emission with respect to the galaxies is hard to determine as the Ly centroid changes as a function of resolution and smoothing scale. If measured at arcsec resolution the peak lies about 1″ South of the galaxies, while it moves North at larger smoothing scales. At HST resolution, a Ly point source is detected coinciding with the easternmost galaxy, but this point source only contains % of the total Ly flux of B1 (Francis et al., 1996, 2001). of the Ly emission of B1 (see the left panel of Fig. 1). Lower surface brightness Ly emission appears to follow a faint rest-frame UV filament that extends a few arcseconds to the South of the galaxy pair. Although the source is not detected in the X-rays (see Colbert et al., 2011), it has a significant detection222The exact location of the C emission is uncertain. Francis et al. (1996) state that C coincides with the peak of Ly, while Francis et al. (2012) argue that the C comes from the ‘southern end of B1’ on the basis of the same 1996 data. in C (, Francis et al., 1996). An interpretation of the entire system was given by Francis et al. (2012), who suggested that the Ly (and C ) emission in B1 could be powered by shocks produced at the interface between a hot central medium and numerous infalling cold clouds, disfavoring the AGN interpretation.
Here, we present an analysis of observations of the main rest-frame optical emission of B1, performed with the Spectrograph for Integral Field Observations in the Near Infrared (SINFONI). The structure of the Paper is as follows. We first describe our data and methods of analysis (Section 2). We then perform an analysis of the two-dimensional and integrated spectra (Section 3), followed by a discussion of the results (Section 4). We use a cosmology in which the angular scale at amounts to 8.0 kpc arcsec-1 ( km s-1 Mpc-1, , ).
2. Data and Analysis Methods
We have observed B1 using SINFONI on the VLT in service mode333Proposal ID: 081.A–0604(A) in July 2008. We used the seeing-limited mode giving a pixel scale of and a field of view of 8″8″. Because the lines are faint, sky or ‘off’ frames taken only once per 1 hr Observation Block (OB) were scaled and subtracted using the object-free regions of the dithered science or ‘on’ frames. We obtained 24/6 ‘on’/‘off’ frames of 600 s each in and , and 43/13 ‘on’/‘off’ frames of 300 s each in . The total science exposure time was 4 hr in each of and , and 3.6 hr in . The data are calibrated following the procedures described in Nesvadba et al. (2008). In brief, the frames are corrected for dark current and flat-fielded. The absolute positions of each slitlet are determined based on the standard SINFONI calibration data. The curved spectra are rectified and wavelength calibrated based on arc spectra. At each wavelength, the sky frames are subtracted from the science frames after normalizing the sky to the average measured in the object frame. For each OB, the calibrated frames are spatially aligned based on the astrometry recorded in the headers, and a final combined data cube is constructed after aligning the data from each OB based on a cross-correlation of the line images. We perform a telluric correction and a flux-calibration based on standard star observations.
In order to limit the effects from the sometimes substantial sky residuals, some sigma clipping was performed in post-processing. An object mask was generated by fitting the main emission lines ([O] 5007 in and H in ) and masking out each pixel with a detection. Low and high values were rejected and the mean value of the unmasked region was used for an additional background subtraction. In the analysis below, before fitting individual pixels the data cubes were convolved with a (FWHM) pixel Gaussian along the spatial axes, and with a Gaussian filter having a FWHM equal to the instrumental resolution (approximately 6.7Å in , 5.7Å in , and 4.9Å in ) along the dispersion axis. Integrated spectra extracted from larger regions were only convolved along the dispersion axis. The [O]3726,3729 line doublet in was fitted as a single Gaussian emission line, based on signal-to-noise (S/N) and spectral resolution considerations. Groups of emission lines (H and [O]4959,5007 in , and H and [N]6548,6584 in ) were fitted using a series of single Gaussians plus a continuum. The flux ratios of the [O] and [N] line doublets were fixed to the expected 1:3 ratio, and their widths were forced to be equal. The final object mask based on all detections of the brightest and cleanest line ([O] 5007) is shown in the right panel of Fig. 1.
| Line | Fluxa | FWHMb | |
|---|---|---|---|
| B1 North | |||
| [O]3727c | |||
| H | – | – | |
| [O]4959 | |||
| [O]5007 | |||
| H | |||
| [N]6549 | |||
| [N]6584 | |||
| [S]6718,6732 | |||
| B1 South | |||
| [O]3727c | |||
| H | – | – | |
| [O]4959 | |||
| [O]5007 | |||
| H | |||
| [N]6549 | – | – | |
| [N]6584 | – | – | |
a Flux is given in units of 10-16 erg s-1 cm-2.
b FWHM is given in units of km s-1.
c The redshift, flux, and FWHM values given here are those obtained by fitting the [O]3726,3729 doublet with a single Gaussian line. The FWHM should be divided by in order to get the intrinsic velocity dispersion.
d A upper limit on the H flux is calculated by
assuming that H has the same line width as [O] and a peak
height equal to measured in the
spectral region near H.
e A upper limit on the [N] 6584 flux is
calculated by assuming that [N] has the same line width as H and a peak height equal to measured in the
spectral region near [N] 6584. The corresponding upper
limit on [N] 6549 is calculated by assuming that
the line flux is 1/3 of that of [N] 6584.
3. Results
3.1. Measurements
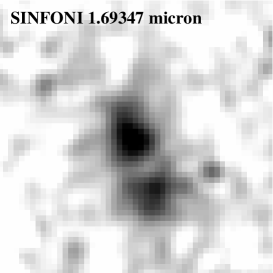
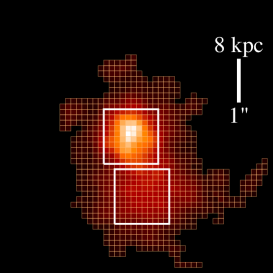
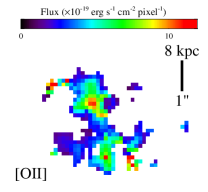
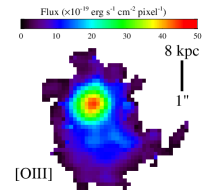
We obtained good, spatially resolved detections of [O] in , [O] in , and the H and [N] line complex in . We also obtained a possible detection in of the [S] 6716,6731Å doublet, but we note there are significant sky residuals in this part of the spectrum that complicate the analysis. In the middle panel of Fig. 1 we show a 1.693 m channel map indicating the morphology of the [O] 5007Å line relative to the continuum morphology from HST (left panel). Although the absolute registration of the SINFONI data with the images proved somewhat problematic, the region of strongest [O] emission roughly coincides with the location of the two galaxies detected with NICMOS. Because these galaxies are approximately 1″ (8 kpc) apart, they are likely not, or only barely, resolved within our ″ seeing. A secondary, similarly sized but fainter component of B1 lies to the South. We believe that this region coincides with the Southern extension seen in Ly as well as in faint rest-UV continuum and termed the ‘blue filament’ in Francis et al. (2012). In this paper, we will refer to these two main optical emission line regions as ‘B1 North’ and ‘B1 South’, respectively. The regions are surrounded by a much more extended region of diffuse line emission ( per pixel in [O] 5007) measuring about ( kpc), as shown in the right panel of Fig. 1.
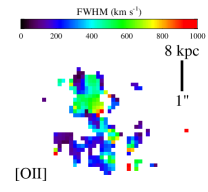
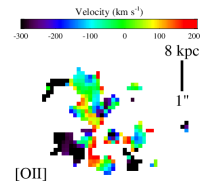
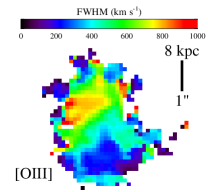
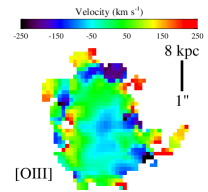
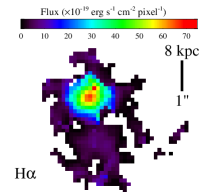
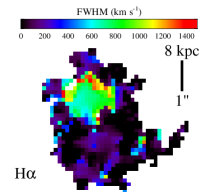
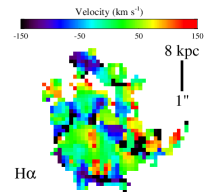
The spatially resolved [O], [O], and H emission line maps are shown in Fig. 2. The bright region associated with B1 North has a velocity dispersion of order 800 km s-1 (FWHM), seen both in [O] and H (middle panels). B1 South is associated with much smaller line widths of several hundred km s-1 (FWHM). The velocity shears across B1 are small for all lines, indicating that the motions are unordered or that we are seeing the source face-on. The velocities range from to km s-1 (relative to the redshift at the peak of [O] in B1 North) with some higher and lower velocity regions mostly in the low S/N pixels on the outskirts. Weak [O] emission is concentrated on B1 North, with a possible extension to B1 South seen at low S/N.
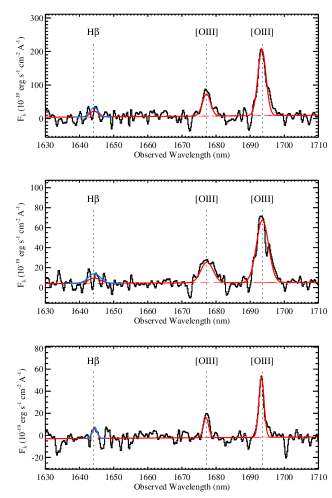
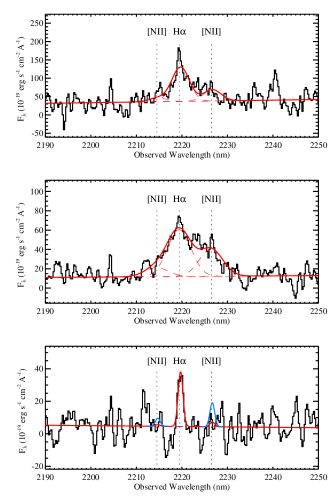
We extracted integrated spectra from two apertures centered on B1 North and South (the apertures are indicated in the right-hand panel of Fig. 1), as well as from the entire B1 region detected in [O] 5007 at . The spectra are shown in Fig. 3. The complex line width profile seen across B1 somewhat complicates the interpretation of the spectrum integrated over the entire B1 region (top panels) due to the mixing of the relatively broad lines of B1 North (middle panels) with the much narrower lines in B1 South (bottom panels). In the remainder, we will therefore consider the B1 North and South regions separately. The results of our emission line measurements for B1 North and South are summarized in Table 1.
The [O] lines in B1 North have a FWHM of km s-1 and a total [O] flux of erg s-1 cm-2 at an average redshift of . Due to the relatively large line widths involved, the line complex around H (righthand panels in Fig. 3) is difficult to disentangle. If we force the line widths of H and [N] to be equal to each other, we find km s-1 (FWHM). If we relax this constraint the H line width is increased by about 100 km s-1. An alternative explanation of the complex H line profile in B1 North is that instead of the [N] line doublet we are seeing multiple velocity components of H. The two secondary peaks seen redward of the peak in H would then have to be offset by about 500 and 1000 km s-1. However, the fact that the line widths of [O], H, and [N] are all roughly equivalent is good evidence for the presence of [N]. Also, we do not see any additional velocity components in [O], our strongest line. If we adopt our H and [N] interpretation (rather than multiple H peaks), we find a total H flux of erg s-1 cm-2 at a redshift consistent with that of [O].
The lines are significantly narrower in B1 South (bottom panels of Fig. 3). The [O] and H line widths are and km s-1, respectively. We do not detect [N] in this region. In neither of the two regions did we detect H. This is consistent with Francis et al. (2001) who did not detect any excess flux in the NICMOS narrow-band filter F164N that covers H. By assuming that H has the same width as [O] and a peak flux twice the rms measured in the spectral region near H, we determine upper limits of and erg s-1 cm-2 for B1 North and South, respectively. Following the same method, we obtained upper limits on the [N] line fluxes in B1 South (assuming a line width similar to H).
With these line flux measurements, we can now also directly calculate the emission line contribution to the broad-band fluxes presented in Francis et al. (2001). We find that the contributions due to [O] and H+[N] amount to 18% in and % in , respectively, in reasonable agreement with the estimates of % of Francis et al. (2001).
The observed (i.e. not extinction-corrected) [O]5007 luminosity of B1 North is erg s-1, and the total (observed) [O] luminosity of B1 as a whole is erg s-1. This is at the high end of the range of [O] luminosities found for LAEs and LBGs at (e.g. Teplitz et al., 2000; Pettini et al., 2001; Maschietto et al., 2008; Kuiper et al., 2011; McLinden et al., 2011). In order to calculate the intrinsic [O] luminosity of B1 North, we need to correct for dust extinction. We measure a 3 lower limit on the total extinction based on the Balmer decrement F(H)F(H)4.13 (, 2), implying a nebular extinction of E(B–V)0.34 (0.71, 2), and a extinction-corrected luminosity of erg s-1 ( erg s-1, 2).
3.2. Line ratios and line widths
The new measurements of the main optical emission line ratios allow us to investigate what is the main source of ionization in B1. In Fig. 4 we show the [N]/H vs. [O]/H diagnostics diagram designed to distinguish between sources in which the main source of ionizing radiation is the UV emission from hot young stars and from AGN (Baldwin et al., 1981; Veilleux & Osterbrock, 1987). In this diagram, star-forming galaxies tend to lie to the left of the dashed line which separates sources with and without Seyfert- or LINER-like characteristics (Kauffmann et al., 2003). The solid line further aims to separate galaxies of mixed or composite spectral type from those that are pure AGN-like (Kewley et al., 2006). The values obtained for B1 North and South are indicated by the blue and red circles. For non-detections of H we have used the upper limit for B1 North, and the intrinsic Balmer ratio of H/H2.8 for B1 South. For B1 South we furthermore used the upper limit on [N]. Both regions of B1 lie in the AGN-dominated region of the diagram.
Unfortunately, the double limits on B1 South prohibit us of making strong conclusions about this region, due to the non-detections of both H and [N]. Although the line ratios of B1 South are consistent with those of B1 North, the dominant source of ionization could, besides an AGN, be a starburst given that we only have an upper limit on the [N]/H line ratio. The high [O]/H then implies that it is a very low metallicity starburst (see Kewley et al., 2001). We consider this somewhat unlikely, however, given that the [N]/H measured from integrated spectra of star-forming galaxies are typically higher than those seen in pure H regions due to ionized material in a diffuse component (Lehnert & Heckman, 1994), and B1 South covers a significant region of diffuse emission. In our discussion below, we will focus our attention on B1 North (the region with the strongest line emission and the largest line widths), but we note that our results would not change significantly if instead we had performed our measurements over both regions or integrated over the entire region of B1.
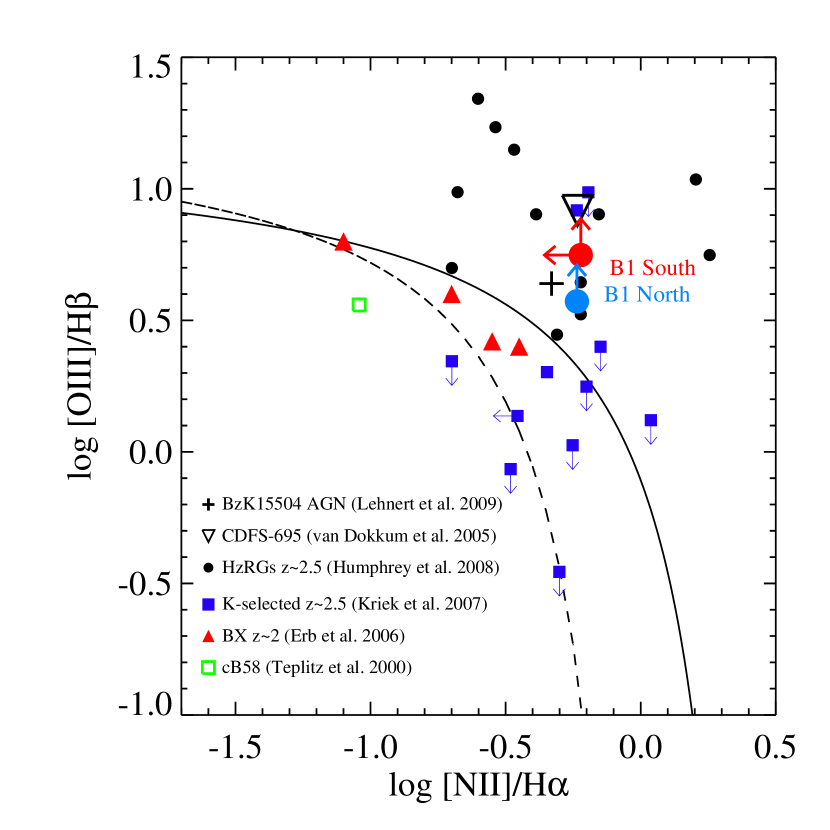
The relatively large values found for the line ratios in B1 North are inconsistent with stellar photoionization, and indicative of photoionization by an AGN. B1 North has line ratios that are very similar to, for example, the massive AGN-hosting starburst galaxy from Lehnert et al. (2009), or the population of radio galaxies from Humphrey et al. (2008). The AGN-interpretation is confirmed by the rather weak [O] emission. The (3) lower limit on the extinction-corrected [O] luminosity is erg s-1, implying a extinction-corrected [O]/[O] ratio of 3.8. This line ratio is a sensitive diagnostic of the ionization parameter, and efficiently separates Seyfert-like objects from star-forming galaxies and LINERS at low redshift (Kewley et al., 2006). Although we do not have any constraints on [O]/H that could further separate the AGN from star-forming and composite galaxies, at an [O]/[O]1 the main ambiguity is between Seyferts and the rather rare class of very low metallicity starbursts. While such low metallicity starbursts (and corresponding high [O]/[O] ratios) are common among the population of LBGs and LAEs at high redshift (Nakajima et al., 2012), B1 is a large, dusty, and high-metallicity source that is very different from such high redshift galaxies.
In principle, shocks offer an alternative possibility for the line ratios in B1 North. Shocks would also be consistent with the broad line widths of 800 km s-1 observed. However, the discrimination between shocks and AGN photoionization is a longstanding problem in astrophysics, even when multiple UV and optical emission lines are available. With just the three line ratios detected in B1, a quantitative distinction is just not possible. Comparing the extinction-corrected line ratios to photo- and shock-ionization model predictions presented in Humphrey et al. (2008), we conclude that B1 North lies in the region of line ratios where power law photoionization and shock-precursor models overlap. This means that photoionization (either from the shock precursor or from the AGN) rather than collisional excitation due to the shocks dominates the excitation of the gas.
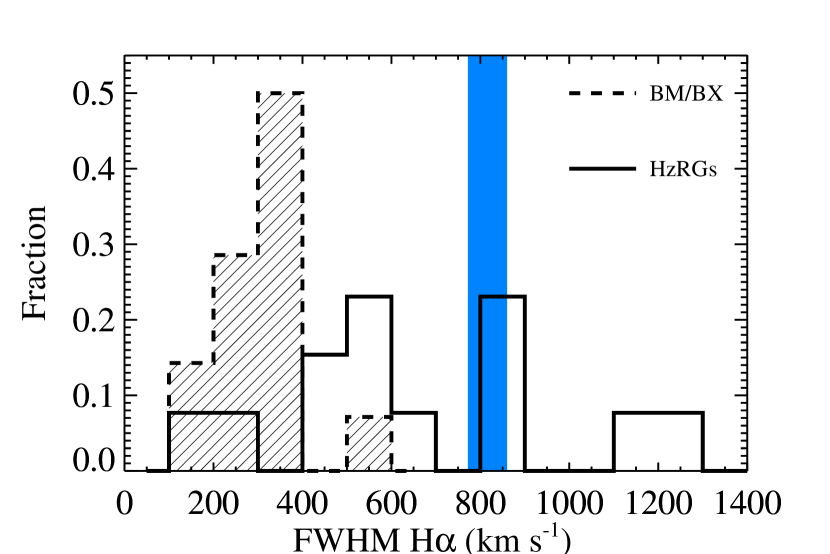
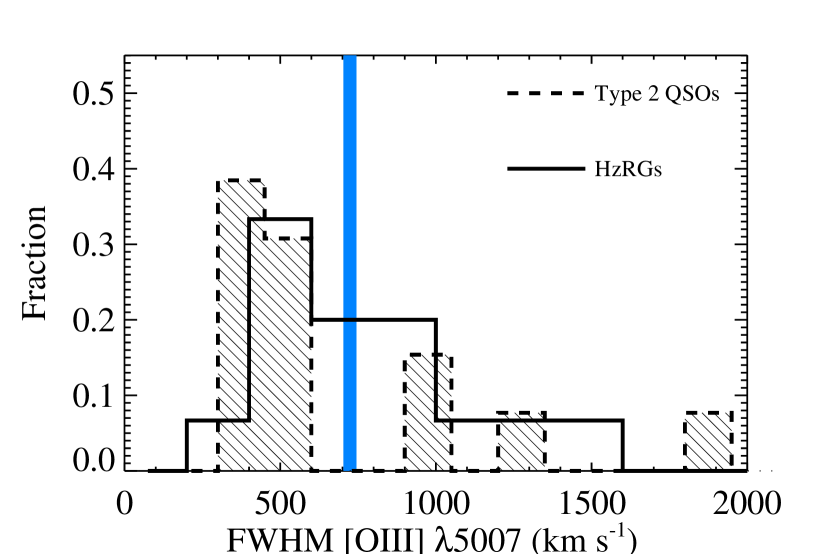
In Fig. 5 we compare the widths of H and [O] with those of star-forming galaxies and AGN. For H, we compare with the distribution of FWHM as measured for star-forming galaxies by Förster Schreiber et al. (2006), and for HzRGs by Humphrey et al. (2008) (top panel). The line widths of B1 North are much larger than those found for typical galaxies, and more comparable to those of HzRGs. The [O] width can be compared to the distributions measured for the sample of Type 2 quasars at studied by Villar-Martín et al. (2011) and the HzRGs from Humphrey et al. (2008) (bottom panel). The kinematics of B1 North are again similar to the mean line widths observed for HzRGs. It is interesting to note that the narrow lines of Type II QSOs reach similar line widths as those of HzRGs, implying that large turbulent motions exist even in sources without strong radio jets. Could the large velocity dispersions and large line ratios be explained by shocks arising from a starburst superwind? This is highly unlikely given that the ratio of mechanical to bolometric energy output from a continuously star-forming galaxy is small on a dynamical time scale (Leitherer et al., 1999; Le Tiran et al., 2011), and thus we would expect to see the H region-like emission on some scale in B1, which is not seen.
As we will show below, the simplest scenario that explains most or all of the properties of B1 is photoionization by a luminous obscured quasar.

3.3. Evidence for a luminous, obscured AGN
The C emission, the AGN-like line ratios, and the relatively high (compared to typical starburst galaxies) velocity dispersions suggest that B1 North hosts a luminous AGN. Let us consider the situation in which the dominant source of ionization is indeed a hidden quasar. Because the BPT line ratios of B1 are consistent with photo-ionization by an AGN, in this scenario we can safely ignore the contribution from strong ionizing radiation fields due to star formation, and thus use the [O] luminosity as a direct proxy for the bolometric luminosity of the quasar. Heckman et al. (2004) find that with a scatter of 0.38 dex. Using the observed (i.e. not extinction-corrected) luminosity of B1 North we find erg s-1. Alternatively, Lamastra et al. (2009) derived that , where is the luminosity corrected for extinction based on the Balmer decrement and the constant was determined for AGN having a extinction-corrected [O] luminosity of 1042-44 erg s-1. This gives erg s-1. Both estimates would thus imply the presence of a luminous quasar (e.g. Lamastra et al., 2009; Harrison et al., 2012; Kim et al., 2013).
The source has a significant rest-frame 8 m luminosity of (Colbert et al., 2006), previously attributed to dust heated by a possible obscured AGN (Colbert et al., 2006) (a conclusion later disfavored by Francis et al. (2012)). Scaling from the 8 m luminosity gives assuming the source is an AGN or starburst-AGN composite (Wu et al., 2010). An obscured QSO is also consistent with the limits at longer infrared wavelengths, assuming that our hidden quasar has a spectral energy distribution similar to, e.g., Mrk 231, a local ULIRG with a QSO-like spectrum (see Fig. 6).
B1 has not been detected in the X-rays. Francis & Williger (2004b) placed a limit on the hard X-ray flux of erg cm-2 s-1, corresponding to a rest-frame luminosity of erg s-1 assuming no absorption. A quasar having a bolometric luminosity of a few times erg s-1 should have an X-ray luminosity of erg (Lamastra et al., 2009), at least 23 higher than that observed. The non-detection in the X-ray suggests that the quasar is optically-thick (or even Compton-thick, if the intrinsic X-ray luminosity is higher than the upper limit).
3.4. Limits on star formation
What is the role of star formation in the B1 emission line nebula? A relatively unbiased SFR measurement can perhaps be made best in the far-infrared (FIR), regardless of whether an AGN is present or not (Alexander et al., 2005; Menéndez-Delmestre et al., 2009). As mentioned, the source has a significant rest-frame 8 m luminosity of (Colbert et al., 2006), implying (Wu et al., 2010). The only longer wavelength constraint available in the literature is a flux density of 2.3 mJy at 870 m obtained for a stack of several LABs (Beelen et al., 2008), implying at a rest-frame of about 260 m. In addition, we have used archival Herschel/PACS data of B1, finding that it is not detected in any of the PACS channels. We derive upper limits (5) of 9.9, 13.6, and 21.3 mJy at 70, 100, and 160 m, respectively. As shown in Fig. 6, we can thus rule out IR luminosities of , based on the PACS limits as well as the 870 m constraint. In Fig. 6 we have indicated the spectral energy distribution of Mrk 231, a local ULIRG with a QSO-like spectrum, scaled to the rest 8m luminosity of B1 (thick solid line). While such an obscured QSO spectrum is consistent with the PACS limits, B1 may require an additional contribution from cold dust heated by star formation to explain the rest 260 m emission. Ignoring the QSO contribution at this wavelength (expected to be lower), and interpreting the cold dust detection as a measure of star formation, we estimate a SFR of 570 yr-1 for a Salpeter IMF (380 yr-1 for a Kroupa IMF). Because this ignores any AGN contribution, we consider this an upper limit, and note that B1 is consistent with having no star formation at all.
4. Discussion
4.1. B1 as an AGN-powered Ly blob
The scenario in which B1 hosts a luminous AGN is consistent with most of its observed properties. Its overall spectral characteristics are, in fact, very similar to those of other luminous, obscured quasars at high redshift (e.g. Nesvadba et al., 2011; Harrison et al., 2012; Kim et al., 2013). The [O] luminosity is comparable to that of the powerful obscured quasars SWIRE J022513.90–043419.9 (SW022513) and SWIRE J022550.67–042142 (SW022550) at studied by Nesvadba et al. (2011) and Polletta et al. (2011). Both QSOs are Compton-thick (Polletta et al., 2008). The SWIRE QSOs have narrow line region [O] line widths of order 1000 km s-1 (FWHM), and the [O] emission in SW022513 extends out to at least 10 kpc, consistent with that of B1 North. The line ratios, and the [O] size and luminosity are also similar to those of the extended emission line regions observed around low redshift quasars (e.g. Fu & Stockton, 2009; Villar-Martín et al., 2011). In fact, narrow line regions of around 10 kpc are typical of luminous obscured quasars, while regions of up to several tens of kpc are characteristic for the most luminous high redshift QSOs with strong [O] emission (Netzer et al., 2004). The narrow line regions are also often asymmetric (e.g. Lehnert et al., 2009; Nesvadba et al., 2011), which may come as no surprise given that most likely there are strong gradients in the local ionizing radiation field due to the high extinction by dust.
Now that we have found evidence for an extremely luminous hidden quasar we can finally attempt to estimate the number of ionizing photons available to power the observed Ly nebulosity of erg s-1 in the scenario in which the hidden quasar is the main source of ionizing power. In Sect. 3.3 we estimated that erg s-1. We calculate the ionizing luminosity from 200–912Å by assuming a typical radio-quiet quasar spectrum of the form with for log() in the range 9–15 and for log() in the range 15–19 (Richards et al., 2006). The total ionizing luminosity is then erg s-1, sufficient to provide a luminosity of erg . Here we have assumed that the fraction of ionizing photons that will cascade to Ly photons is 68% (case B recombination). Although this number exceeds the actual amount of ionizing radiation likely to be available due to the absorption by dust by a factor of , our hidden quasar scenario still appears to be more than sufficient to power the nebula even without the aid of additional ionizing photons from, e.g., star formation.
Galaxies that have SFRs large enough to provide sufficient ionizing photons to power the Ly luminosities observed in LABs are typically heavily obscured SMGs. In these galaxies, the large amounts of dust will prohibit significant escape of Ly photons, although Ly has been detected in a number of cases, presumably due to strong spatial variations in the dust coverage (Chapman et al., 2003, 2004). Powerful obscured quasars such as the one we discovered in B1, offer an additional ionizing radiation field that is two orders of magnitude larger than that required by the observed Ly. This means that, even for the same escape fraction, they can power luminous LABs despite them often being dusty objects as well.
| ID | Redshift | log | sizea | Notesb | Referencesc |
| (erg s-1) | (kpc) | ||||
| Ly blobs | |||||
| SSA22–Sb1–LAB1 | 3.10 | 44.0 | 175 | (Type II AGN; detected in X-ray stack) | G09 |
| SSA22–Sb3–LAB1 | 3.10 | 44.3 | 126 | RQ-QSO; broad lines | S07, M11 |
| LAB1709+5913 | 2.83 | 44.3 | 95 | –d | Sm07, Sm08 |
| SST24J1434110+331733 | 2.66 | 44.2 | 160 | Type II AGN; narrow C , He , power-law SED | D05 |
| AMS05 | 2.85 | 44.2 | 80 | Type II AGN; strong 24 m | Sm09 |
| LAB1_J2143–4423 (B1) | 2.38 | 43.9 | 137 | Type II AGN; narrow C , BPT | F96, C06, C11, This paper |
| CDFS-LAB01 | 2.3 | 43.9 | 60 | (Type II AGN; narrow C , He ) | Y10, Y11 |
| LAB6_J2143–4423 (B6) | 2.38 | 43.8 | 64 | Type II AGN; narrow He , power-law SED | Sc09,C11 |
| LAB5_J2143–4423 (B5) | 2.38 | 43.8 | 56 | –d | C11 |
| SSA22–Sb1–LAB2 | 3.09 | 43.8 | 157 | Type II AGN; X-ray | BS04 |
| SSA22–Sb6–LAB1 | 3.10 | 43.8 | 166 | –d | M11 |
| SSA22–Sb1–LAB3 | 3.10 | 43.7 | 103 | Type II AGN; X-ray | G09 |
| GOODS-N–LAB1 | 3.08 | 43.7 | 124 | RQ-QSO; broad lines, X-ray | B02, M11 |
| 53W002-Object 18 | 2.39 | 43.7 | 40 | Type II AGN; narrow N , C , He | P96, K99 |
| Yang–LAB3 | 2.32 | 43.7 | 61 | Type I AGN; broad C , X-ray | Y09, G09 |
| PRG1 | 1.67 | 43.7 | 56 | (Type II AGN; narrow C , He , C ) | P09 |
| Radio Galaxiese | |||||
| MRC 1138–262 | 2.16 | 45.4 | 250 | Radio Galaxy | V07 |
| 4C41.17 | 3.80 | 45.2 | 190 | Radio Galaxy | R03 |
| 4C60.07 | 3.79 | 45.1 | 68 | Radio Galaxy | R03 |
| BRL 1602–174 | 2.04 | 44.9 | 90 | Radio Galaxy | V07 |
| B2 0902+34 | 3.39 | 44.8 | 80 | Radio Galaxy | R03 |
| TN J1338–1942 | 4.11 | 44.7 | 130 | Radio Galaxy | V07 |
| 3C 294 | 1.79 | 44.5 | 170 | Radio Galaxy | M90 |
| TN J2009–3040 | 3.16 | 44.5 | 40 | Radio Galaxy | V07 |
| MRC 1558-–003 | 2.52 | 44.5 | 84 | Radio Galaxy | VM07 |
| MRC 0943–242 | 2.92 | 44.4 | 50 | Radio Galaxy | V07 |
| MRC 2025–-218 | 2.63 | 44.2 | 55 | Radio Galaxy | VM07 |
| MRC 0052–241 | 2.86 | 43.9 | 35 | Radio Galaxy | V07 |
| MRC 2048–272 | 2.06 | 43.8 | 70 | Radio Galaxy | V07 |
| MRC 0316–257 | 3.13 | 43.8 | 35 | Radio Galaxy | V07 |
| Quasars | |||||
| Heckman et al. Sample | RL-QSO | H91 | |||
| SDSS J21474–0838 | 4.59 | 44.3 | 51 | RQ-QSO | N12 |
| Q1425+606 | 3.204 | 43.9 | 34 | RQ-QSO | C06 |
| Q1759+7539 | 3.049 | 43.9 | 60 | RL-QSO | C06 |
a Major axis size.
b Notes are as follows. Type II AGN: evidence of an
obscured AGN, Type I AGN: evidence of an unobscured AGN, –: no
evidence of AGN, QSO: optically-or radio selected
QSO (RL-QSO: Radio-loud QSO, RQ-QSO: Radio-quiet QSO). For objects for which the identification is unclear the type
is given in parentheses.
c References. F96: Francis et al. (1996), C06: Colbert et al. (2006), C11:
Colbert et al. (2011), Sc09: Scarlata et al. (2009), G09: Geach et al. (2009),
BS04: Basu-Zych & Scharf (2004), M11: Matsuda et al. (2011), S07:
Shen et al. (2007), D05: Dey et al. (2005), Sm07: Smith & Jarvis (2007), Sm08: Smith et al. (2008), Sm09: Smith et al. (2009), P96:
Pascarelle et al. (1996), K99: Keel et al. (1999), Y09: Yang et al. (2009), Y10:
Yang et al. (2010), Y11: Yang et al. (2011), P09: Prescott et al. (2009), V07:
Venemans et al. (2007), VM07: Villar-Martín et al. (2007b), R03:
Reuland et al. (2003), M90: McCarthy et al. (1990), Chr06:
Christensen et al. (2006), N12: North et al. (2012), H91: Heckman et al. (1991).
d No classification given either indicates no
evidence of an AGN or no AGN diagnostics available.
e It is important to note that this subset of well-studied HzRGs
occupies the high end of the ranges in Ly luminosity and major axis
size of the general population of high redshift radio galaxies.
4.2. Luminous Ly blobs harbor luminous Type II AGN
We have shown that (i) B1 harbors an extremely luminous obscured (i.e. Type II) quasar, (ii) only a few percent of the bolometric luminosity is sufficient to power the observed Ly line luminosity of erg s-1, and (iii) the extended narrow line region is not unlike that observed toward other quasars at high redshift. The significance of this new finding becomes particularly clear when we perform a census of other Ly blobs (LABs) found in the literature. Here, we will limit ourselves to the class of truly powerful objects having erg s-1 and sizes of order 50-100 kpc in order to avoid the far more common population of lower luminosity and smaller Ly emitters for which the energy sources become much more ambiguous. The results of our census are summarized in Table 2, with details on the selected targets as follows:
1. Several LABs were found as part of the same J2142–4423 “proto-cluster” that includes B1 studied in this paper. Strong evidence for B1 as a powerful obscured AGN is presented in this paper. The second brightest object (B6) hosts a Type II AGN as well (Scarlata et al., 2009). There is no evidence to date that B5 contains an AGN (Colbert et al., 2011).
2. There are five extended LABs in the SSA22 protocluster at (Steidel et al., 2000) that fulfill our criteria (SSA22–Sb1–LAB1, SSA22–Sb1–LAB2, SSA22–Sb1–LAB3 using the nomenclature of Matsuda et al. (2011). SSA22–Sb1–LAB2 and SSA22–Sb1–LAB3 have been identified as obscured AGN (Basu-Zych & Scharf, 2004; Geach et al., 2009; Webb et al., 2009). SSA22–Sb1–LAB1 may host a heavily obscured AGN as well based on the detection in a stack of X-ray images of several undetected blobs (Geach et al., 2009), but we list it as ambiguous in Table 2.
3. Matsuda et al. (2011) performed a large-area narrow-band search targeting several fields. By expanding the area around the above-mentioned SSA22 structure, they found two more luminous extended LABs: SSA22–Sb3–LAB1 is identified with a luminous optical QSO. SSA22–Sb6–LAB1 is not currently known to harbor any AGN. Another object, GOODS-N-LAB1, was found to be associated with a previously known optical QSO. Because the two LABs associated with QSOs were discovered serendipitously from the narrow-band survey of Matsuda et al. (2011), we have listed these objects here rather than in the QSO section of Table 2.
4. Dey et al. (2005) found a luminous, extended nebula at (SST24J1434110+331733), most likely harboring a dust-enshrouded quasar based on an analysis of the optical-IR spectral energy distribution.
5. Smith & Jarvis (2007) found a LAB in the Spitzer First Look Survey. LAB1709+5913 displays no evidence for either AGN or significant star formation that could explain its luminous Ly nebulosity. Instead, the Ly could originate from the heating and cooling of gas in an accretion flow. Smith et al. (2009) studied a luminous, extended LAB (AMS05) associated with a Type II QSO at in the Spitzer First Look Survey. This LAB is particularly interesting given its resemblance to the Ly halos associated with HzRGs despite the fact that the AGN is orders of magnitude fainter in the radio compared to the FRII sources associated with HzRGs. Similar to B1, the QSO bolometric luminosity is two orders of magnitude higher than that emitted by the Ly photons. If AMS05 would lie at its radio flux at 1.4 GHz would be below the upper limit on the flux of B1 (3.3 mJy, see Francis et al., 1996).
6. Pascarelle et al. (1996) and Keel et al. (1999) have studied a luminous, extended nebula at (53W002-Object 18) showing broad and narrow lines from an AGN. Keel et al. (2002) detected spatially extended [O] emission with a luminosity that is comparable to that of B1.
7. Yang et al. (2009) studied four LABs in the Bootes field, one of which (Yang–LAB3) is luminous enough to fulfill our criteria. This LAB has broad UV emission lines and an X-ray detection indicative of a luminous unobscured AGN (see also Geach et al., 2009). Yang et al. (2010, 2011) studied CDFS-LAB01 at , detecting narrow C and He lines. We tentatively classify this source as a Type II AGN, but list it as ambiguous in Table 2.
8. PRG1 is a LAB showing extended He and weak C and C emission lines (Prescott et al., 2009). The source has not been detected in the X-ray, but the limits are not very strong for typical Seyfert galaxies. The source was not detected at 24m or in the radio. This could be reconciled with the AGN-like FUV line ratios if it hosts a heavily obscured AGN. We tentatively classify this source as a Type II AGN, but list it as ambiguous in Table 2.
9. Luminous, extended Ly nebulae have also been found around quasars. In Table 2 we provide the median values measured for the sample of radio-loud QSOs from Heckman et al. (1991), as well as a number of radio-loud and radio-quiet QSOs studied by other groups (e.g. Christensen et al., 2006; North et al., 2012).
10. Also in Table 2 we list a representative sample of high redshift radio galaxies and properties of their Ly nebulae selected from the literature (e.g. McCarthy et al., 1990; Venemans et al., 2007; Villar-Martín et al., 2007b; Reuland et al., 2003). As already stated in §1 there is overwhelming evidence that the main source of ionization in this class of objects is the photoionization by an obscured AGN. Although HzRGs show a number of extreme phenomena that are typically not seen in their radio-quiet counterparts, these phenomena are almost exclusively found in the close vicinity of the radio jets.
The census of narrow-band selected LABs presented in the top part of Table 2 can be considered a complete sample for luminosities of erg s-1. It is clear that at this high luminosity threshold, the presence of luminous AGN is a common theme among the LABs (10/16 confirmed AGN, 13/16 when including tentative AGN). The luminosities and sizes of the LABs are comparable to those of HzRGs, eventhough the brightest and largest Ly nebulae are always associated with HzRGs. They are also similar to those found near some radio-quiet and radio-loud quasars. While the majority of radio-loud quasars appear to show extended Ly nebulae (e.g. Heckman et al., 1991) with properties that are, on average, very similar to those of the LABs, it is not yet clear whether the same is true for their radio-quiet counterparts due to the relatively small sample sizes (Christensen et al., 2006; North et al., 2012). The detailed comparison between the QSOs and other classes of sources with extended Ly nebulae (e.g. HzRGs and LABs) is particularly difficult because of sample selection, geometric effects, obscuration, and because in QSOs the line-of-sight is dominated by luminous Ly emission from the AGN broad line region. Therefore, the QSOs listed in the third part of Table 2 do not form a complete sample, but they were specifically chosen to illustrate that the basic properties of extended Ly nebulae are comparable among the LABs, HzRGs, and (at least some) QSOs.
If we look at the evidence presented in Table 2, at least 63% (81% when including tentative AGN) of luminous LABs are associated with luminous AGN. These numbers are lower limits because not all LABs have been observed at similar depths or wavelengths. The AGN fraction is thus very high, especially since the AGN duty cycles (the time spent by a black hole in the ‘active’ state) are believed to be relatively short (10-100 Myr). This must mean that Ly surveys always tend to find those objects that are in the active state, and therefore are providing a plentiful supply of ionizing photons to their surrounding gaseous medium. Also, because the AGN duty cycles are short (compared to a galaxy building time scale), the LABs that are visible at any given epoch probably represent a larger population of gaseous halos that are not being actively illuminated, at least not to an extent that would give rise to similar luminosities and sizes as those of the LABs listed in Table 2.
Both the HzRGs and the radio-quiet LABs have been associated with overdense regions in the high redshift large-scale structure (Francis et al., 2001, 2012; Pentericci et al., 1999, 2000; Steidel et al., 2000; Venemans et al., 2002, 2007; Matsuda et al., 2004, 2009; Overzier et al., 2006, 2008; Saito et al., 2006; Miley et al., 2004, 2006; Prescott et al., 2008, 2012; Erb et al., 2011), leading to a popular hypothesis that the LAB phenomenon is perhaps linked to Ly cooling radiation in massive dark matter halos as predicted by theory. However, our census of the most luminous LABs presented above appears to indicate that the primary correlation is that between (luminous) LABs and AGN. Geach et al. (2009) reached a very similar conclusion based on deep X-ray observations of the SSA22 field targeting a great number of extended LAEs discovered by Matsuda et al. (2004). They derived an AGN fraction of at least 17%, but this is considered a strict lower limit as the sample is dominated by sources down to erg s-1 that are X-ray faint. In fact, if indirect evidence for AGN based on IR emission is included, the AGN fraction within the SSA22 field is 30%, and if a higher luminosity cut is placed on Ly to match the selection of Yang et al. (2009), the AGN fraction is 50%. As we have shown, if we increase our Ly luminosity threshold even further, the AGN fraction among all luminous LABs found in the literature approaches 100%. This is consistent with the recent study of Bridge et al. (2012), who studied a population of rare, dusty objects having high IR luminosities and warm IR colors suggestive of intense AGN activity (see also Wu et al., 2012). 90% show Ly in emission, with 37% showing Ly (luminosities erg s-1) extended over 30 kpc, i.e. comparable to the LAB selection criteria of Matsuda et al. (2004, 2011).
If, as we suggest, the primary correlation is between LABs and AGN, then the correlation between LABs and environment could be a secondary one between environment and AGN. The fact that excesses of LABs are primarily found in overdense regions would then simply be due to the fact that overdense regions are overdense in massive galaxies that are more frequently associated with AGN (see also Matsuda et al., 2011). The extra source of ionizing photons provided by these AGN will further boost the correlation for the most luminous LABs, even if some LABs can be powered by ionizing radiation from star-formation alone. A correlation between LABs and environment is also expected in the cold streams models of Dijkstra & Loeb (2009). In these models, the most luminous Ly halos are always associated with cooling radiation from the most massive halos, for which other simulations typically predict that they are host to massive galaxies (and possibly AGN). There is one important difference though. The cosmological cold streams have a duty cycle of 1, much longer than that of the AGN. Therefore, if the LABs were powered by gravitational heating (and subsequent cooling), then we would expect a (significant) fraction of the LABs to be associated with massive halos in which the black hole is inactive. The fact that we find an extremely high fraction of AGN, strongly suggests that the AGN is the main driver of the Ly luminosity in these LABs. Even in the cases where no AGN or extensive star formation is observed, Ly cooling radiation is not the only alternative explanation. In the nearby universe, examples of massive extended clouds with AGN-photoionized line-ratios have been found around galaxies in which the AGN has apparently switched off on short time-scales (Keel et al., 2012), illustrating that episodic AGN activity may need to be considered as well when interpreting high redshift LABs.
Irrespective of what is powering the Ly emission, the photons must be coming from relative cold gas ( K). Given that the LABs are probably associated with massive halos with K, it is not clear what is the source of the spatially extended cold gas. It is still possible that the cold gas originates from within the streams. Faucher-Giguère et al. (2010) computed that the spectrum of ‘gravitionally heated’ cold streams should be double peaked and mostly centered on the systemic velocity. This is different from what is observed in B1. Francis et al. (1996) found that the Ly emission of B1 has an observed width of 600 km s-1, and is redshifted by 490 km s-1 with respect to C . This is similar to the typical offset between Ly and interstellar absorption features (like C ) seen in Lyman Break Galaxies (Shapley et al., 2003). The redshifted Ly emission 444We further note that Ly is also seen in absorption along the line of sight of a background QSO at an impact parameter of 180 kpc. The absorption is unusually broad ( km s-1), and its line center coincides with that of C . suggests that the photons scatter through cold gas in some large-scale outflow (as in e.g. Steidel et al., 2011; Dijkstra & Kramer, 2012). These outflows can explain the level of enrichment of the gas, which may be difficult to maintain if strong cold flows were active. It is interesting to note that our analysis of the optical emission lines showed that although the gas is highly turbulent (velocity dispersions of 800-1000 km s-1), it does not have any apparent large velocity shear. This may hold some clues to the process of AGN feedback. The lack of velocity shears may indicate that radiative-mode feedback from the AGN is not capable of inducing large-scale radial flows. LABs might thus offer good test beds for our ideas about radiative mode AGN feedback and its impact on massive galaxy formation.
If the luminous LAB phenomenon is associated with powerful AGN, we would naively expect that the population of LABs should extend toward much lower redshifts than currently probed by Ly studies, possibly closely following the evolution in the quasar luminosity function. In contrast, Keel et al. (2009) have suggested that LABs may be specific to the high redshift universe, based on their absence in galaxy clusters at . Their study was motivated by the empirical relation between LABs and overdense environments at . However, the highly active and gas-rich environments typical of overdense environments at (“protoclusters”) are far from equivalent to the cores of massive, virialized clusters at that are dominated by large amounts of hot gas. Instead, we propose that luminous LABs at low redshift may still be found in the more typical, lower density, and gas-rich environments of actively accreting galaxies and AGN. Evidence for this exists in the form of extended ionized nebulae ( few tens of kpc in some cases) around radio galaxies and quasars (both radio loud and radio quiet). Although we do not have observations of their Ly, it is expected that they also have extended Ly nebulae, possibly more extended than [O] or H given that it is an intrinsically stronger line (unless heavily absorbed).
It is also possible that the most luminous and extended LABs are only found in the high redshift regime when the cosmological accretion rates of cold gas were highest, providing the source of the gas that is being ionized by the AGN. Zirm et al. (2009) showed that the total luminosities (and sizes) of the Ly halos around HzRGs strongly decline with decreasing redshift, which does not match any change in the total energy output by the AGN as inferred from their radio or X-ray luminosities. The evolution of their Ly halos thus appears to be probing a real evolutionary effect perhaps related to the reservoir of gas from which the massive galaxies are forming. This indicates that LABs could still play an important role in the study of cosmological gas accretion modes, although perhaps in a more indirect manner than typically proposed.
5. Summary
We have used the SINFONI integral field spectrograph to resolve the dominant rest-frame optical emission lines of the luminous ( erg s-1) Ly blob ‘B1’ at discovered by Francis et al. (1996). Our main findings and conclusions are as follows.
We detect luminous [O]Å and H emission with a spatial extent of at least kpc (). The dominant optical emission line component (B1 North) shows relatively broad lines (600–800 km s-1, FWHM) and AGN-photoionized line-ratios in an optical line diagnostic diagram of [O]/H versus [N]/H. A secondary component (B1 South) of much more modest velocities of km s-1 (FWHM) roughly coincides with a filament of faint Ly and UV continuum detected previously (Francis et al., 1996).
The extinction-corrected [O]5007 luminosity in B1 is about 1 erg s-1. This is high compared to that of typical LAEs, but consistent with that of HzRGs (Humphrey et al., 2008) and quasars (e.g. Kim et al., 2013) at that redshift. The high luminosity, combined with the evidence for AGN photo-ionization, suggests that B1 North is the site of a hidden quasar. This is confirmed by the fact that [O] is relatively weak compared to [O] (extinction-corrected [O]/[O] of about 3.8), which is indicative of a high, Seyfert-like ionization parameter. This is consistent with the previous detection of a narrow C 1549Å line, as well as with the high mid-IR luminosity found by Colbert et al. (2006, 2011). Although the C emission was originally interpreted as evidence of an AGN (Francis et al., 1996), more recently it was hypothesized that the C and Ly emission could arise from a great number of merging halos and shocked gas clouds (Francis et al., 2012). In light of the new evidence, we adopt the former interpretation, and conclude that the B1 emission line nebula is the narrow line region of an obscured quasar.
Based on established relations between and for Type II AGN (Heckman et al., 2004; Lamastra et al., 2009) we conclude that B1 North hosts an extremely luminous quasar with a bolometric luminosity of erg s-1. The obscured AGN may be Compton-thick given existing X-ray limits.
We have performed a census of the most luminous LABs selected from the literature, and find that virtually all luminous LABs ( erg s-1) harbor obscured quasars. The properties of LABs in general are furthermore remarkably similar to those of HzRGs and quasars.
We find that the AGN scenario is easily capable of producing sufficient ionizing photons to power the Ly luminosities observed.
The fact that the duty cycle of AGN is relatively short compared to that of cosmological gas accretion as predicted by models, implies that AGN are the main driver of the Ly luminosity in the most luminous LABs, even if the large-scale cosmological gas flows are providing the material.
Our findings also imply that the empirical relation between LABs and overdense environments at high redshift suggested by the literature, is primarily due to a more fundamental correlation between AGN (or massive galaxies) and environment.
Acknowledgments
We thank Lee Armus, Yi-Kuan Chiang, Carlos De Breuck, Paul Francis, Tim Heckman, Yuichi Matsuda, Emily McLinden, Masami Ouchi, Tomoki Saito, Jingwen Wu, and the anonymous referee for comments, suggestions, and answering our questions.
References
- Alexander et al. (2005) Alexander, D. M., Bauer, F. E., Chapman, S. C., et al. 2005, ApJ, 632, 736
- Allen et al. (2008) Allen, M. G., Groves, B. A., Dopita, M. A., Sutherland, R. S., & Kewley, L. J. 2008, ApJS, 178, 20
- Baldwin et al. (1981) Baldwin, J. A., Phillips, M. M., & Terlevich, R. 1981, PASP, 93, 5
- Barger et al. (2002) Barger, A. J., Cowie, L. L., Brandt, W. N., et al. 2002, AJ, 124, 1839
- Basu-Zych & Scharf (2004) Basu-Zych, A., & Scharf, C. 2004, ApJ, 615, L85
- Baum & Heckman (1989) Baum, S. A., & Heckman, T. 1989, ApJ, 336, 681
- Beelen et al. (2008) Beelen, A., et al. 2008, A&A, 485, 645
- Best et al. (2000) Best, P. N., Röttgering, H. J. A., & Longair, M. S. 2000, MNRAS, 311, 23
- Bower et al. (2004) Bower, R. G., Morris, S. L., Bacon, R., et al. 2004, MNRAS, 351, 63
- Bridge et al. (2012) Bridge, C. R., Blain, A., Borys, C. J. K., et al. 2012, arXiv:1205.4030
- Brinchmann et al. (2008) Brinchmann, J., Pettini, M., & Charlot, S. 2008, MNRAS, 385, 769
- Chapman et al. (2003) Chapman, S. C., Blain, A. W., Ivison, R. J., & Smail, I. R. 2003, Nature, 422, 695
- Chapman et al. (2004) Chapman, S. C., Scott, D., Windhorst, R. A., et al. 2004, ApJ, 606, 85
- Chary & Elbaz (2001) Chary, R., & Elbaz, D. 2001, ApJ, 556, 562
- Christensen et al. (2006) Christensen, L., Jahnke, K., Wisotzki, L., & Sánchez, S. F. 2006, A&A, 459, 717
- Colbert et al. (2006) Colbert, J. W., Teplitz, H., Francis, P., Palunas, P., Williger, G. M., & Woodgate, B. 2006, ApJ, 637, L89
- Colbert et al. (2008) Colbert, J. W., Teplitz, H., Francis, P., Palunas, P., Williger, G. M., & Woodgate, B. 2008, Infrared Diagnostics of Galaxy Evolution, 381, 468
- Colbert et al. (2011) Colbert, J. W., Scarlata, C., Teplitz, H., et al. 2011, ApJ, 728, 59
- Dey et al. (2005) Dey, A., Bian, C., Soifer, B. T., et al. 2005, ApJ, 629, 654
- Dijkstra & Loeb (2009) Dijkstra, M., & Loeb, A. 2009, MNRAS, 400, 1109
- Dijkstra & Kramer (2012) Dijkstra, M., & Kramer, R. 2012, MNRAS, 424, 1672
- Dopita & Sutherland (1995) Dopita, M. A., & Sutherland, R. S. 1995, ApJ, 455, 468
- Erb et al. (2006) Erb, D. K., Shapley, A. E., Pettini, M., et al. 2006, ApJ, 644, 813
- Erb et al. (2011) Erb, D. K., Bogosavljević, M., & Steidel, C. C. 2011, ApJ, 740, L31
- Fardal et al. (2001) Fardal, M. A., Katz, N., Gardner, J. P., et al. 2001, ApJ, 562, 605
- Faucher-Giguère et al. (2010) Faucher-Giguère, C.-A., Kereš, D., Dijkstra, M., Hernquist, L., & Zaldarriaga, M. 2010, ApJ, 725, 633
- Förster Schreiber et al. (2006) Förster Schreiber, N. M., Genzel, R., Lehnert, M. D., et al. 2006, ApJ, 645, 1062
- Francis et al. (1996) Francis, P. J., et al. 1996, ApJ, 457, 490
- Francis et al. (1997) Francis, P. J., Woodgate, B. E., & Danks, A. C. 1997, ApJ, 482, L25
- Francis et al. (2001) Francis, P. J., et al. 2001, ApJ, 554, 1001
- Francis et al. (2004a) Francis, P. J., Palunas, P., Teplitz, H. I., Williger, G. M., & Woodgate, B. E. 2004a, ApJ, 614, 75
- Francis & Williger (2004b) Francis, P. J., & Williger, G. M. 2004b, ApJ, 602, L77
- Francis et al. (2012) Francis, P. J., Dopita, M. A., Colbert, J. W., et al. 2012, MNRAS, 6
- Fu & Stockton (2009) Fu, H., & Stockton, A. 2009, ApJ, 690, 953
- Geach et al. (2005) Geach, J. E., Matsuda, Y., Smail, I., et al. 2005, MNRAS, 363, 1398
- Geach et al. (2009) Geach, J. E., Alexander, D. M., Lehmer, B. D., et al. 2009, ApJ, 700, 1
- Gould & Weinberg (1996) Gould, A., & Weinberg, D. H. 1996, ApJ, 468, 462
- Harrison et al. (2012) Harrison, C. M., Alexander, D. M., Swinbank, A. M., et al. 2012, MNRAS, 426, 1073
- Hatch et al. (2008) Hatch, N. A., Overzier, R. A., Röttgering, H. J. A., Kurk, J. D., & Miley, G. K. 2008, MNRAS, 383, 931
- Hatch et al. (2009) Hatch, N. A., Overzier, R. A., Kurk, J. D., et al. 2009, MNRAS, 395, 114
- Hayashi et al. (2012) Hayashi, M., Kodama, T., Tadaki, K.-i., Koyama, Y., & Tanaka, I. 2012, ApJ, 757, 15
- Heckman et al. (1982) Heckman, T. M., Miley, G. K., Balick, B., van Breugel, W. J. M., & Butcher, H. R. 1982, ApJ, 262, 529
- Heckman et al. (1987) Heckman, T. M., Armus, L., & Miley, G. K. 1987, AJ, 93, 276
- Heckman et al. (1991) Heckman, T. M., Miley, G. K., Lehnert, M. D., & van Breugel, W. 1991, ApJ, 370, 78
- Heckman et al. (2004) Heckman, T. M., Kauffmann, G., Brinchmann, J., et al. 2004, ApJ, 613, 109
- Humphrey et al. (2008) Humphrey, A., Villar-Martín, M., Vernet, J., et al. 2008, MNRAS, 383, 11
- Kauffmann et al. (2003) Kauffmann, G., Heckman, T. M., Tremonti, C., et al. 2003, MNRAS, 346, 1055
- Keel et al. (1999) Keel, W. C., Cohen, S. H., Windhorst, R. A., & Waddington, I. 1999, AJ, 118, 2547
- Keel et al. (2002) Keel, W. C., Wu, W., Waddington, I., Windhorst, R. A., & Pascarelle, S. M. 2002, AJ, 123, 3041
- Keel et al. (2009) Keel, W. C., White, R. E., III, Chapman, S., & Windhorst, R. A. 2009, AJ, 138, 986
- Keel et al. (2012) Keel, W. C., Chojnowski, S. D., Bennert, V. N., et al. 2012, MNRAS, 420, 878
- Kennicutt (1998) Kennicutt, R. C., Jr. 1998, ARA&A, 36, 189
- Kewley et al. (2001) Kewley, L. J., Dopita, M. A., Sutherland, R. S., Heisler, C. A., & Trevena, J. 2001, ApJ, 556, 121
- Kewley et al. (2006) Kewley, L. J., Groves, B., Kauffmann, G., & Heckman, T. 2006, MNRAS, 372, 961
- Kim et al. (2013) Kim, M., Ho, L. C., Lonsdale, C. J., et al. 2013, arXiv:1303.7194
- Kriek et al. (2007) Kriek, M., van Dokkum, P. G., Franx, M., et al. 2007, ApJ, 669, 776
- Kuiper et al. (2011) Kuiper, E., Hatch, N. A., Miley, G. K., et al. 2011, MNRAS, 415, 2245
- Lamastra et al. (2009) Lamastra, A., Bianchi, S., Matt, G., et al. 2009, A&A, 504, 73
- Lehnert & Heckman (1994) Lehnert, M. D., & Heckman, T. M. 1994, ApJ, 426, L27
- Lehnert et al. (2009) Lehnert, M. D., Nesvadba, N. P. H., Le Tiran, L., et al. 2009, ApJ, 699, 1660
- Leitherer et al. (1999) Leitherer, C., Schaerer, D., Goldader, J. D., et al. 1999, ApJS, 123, 3
- Le Tiran et al. (2011) Le Tiran, L., Lehnert, M. D., Di Matteo, P., Nesvadba, N. P. H., & van Driel, W. 2011, A&A, 530, L6
- Maschietto et al. (2008) Maschietto, F., Hatch, N. A., Venemans, B. P., et al. 2008, MNRAS, 389, 1223
- Matsuda et al. (2004) Matsuda, Y., Yamada, T., Hayashino, T., et al. 2004, AJ, 128, 569
- Matsuda et al. (2006) Matsuda, Y., Yamada, T., Hayashino, T., Yamauchi, R., & Nakamura, Y. 2006, ApJ, 640, L123
- Matsuda et al. (2009) Matsuda, Y., Nakamura, Y., Morimoto, N., et al. 2009, MNRAS, 400, L66
- Matsuda et al. (2011) Matsuda, Y., Yamada, T., Hayashino, T., et al. 2011, MNRAS, 410, L13
- McCarthy et al. (1987) McCarthy, P. J., Spinrad, H., Djorgovski, S., et al. 1987, ApJ, 319, L39
- McCarthy et al. (1990) McCarthy, P. J., Spinrad, H., Dickinson, M., et al. 1990, ApJ, 365, 487
- McLinden et al. (2011) McLinden, E. M., Finkelstein, S. L., Rhoads, J. E., et al. 2011, ApJ, 730, 136
- Menéndez-Delmestre et al. (2009) Menéndez-Delmestre, K., Blain, A. W., Smail, I., et al. 2009, ApJ, 699, 667
- Miley et al. (2004) Miley, G. K., Overzier, R. A., Tsvetanov, Z. I., et al. 2004, Nature, 427, 47
- Miley et al. (2006) Miley, G. K., Overzier, R. A., Zirm, A. W., et al. 2006, ApJ, 650, L29
- Nakajima et al. (2012) Nakajima, K., Ouchi, M., Shimasaku, K., et al. 2012, arXiv:1208.3260
- Nesvadba et al. (2006) Nesvadba, N. P. H., Lehnert, M. D., Eisenhauer, F., et al. 2006, ApJ, 650, 693
- Nesvadba et al. (2007a) Nesvadba, N. P. H., Lehnert, M. D., De Breuck, C., Gilbert, A., & van Breugel, W. 2007a, A&A, 475, 145
- Nesvadba et al. (2008) Nesvadba, N. P. H., Lehnert, M. D., Davies, R. I., Verma, A., & Eisenhauer, F. 2008, A&A, 479, 67
- Nesvadba et al. (2011) Nesvadba, N. P. H., Polletta, M., Lehnert, M. D., et al. 2011, MNRAS, 415, 2359
- Netzer et al. (2004) Netzer, H., Shemmer, O., Maiolino, R., et al. 2004, ApJ, 614, 558
- Nilsson et al. (2006) Nilsson, K. K., Fynbo, J. P. U., Møller, P., Sommer-Larsen, J., & Ledoux, C. 2006, A&A, 452, L23
- North et al. (2012) North, P. L., Courbin, F., Eigenbrod, A., & Chelouche, D. 2012, A&A, 542, A91
- Overzier et al. (2001) Overzier, R. A., Röttgering, H. J. A., Kurk, J. D., & De Breuck, C. 2001, A&A, 370, L39
- Overzier et al. (2006) Overzier, R. A., Miley, G. K., Bouwens, R. J., et al. 2006, ApJ, 637, 58
- Overzier et al. (2008) Overzier, R. A., Bouwens, R. J., Cross, N. J. G., et al. 2008, ApJ, 673, 143
- Overzier et al. (2009) Overzier, R. A., Heckman, T. M., Tremonti, C., et al. 2009, ApJ, 706, 203
- Palunas et al. (2004) Palunas, P., Teplitz, H. I., Francis, P. J., Williger, G. M., & Woodgate, B. E. 2004, ApJ, 602, 545
- Pascarelle et al. (1996) Pascarelle, S. M., Windhorst, R. A., Keel, W. C., & Odewahn, S. C. 1996, Nature, 383, 45
- Pentericci et al. (1998) Pentericci, L., Roettgering, H. J. A., Miley, G. K., et al. 1998, ApJ, 504, 139
- Pentericci et al. (1999) Pentericci, L., Röttgering, H. J. A., Miley, G. K., et al. 1999, A&A, 341, 329
- Pentericci et al. (2000) Pentericci, L., Kurk, J. D., Röttgering, H. J. A., et al. 2000, A&A, 361, L25
- Pettini et al. (2001) Pettini, M., Shapley, A. E., Steidel, C. C., et al. 2001, ApJ, 554, 981
- Polletta et al. (2008) Polletta, M., Omont, A., Berta, S., et al. 2008, A&A, 492, 81
- Polletta et al. (2011) Polletta, M., Nesvadba, N. P. H., Neri, R., et al. 2011, A&A, 533, A20
- Prescott et al. (2008) Prescott, M. K. M., Kashikawa, N., Dey, A., & Matsuda, Y. 2008, ApJ, 678, L77
- Prescott et al. (2009) Prescott, M. K. M., Dey, A., & Jannuzi, B. T. 2009, ApJ, 702, 554
- Prescott et al. (2012) Prescott, M. K. M., Dey, A., Brodwin, M., et al. 2012, ApJ, 752, 86
- Reuland et al. (2003) Reuland, M., van Breugel, W., Röttgering, H., et al. 2003, ApJ, 592, 755
- Rich et al. (2011) Rich, J. A., Kewley, L. J., & Dopita, M. A. 2011, ApJ, 734, 87
- Richards et al. (2006) Richards, G. T., Lacy, M., Storrie-Lombardi, L. J., et al. 2006, ApJS, 166, 470
- Saito et al. (2006) Saito, T., Shimasaku, K., Okamura, S., et al. 2006, ApJ, 648, 54
- Sanders & Mirabel (1996) Sanders, D. B., & Mirabel, I. F. 1996, ARA&A, 34, 749
- Scarlata et al. (2009) Scarlata, C., Colbert, J., Teplitz, H. I., et al. 2009, ApJ, 706, 1241
- Shapley et al. (2003) Shapley, A. E., Steidel, C. C., Pettini, M., & Adelberger, K. L. 2003, ApJ, 588, 65
- Shen et al. (2007) Shen, Y., Strauss, M. A., Oguri, M., et al. 2007, AJ, 133, 2222
- Smith & Jarvis (2007) Smith, D. J. B., & Jarvis, M. J. 2007, MNRAS, 378, L49
- Smith et al. (2008) Smith, D. J. B., Jarvis, M. J., Lacy, M., & Martínez-Sansigre, A. 2008, MNRAS, 389, 799
- Smith et al. (2009) Smith, D. J. B., Jarvis, M. J., Simpson, C., & Martínez-Sansigre, A. 2009, MNRAS, 393, 309
- Solórzano-Iñarrea et al. (2001) Solórzano-Iñarrea, C., Tadhunter, C. N., & Axon, D. J. 2001, MNRAS, 323, 965
- Steidel et al. (2000) Steidel, C. C., Adelberger, K. L., Shapley, A. E., et al. 2000, ApJ, 532, 170
- Steidel et al. (2011) Steidel, C. C., Bogosavljević, M., Shapley, A. E., et al. 2011, ApJ, 736, 160
- Tadhunter et al. (1986) Tadhunter, C. N., Perez, E., & Fosbury, R. A. E. 1986, MNRAS, 219, 555
- Teplitz et al. (2000) Teplitz, H. I., McLean, I. S., Becklin, E. E., et al. 2000, ApJ, 533, L65
- van Dokkum et al. (2005) van Dokkum, P. G., Kriek, M., Rodgers, B., Franx, M., & Puxley, P. 2005, ApJ, 622, L13
- Veilleux & Osterbrock (1987) Veilleux, S., & Osterbrock, D. E. 1987, ApJS, 63, 295
- Venemans et al. (2002) Venemans, B. P., Kurk, J. D., Miley, G. K., et al. 2002, ApJ, 569, L11
- Venemans et al. (2005) Venemans, B. P., Röttgering, H. J. A., Miley, G. K., et al. 2005, A&A, 431, 793
- Venemans et al. (2007) Venemans, B. P., Röttgering, H. J. A., Miley, G. K., et al. 2007, A&A, 461, 823
- Villar-Martin et al. (1997) Villar-Martin, M., Tadhunter, C., & Clark, N. 1997, A&A, 323, 21
- Villar-Martín et al. (1999) Villar-Martín, M., Binette, L., & Fosbury, R. A. E. 1999, A&A, 346, 7
- Villar-Martín et al. (2000) Villar-Martín, M., Alonso-Herrero, A., di Serego Alighieri, S., & Vernet, J. 2000, A&AS, 147, 291
- Villar-Martín et al. (2002) Villar-Martín, M., Vernet, J., di Serego Alighieri, S., et al. 2002, MNRAS, 336, 436
- Villar-Martín et al. (2003) Villar-Martín, M., Vernet, J., di Serego Alighieri, S., et al. 2003, MNRAS, 346, 273
- Villar-Martín et al. (2006) Villar-Martín, M., Sánchez, S. F., De Breuck, C., et al. 2006, MNRAS, 366, L1
- Villar-Martín et al. (2007a) Villar-Martín, M., Humphrey, A., De Breuck, C., et al. 2007a, MNRAS, 375, 1299
- Villar-Martín et al. (2007b) Villar-Martín, M., Sánchez, S. F., Humphrey, A., et al. 2007b, MNRAS, 378, 416
- Villar-Martín et al. (2011) Villar-Martín, M., Humphrey, A., Delgado, R. G., Colina, L., & Arribas, S. 2011, MNRAS, 418, 2032
- Webb et al. (2009) Webb, T. M. A., Yamada, T., Huang, J.-S., et al. 2009, ApJ, 692, 1561
- Weijmans et al. (2010) Weijmans, A.-M., Bower, R. G., Geach, J. E., et al. 2010, MNRAS, 402, 2245
- Wilman et al. (2005) Wilman, R. J., Gerssen, J., Bower, R. G., Morris, S. L., Bacon, R., de Zeeuw, P. T., & Davies, R. L. 2005, Nature, 436, 227
- Wu et al. (2010) Wu, Y., Helou, G., Armus, L., et al. 2010, ApJ, 723, 895
- Wu et al. (2012) Wu, J., Tsai, C.-W., Sayers, J., et al. 2012, ApJ, 756, 96
- Yang et al. (2009) Yang, Y., Zabludoff, A., Tremonti, C., Eisenstein, D., & Davé, R. 2009, ApJ, 693, 1579
- Yang et al. (2010) Yang, Y., Zabludoff, A., Eisenstein, D., & Davé, R. 2010, ApJ, 719, 1654
- Yang et al. (2011) Yang, Y., Zabludoff, A., Jahnke, K., et al. 2011, ApJ, 735, 87
- Zirm et al. (2005) Zirm, A. W., Overzier, R. A., Miley, G. K., et al. 2005, ApJ, 630, 68
- Zirm et al. (2009) Zirm, A. W., Dey, A., Dickinson, M., & Norman, C. J. 2009, ApJ, 694, L31