WFC3 grism confirmation of the distant cluster Cl J1449+0856 at :
Quiescent and star-forming galaxy populations
Abstract
We present deep Hubble Space Telescope Wide Field Camera 3 (HST/WFC3) slitless spectroscopic observations of the distant cluster Cl J1449+0856. These cover a single pointing with 18 orbits of G141 spectroscopy and F140W imaging, allowing us to derive secure redshifts down to AB and 3 line fluxes of erg s-1 cm-2. In particular, we were able to spectroscopically confirm 12 early-type galaxies (ETGs) in the field up to , 6 of which in the cluster core, which represents the first direct spectroscopic confirmation of quiescent galaxies in a cluster environment. With 140 redshifts in a arcmin2 field, we can trace the spatial and redshift galaxy distribution in the cluster core and background field. We find two strong peaks at and , where only one was seen in our previously published ground-based data. Due to the spectroscopic confirmation of the cluster ETGs, we can now re-evaluate the redshift of Cl J1449+0856 at , rather than , with the background overdensity being revealed to be sparse and “sheet”-like. This presents an interesting case of chance alignment of two close yet unrelated structures, each one preferentially selected by different observing strategies. With 6 quiescent or early-type spectroscopic members and 20 star-forming ones, Cl J1449+0856 is now reliably confirmed to be at . The identified members can now allow for a detailed study of galaxy properties in the densest environment at .
Subject headings:
galaxies: clusters (Cl J1449+0856)—galaxies: high-redshift1. Introduction
Galaxy clusters are the most overdense structures in the Universe and as such invaluable tools to constrain cosmological parameters
and to understand how the local environment can bias galaxy evolution, in particular the
formation and evolution of massive early-type galaxies (ETGs). This galaxy population dominates cluster cores at and,
while its formation and assembly over cosmic time is still not yet fully understood, it has nevertheless been found to have a
very old component, with a substantial part of its stellar mass having formed at redshifts in excess of two
(e.g., Thomas et al., 2005; Mei et al., 2009; Rettura et al., 2010). The question of its origin, and relation with the formation of the cluster environment
itself, can thus be more easily addressed at high redshift, closer to the formation of the first ETGs and into the epoch of
protoclusters, when the first relaxed galaxy clusters start appearing and the beginnings of the red sequence become visible
(Kodama et al., 2007; Zirm et al., 2008).
Distant clusters have traditionally been discovered using the characteristic signature of their hot gas atmosphere, either
directly through its X-ray emission (e.g., Rosati et al., 1998; Romer et al., 2001) or its effect on the cosmic microwave background (Sunyaev & Zel’dovich, 1972; Barbosa et al., 1996).
This type of selection however requires massive, relaxed structures and, in the case of X-ray surveys, is limited
by surface brightness.
Over the past 15 years, many galaxy clusters have been found at using these techniques
(e.g., Stanford et al., 1997; Rosati et al., 2004; Mullis et al., 2005; Stanford et al., 2006; Tanaka et al., 2010; Fassbender et al., 2011; Santos et al., 2011; Reichardt et al., 2013). However, instrumental limitations and the sharply decreasing
number density at high redshift of the type of massive structure detectable by X-ray or Sunyaev Zel’dovich observations conspire
to progressively reduce the number of galaxy clusters that can be reliably identified at . On the other hand, the photometric
selection of overdensities of massive galaxies at high redshift (e.g., Gladders & Yee, 2000; Eisenhardt et al., 2008; Wilson et al., 2008) has been quite successful in
discovering clusters above (e.g., Andreon et al., 2009; Papovich et al., 2010; Gobat et al., 2011; Stanford et al., 2012; Spitler et al., 2012; Muzzin et al., 2013).
Yet, most of such high-redshift structures are of relatively low mass, their number, despite the recent progress, is still limited
and they require spectroscopic confirmation. While it is possible in exceptional cases to determine a cluster’s redshift directly
from X-ray observations (e.g., Tozzi et al., 2013), typical cluster identifications usually need to be followed up by spectroscopic
observations, lest their usefulness as cosmological probes or galaxy evolution laboratories be limited.
Spectroscopic confirmation of high-redshift cluster members, and especially quiescent galaxies, is a difficult task, but required
to convincingly demonstrate that a structure is genuinely evolved, with an established population of old galaxies.
In this case, spectroscopic confirmation implies detection of the stellar continuum of the central ETG population and thus
requires a high enough signal-to-noise ratio (S/N), which is only achievable from the ground with very long integration times, either
in the optical (e.g., Cimatti et al., 2008) or in the near-infrared (NIR; e.g., Onodera et al., 2012). Further complicating matters, the main spectral
feature of old stellar populations, the 4000Å break, is at redshifted into the NIR, requiring a sensitivity in this
wavelength range that, until recently, only few instruments could provide.
At , on the other hand, efforts have mostly been focused on finding galaxy cluster progenitors, often around giant radiogalaxies,
as overdensities of star-forming objects selected by their line emission (e.g., Pentericci et al., 1997; Steidel et al., 2005; Overzier et al., 2006; Venemans et al., 2007; Hatch et al., 2011; Koyama et al., 2013).
These protoclusters, being readily identified in narrow-band surveys, are thus paradoxically easier to confirm than the later (and
closer) galaxy clusters. This biases our view of the universe, as we then miss the more quiescent and evolved structures
(e.g., Spitler et al., 2012) that may be present at this epoch.
In contrast with ground-based instruments, the Hubble Space Telescope Wide Field Camera 3 (hereafter HST/WFC3) in
its grism mode does not suffer from atmospheric absorption and OH glow. Its great sensitivity, coupled with a relatively low spectral
resolution, allows for efficient continuum detection. Its capacity to observe, in principle, every object in its field of view also
allows for relatively unbiased surveys (e.g., Trump et al., 2011). Thus, even with its relatively limited field of view
(′′), the HST/WFC3 is an ideal instrument for obtaining spectra of compact, passively
evolving galaxies in cluster cores, in redshift ranges traditionally inaccessible to ground-based instruments (e.g., Stanford et al., 2012).
In this work we present deep HST/WFC3 observations of the infrared-selected galaxy cluster Cl J1449+0856 (Gobat et al., 2011),
the most distant confirmed so far and also the most distant with a detected X-ray emission. This field benefits from a large
multiwavelength dataset which has since been significantly expanded, both at short (UV) and longer (far-IR to
radio) wavelengths. Here we concentrate on the HST/WFC3 spectroscopic data, their analysis and the redshifts obtained from
them. A more detailed study of other galaxy properties derived from the spectra will be presented in forthcoming papers.
In particular, the UV to NIR parts of this dataset have recently been reanalyzed with the inclusion of the high-resolution
imaging and spectroscopic redshifts presented here. All this has been used to derive new accurate photometric redshifts and
make a comparative study of the star-forming and quenched galaxy populations of the cluster. These results are presented in a
companion paper (Strazzullo et al., 2013).
The field around Cl J1449+0856 had already been spectroscopically observed from the ground with the FORS2 and VIMOS instruments
on the Very Large Telescope (VLT; Gobat et al., 2011) and MOIRCS on Subaru, targeting mostly sBzK-selected (Daddi et al., 2004) galaxies.
However, redshifts could be measured only for star-forming galaxies and none of the objects spectroscopically confirmed by these
ground-based observations was found in the cluster core. For the red galaxies dominating the core, only photometric redshifts were
available.
As the distribution of spectroscopic redshifts in the surrounding area was strongly peaked at , and that of the photometric
redshifts of red galaxies also peaked at , the redshift of was attributed to the cluster. Thus, despite
the convincing nature of Cl J1449+0856, a full and definitive confirmation of the redshift of the core galaxy population could not be
obtained.To remedy to this situation, we carried out deep HST spectroscopy of the central galaxy overdensity with the red G141
grism. This allowed us to spectroscopically confirm both quiescent and star-forming galaxies in and around the cluster core, which led
to a slight but significant revision of the cluster redshift.
Throughout the paper, we assume a CDM cosmology with km s-1 Mpc-1, and . Magnitudes are given in the AB photometric system throughout.
| Date | Angle | Orbits | Time | Time |
|---|---|---|---|---|
| (direct) | (grism) | |||
| (deg) | (hr) | (hr) | ||
| 2010 26 Jun, 1 Jul | -4.5 | 10 | 0.6 | 7 |
| 2010 9 Jul | -28 | 4 | 0.3 | 2.7 |
| 2010 6 Jun | 14.8 | 4 | 0.3 | 2.7 |
2. HST/WFC3 observations
The distant cluster Cl J1449+0856 was observed with the HST/WFC3 using the G141 grism and F140W filter between 2010 June
and July (see Table 1). The direct imaging was taken, as customary, to provide information on source positions and
morphologies, to allow for the modeling of the spectra and to facilitate their extraction.
Because of the high density of sources in this field, three different orientations were chosen and the dithering of the F140W imaging
was set so that its total coverage be larger than any of the three grism pointings. This ensured that spectral contamination could be
estimated with sub-pixel precision, also for traces originating outside the field of view of the individual pointings.
At 18 orbits, this G141 data are some of the deepest yet. They cover a total area of 6.4 arcmin2, with uniform coverage on
arcmin2 (and arcmin2 covered by at least three orientations).
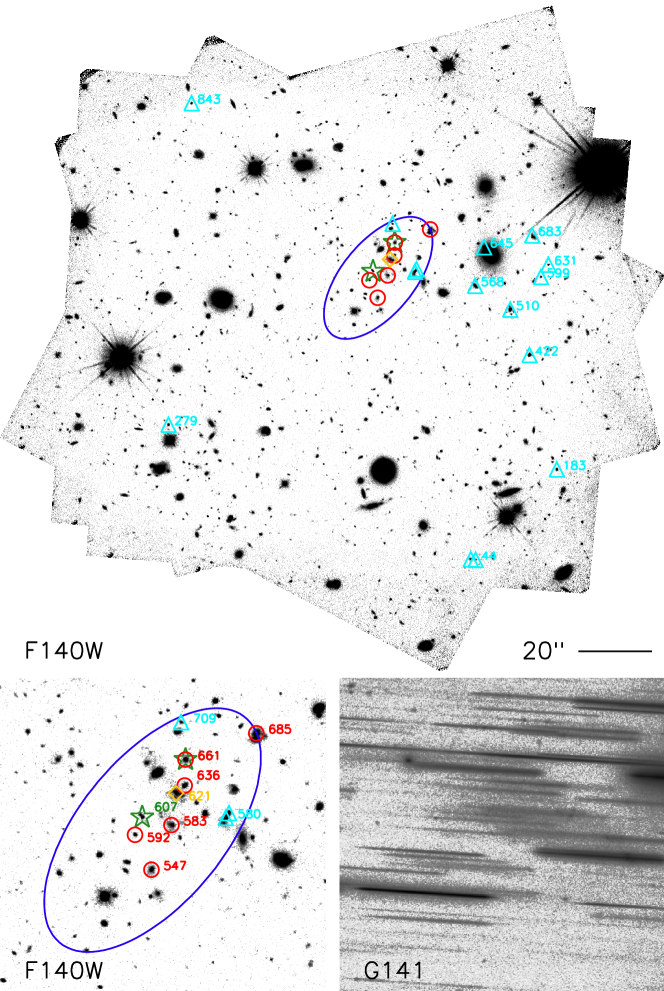
Figure 1 shows the Cl J1449+0856 field in direct and grism imaging, along with the positions of cluster
members. Here we define the cluster core as a ″″region including the centroid of the X-ray emission and
corresponding to the overdensity of red galaxies as initially found in Gobat et al. (2011) and confirmed in Strazzullo et al. (2013). It also contains
all the early-type members which we could spectroscopically confirm.
The data were in a first time reduced using the best available calibration files at the time and the standard aXe pipeline (Kümmel et al., 2009).
The F140W frames were combined with Multidrizzle and the resulting image was used to extract photometry. The multiband catalog,
including ground-based observations, is described in Strazzullo et al. (2013). The grism spectra in each orientation were reduced using
the aXe software to produce cutouts of two-dimensional (2D) spectra for each source in the photometric catalog.
As described in Gobat et al. (2012), the individual grism frames were sky-subtracted separately. This was deemed necessary,
as the density of traces in the grism images resulted in oversubtraction by the pipeline. As the version of aXe used here
(v2.1) did not allow for correcting for cosmic rays independently of sky subtraction, these and residual bad pixels were masked a
posteriori in each spectrum during the analysis (even tough, due to the low and variable resolution of the spectra, the aspect of
such artifacts is quite different than that of actual spectral features).
Finally, extracted one-dimensional (1D) spectra were flux-calibrated using the G141 first-order sensitivity function, rebinned for
each spectrum to its pixel scale and smoothed to its effective resolution. Wavelength calibration, on the other hand, was handled by
aXe. The limit for extraction was set at , close to the limit (1” aperture, Strazzullo et al., 2013) of the direct
imaging and corresponding to a spectral continuum S/N of per resolution element. This ensured that the initial sample be
complete and allowed for easier component separation in the case of blended spectra (sources with S/N were still included in
the contamination estimates, but not extracted; see below).
2.1. Extraction of Spectra
Because the HST/WFC3 instrument operates in slitless mode, two effects conspire to make the reduction and analysis of the
spectra more challenging: while the G141 grism has a resolution of (with a pixel size of 46.5Å and 0″.13 in
the cross-dispersion, i.e., spatial, direction), each spectrum is effectively a convolution of an “intrinsic”
spectrum with the spatial profile of the source in the dispersion (wavelength) direction. The actual spectral resolution
can thus be significantly lower for extended sources. This results in broadened absorption or emission features and a lower
S/N (e.g., Brammer et al., 2012), rendering their identification and interpretation sometimes difficult. More importantly, a spectrum can
be contaminated by spectral traces originating from sources elsewhere in the field along the dispersion direction, including higher
(first- and second-) or lower (zeroth) order modes usually cut off or well-separated by ground-based instruments.
While the response of the grism in these higher orders is at most 30% that of the first order in the usable wavelength range
of the G141 grism ( m m), and often an order of magnitude lower, higher-order contaminating traces
from bright objects can still overwhelm the spectra of faint sources. Even when contamination is not dominant, it can
negatively affect spectra by changing the overall shape of the continuum or adding spurious features (e.g., emission lines), resulting
in misidentifications and erroneous redshifts. While observations are usually done in at least two different orientations to mitigate
this problem, here the density of sources around Cl J1449+0856 and the depth of the data ensure that a significant fraction of
spectra be contaminated in all three orientations.
There are several ways to correct for contamination, which involve spectral modeling of the contaminating
traces111See, e.g., http://www.stsci.edu/hst/wfc3/analysis/grism_obs/cookbook.html.
At the time of this writing, the most sophisticated procedure implemented in aXe, the “fluxcube” method, uses imaging in bands bracketing
the grism, interpolating them to model both the spectrum of sources and the spectral dependence of their spatial profiles. The fluxcube
method can be somewhat costly to implement, however, as it requires HST imaging in several filters with matching depths. As a
compromise, trace profiles in the cross-dispersion direction can also be approximated as Gaussian using information yielded by
the direct image. In the course of the reduction, we have tried both the Gaussian approximation of spectral profiles, which we found
largely overestimated contamination, and the fluxcube method. In the latter case, as a workaround to the fact that HST imaging was
only available in one band, we used the F140W image to simulate HST images at different wavelengths by re-scaling each object, using
the ground-based photometry and the segmentation image produced by SExtractor (Bertin & Arnouts, 1996) as a mask.

We found that this latter method worked well for sources with relatively high S/N. However, the contamination estimate is, in this
case, entirely dependent on the quality of the photometry and can be biased by photometric uncertainties. Since it does not use true
multiband HST imaging, information on wavelength-dependent morphological variation is also lacking. Even when other HST
images are available, the quality of the spectral model will be set by the photometric sampling, especially around strong features like
breaks which, because of the width of the filters, will be smoothed out. The contamination model is therefore always an (often poor)
approximation of the real spectrum. However, calibration of the continuum is essential for those objects that have no or weak line
emission, like quenched or highly reddened star-forming galaxies. The slitless spectra of these sources, especially faint ones, are thus
at risk of being lost because of this sub-optimal contamination model. Where the type and distance of a contaminating source are known,
such as in the case of a star, a more accurate template spectrum can be used in lieu of the photometric based model. However, this is
almost never the case, the vast majority of sources in a grism observation lacking prior spectral and redshift information.
To address this problem, we also tried another approach which forwent the models produced by aXe, using only the science and error
extensions of the 2D cutout, and dealt with contamination at the time of extraction. This was done by fitting each pixel column in
the cross-dispersion direction with a combination of trace profiles derived from the direct images:
For any given 2D spectrum, the positions of the traces (target and contaminants) falling in part or in full within the
aperture were computed from their relative positions in the direct image.
Object profiles in the dispersion direction were then estimated from the direct image, using the segmentation map to
separate them. To account for dependence of the PSF with wavelength, these profiles were broadened (respectively sharpened)
at longer (respectively shorter) wavelengths than the F140W pivot. The variation of the PSF across the wavelength range of the
grism was measured from the uncontaminated traces of unsaturated stars in the field.
The maximum continuum flux of the traces was estimated using the sources’ spectral energy distributions
(SEDS; see Strazzullo et al., 2013, for a description of the photometric catalog) and the sensitivity curve for the corresponding spectral order.
The background in the 2D spectrum was then estimated by masking the traces where they were expected to rise above the noise,
allowing for a linear variation along the dispersion direction.
Each pixel column in the cutout was then fit as a combination of profiles at their expected positions. The resulting
spectrum is then given at each pixel by the normalization of each source profile and the error spectrum by the uncertainty on
the fitted parameters.
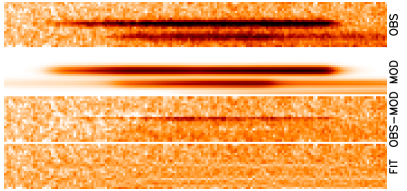
For unblended spectra, the second approach yields results similar to the pipeline’s untilted extraction although, by not making
assumptions on spectral shapes, the residuals after subtraction of source and contamination spectra are lower than with trace
models produced by aXe (see Figure 2). In the case of overlapping spectra, however, it can distinguish between features
(emission lines, deep absorption lines or spectral breaks) originating from one source or the other based on the trace
profiles, provided the relative brightness difference be not too large (on the other hand, one limitation of this approach is that
here we assume a consistent source profile and thus, e.g.,, that emission features are distributed more or less evenly across the
galaxies). We used this approach when the 2D spectra were severely contaminated or lacked emission lines (e.g., in the case of quiescent
or heavily reddened systems). The extracted, contamination-subtracted 1D spectra in each orientation were first compared
to each other, to check that they were consistent and then stacked before calibration. They were weighted according to exposure and
wavelength-dependent contamination.
3. Redshift determinations
The usable range of the G141 is 1.1 m–1.7 m. At and considering the spectral resolution, observable features
include [OII], [NeIII], H and [OIII]5007Å in emission, as well as the 4000Å break and less prominent Balmer lines,
in the case of strongly star-forming or post-starburst galaxies. We have estimated redshifts for 140 targets in the field out of
474 objects with , with an average success rate of 30%. The remaining objects, for which we could not recover a
redshift were either irremediably contaminated (e.g., aligned, in the dispersion direction, with bright sources such as stars),
had no significant spectral features in the G141 wavelength range (due to their redshift), or had too low S/N, either because
of intrinsic faintness or low surface brightness.
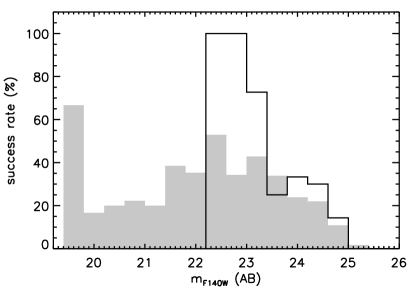
The success rate is high at the center, as shown in Figure 3, and declines toward the edge of the field. This is
likely due to higher noise because of the lower coverage and also to the presence of relatively bright sources (low-redshift
galaxies and stars) near the edges of the field.
Redshifts were estimated in two ways: by matching the position of peaks in the spectra with known emission lines and, for spectra
without obvious emission features, by cross-correlation with stellar population templates.
3.1. Line emitters
Spectra were first automatically inspected for emission lines with S/N and width that matched the effective resolution (i.e., the
width of the source in the dispersion direction). Those that were close to zeroth orders were ignored, regardless of any differences
between the observed flux and that predicted by the contamination model. A Gaussian fit was then done to the peaks and the centroids used
as their “true” position. Here we used spectra extracted by the standard pipeline, as emission-line spectra do not necessarily require
a good flux calibration for the identification and examination of a spectrum in all orientations allows for differentiation between lines
arising from the source itself (which will be common to the different orientations) and from contamination.
Two different quality flags were assigned to resulting redshifts: when two or more emission lines were found
and their relative position matched, the redshift was deemed secure (“A” quality) and the uncertainty on the redshift was determined by
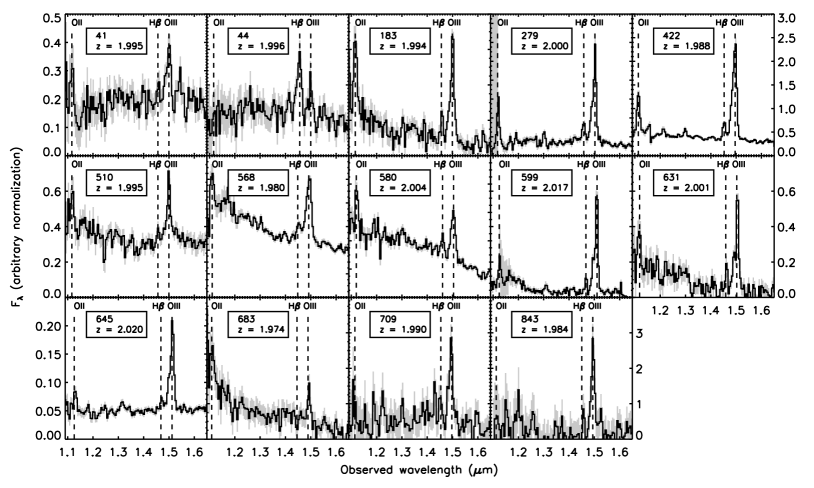
the scatter of line positions. Figure 4 shows the HST/WFC3 emission-line spectra of star forming galaxies in
Cl J1449+0856, counting close pairs, possibly clumpy objects, only once.
When only one peak could be reliably measured, and no other prominent emission lines were expected to fall in the grism range, the photometry
was used to distinguish between possible solutions: first, a rough selection was done where the line was assumed to be [OIII]5007Å for
sBzK-selected galaxies and H otherwise. These single-line redshifts were then compared with the photometric redshifts
(see Strazzullo et al., 2013). In six cases, where the spectroscopic redshift was incompatible with the photometry, we chose the bright line that
yielded the redshift most consistent with the photometric one (for example, [OII]3727Å instead of [OIII]5007Å, especially when
).
Such redshifts were considered to be less secure (“B” quality). In this case, the error on the redshift is proportional to the ratio
of the line FWHM over the S/N.
Emission-line redshifts thus determined range from (from Paschen-series lines) to (from [OII]3727Å).
Our 3 line flux limit is erg s-1 cm-2, without noticeable correlation of the S/N with either
F140W magnitude or redshift. We find 46 H emitters, in the range –1.5, and 48 H and [OIII] emitters between
and , not counting cluster members. Figure 3 shows the cumulative distribution of these field [OIII] emitters as a
function of line luminosity, as this latter population is perhaps more interesting in the context of future surveys such as Euclid
(e.g., Laureijs et al., 2011), which will have a spectroscopic wavelength coverage similar to WFC3. Note that Figure 3 shows the
measured, uncorrected counts and represents a lower limit: while all the sources are brighter than the photometric completeness limit, and
we can thus be reasonably certain that we are not missing any candidates, correcting for the spectroscopic incompleteness, which in this
case depends on contamination and thus the distribution of bright sources, is trickier. Ignoring cosmic variance and assuming a success
rate similar to ours, we can estimate that there should be up to 600 (respectively 6000) such detectable line emitting galaxies
per deg2 in the Euclid wide (respectively deep) survey.
3.1.1 Active Galactic Nuclei
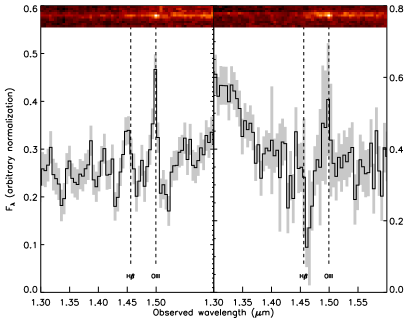
Two of the galaxies near the cluster core are X-ray sources, one detected in the soft band (as reported in Gobat et al., 2011) and
the other, tentatively, in the hard band. The spectra of these two sources have detectable [OIII]5007Å emission, as shown in Figure
5, and their redshifts were thus determined from these lines as described above. The position of the soft X-ray source is
actually occupied by a close pair of compact objects, within the same Chandra PSF, and we are not able to determine with confidence
whether the emission stems from one of the sources or both. We hereafter attribute the redshift to the brightest one.
The (tentative) hard X-ray detection is classified as an ETG on the basis of color and morphology and is included in the
sample of Strazzullo et al. (2013). However, we could not spectroscopically confirm its quiescent nature, as its spectrum is unusable below
14000Å, being too contaminated in all three orientations.
3.1.2 Comparison with Ground-based Spectra
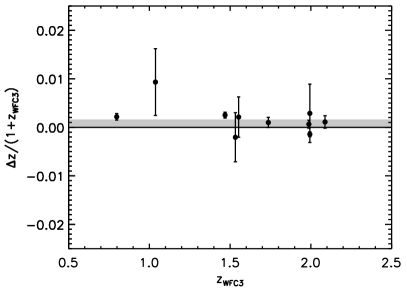
There are 10 galaxies in the HST/WFC3 field which have redshifts determined both from G141 and ground-based (VLT/FORS
and VLT/VIMOS) spectra, which allowed us to check the reliability of our WFC3-derived redshifts. We indeed find them to be
consistent, as shown in Figure 6, with a scatter of corresponding to a fraction of a WFC3
pixel.
3.2. Early-type and Non Emission-line Galaxies
The core of Cl J1449+0856 is dominated by a red galaxy population (Gobat et al., 2011).
From a purely photometric analysis, this results to be a mix of quiescent stellar populations and highly reddened systems, the spectra
of which mostly lack emission lines with the exception of the active galactic nucleus (AGN) mentioned above in Section 3.1.1.
This initial selection, described in Strazzullo et al. (2013), was based on a combination of rest-frame and colors (Wuyts et al., 2007) and SED
modeling. The quiescent or dusty nature of the spectroscopic members has been confirmed by the analysis described here, except for the AGNs
described above in Section 3.1.1.
For these red galaxies, the method described in Section 2.1 yielded the best results, while the output of the standard extraction was more
difficult to interpret.
As shown in Figure 1, there are five non-AGN quiescent galaxies in the
core with usable spectra. For these, as well as the rest of red continuum objects, we estimated redshifts by fitting stellar
population templates (Bruzual & Charlot, 2003), rebinned to the grism resolution and broadened by the galaxy’s profile in the case of extended
sources. We assumed delayed, exponentially declining star formation histories and included line emission based on the models’ star
formation histories as well as dust extinction, similar to the procedure described in Gobat et al. (2012).
Each fit was then visually inspected and the best-fit model compared to the SED. In a few cases where there was a significant
discrepancy between the model and the SED, or when the fit yielded significant secondary solutions (e.g., double-peaked probability
distributions), a combined fit was done including the SED. In the former case, the combined fit produced a best-fit stellar population
model more consistent with the observations but did not change the redshift very much, while in the latter it allowed us to discard
possible redshift solutions.
The quality of these redshifts was assigned after this inspection: when the spectrum had evident, easy to interpret features and the
uncertainty on the redshift measurement was small (), the fit was considered secure (“A” quality). On the other hand, in
cases where the SED was used, or when the redshift error was large (e.g., ), the estimate was deemed less secure
(“B” quality).
We were thus able to obtain redshifts for 11 quiescent non-AGN galaxies, both in the cluster and in the field, from to
(the latter being described in Gobat et al., 2012), as well as a dusty system in the cluster core.
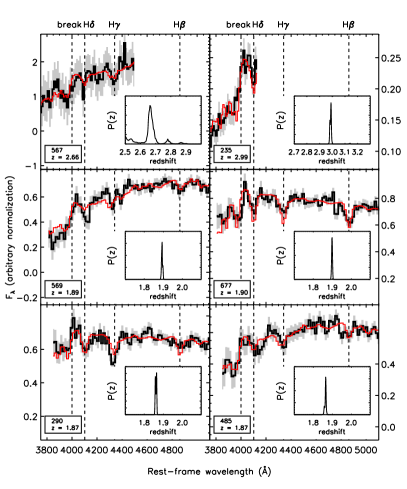
Interestingly, interlopers were the easiest to confirm, as they had relatively high S/N spectra and well defined absorption
features (which could result from their small sizes; see Strazzullo et al., 2013), as shown in Figure 7. More importantly, we could
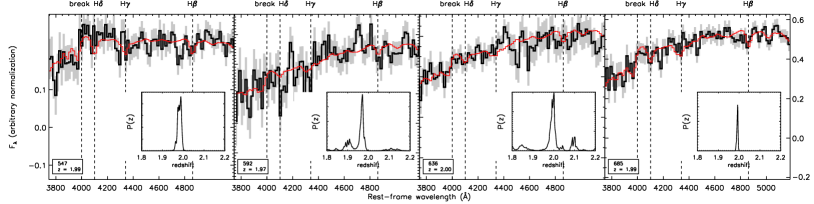
spectroscopically confirm the redshift of the quiescent candidates in the cluster core, which had so far been unfeasible, and thus
confirm without doubt the redshift of Cl J1449+0856. Their spectra are shown in Figure 8.
The spectroscopically confirmed quiescent galaxies have morphologies that can be described with a Sersic profile and are thus
classified as early-types in Strazzullo et al. (2013), with one exception: a quiescent cluster member, which is part of the central interacting system
(referred to as a “proto-BCG” in Gobat et al., 2011) and for which a reliable morphological fit could not be obtained.
In addition, two of the red galaxies in the cluster core have extended profiles which degrade the effective spectral resolution (one being
an ETG with an extended halo and the other a dusty star-forming system with clear merger-like features, respectively; IDs 583 and 621 in
Table 2). The fit on their spectra and SEDs
independently and consistently produced single (respectively quiescent and dusty) solutions and we include them as cluster members.
However, we consider their redshifts to be of low quality, due to the low S/N and resolution, and do not include the quiescent one in the
spectral stack and the subsequent analysis (see below).
While spectral extraction was performed on all photometrically selected quiescent galaxies in the HST/WFC3 field, with a photometric
redshift consistent with the presence of the 4000Å break in the spectral range, no other object yielded a usable spectrum.
Due to either too low S/N or too high contamination, the redshift of these objects could not be measured with
any degree of confidence. We note that most of the spectroscopically confirmed quiescent galaxies, save for two compact cluster members,
belong to the high-mass end of the galaxy population at , with (Strazzullo et al., 2013).
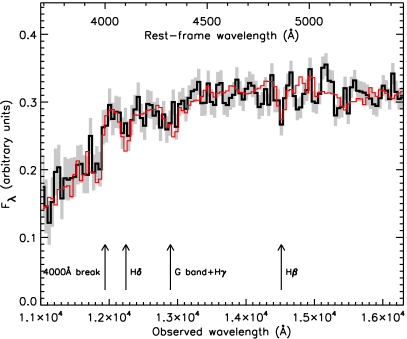
As a sanity check, we produced a high-quality stack from the spectra, in each orientation, of these four “good” quiescent cluster members.
As shown in Figure 9, this stacked spectrum displays clear features that are less prominent in the individual spectra.
4. Results
Having obtained the redshifts of quiescent galaxies in the cluster center, as well as active galaxies throughout the field, we can
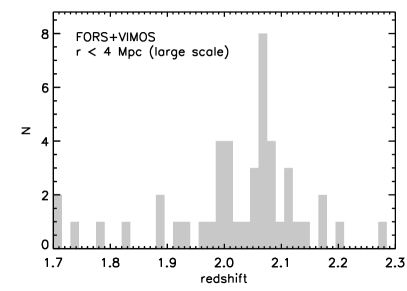
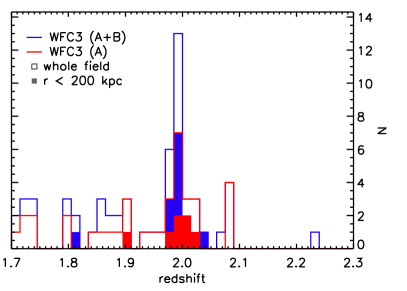
now securely confirm the redshift of Cl J1449+0856. However, the distribution of emission-line WFC3 redshifts peaks strongly at ,
as shown in Figure 10, instead of as reported in Gobat et al. (2011) using VLT spectra of sBzK-selected galaxies outside
the cluster core.
Also spectroscopically confirmed quiescent galaxies in the cluster core strongly peak at . In particular, two
components of the “proto-BCG” have consistent redshifts, although only one of them is secure (“A” quality).
We thus conclude that Cl J1449+0856 is indeed a real structure, but a little closer than previously thought. The full distribution,
including the redshifts from the previous, ground-based spectroscopy, has a biweight mean of with a scatter
of 0.013. We thus hereafter quote as the redshift of the cluster.
The scatter would imply a velocity dispersion of km s-1, incompatible with the relatively low mass
( ) derived from the cluster X-ray emission and richness. Although, in principle, it may suggest the presence
of substructure, we note that this scatter is close to the accuracy reached for red galaxies and “B” quality emission-line redshifts
and that it is thus very likely dominated by redshift uncertainties.
Accordingly, given the relatively large uncertainty on the redshift of individual galaxies and resulting scatter around the
peak, we consider as cluster member galaxies in the range .
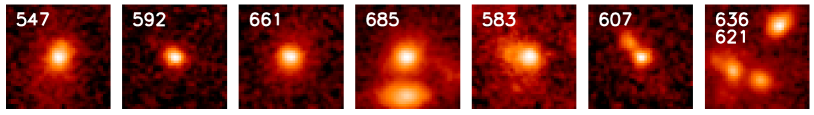
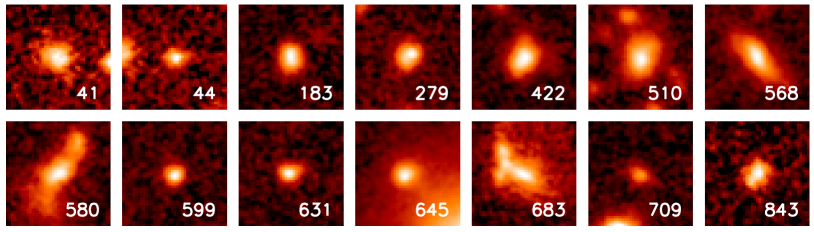
We have spectroscopically confirmed 22 objects at , including 5 quiescent galaxies, 2 emission line AGN and 16 star-forming
galaxies (1 dusty and 15 line-emitting), counting close pairs as a single source.
Images of the spectroscopic members, in the HST/WFC3 F140W band, are shown in Figure 11.
In addition, there are 5 more galaxies in the range not in the WFC3 dataset but with ground based redshifts,
for a total of 27 spectroscopic members, as listed in Table 2.
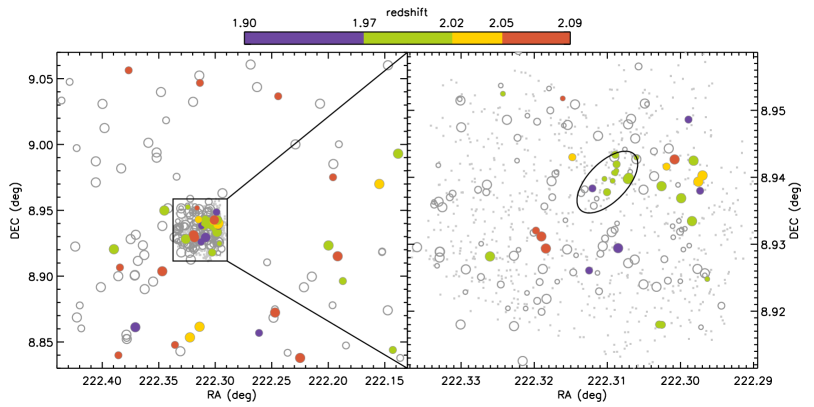
As shown in Figure 12, the spatial distribution of galaxies in the peak is quite different than that of those
in the one. They form a more concentrated structure, perhaps also slightly elongated in nature, although this could be an
artifact due to the number of bright sources (and thus potentially catastrophic contaminants) being higher on one side of the field.
Galaxies at lie in a sparser, more extended and possibly “sheet”-like structure in the background.
The previous misidentification, and redshift distributions seen in Figure 10, can then be easily explained by the
different observing capabilities of the two types of instruments used here and in Gobat et al. (2011):
the field of view of FORS and VIMOS is 10–20 times wider than the extension of Cl J1449+0856, which is a few hundred
kiloparsecs across and about one arcminute on the sky. Moreover, as slits cannot be placed closer than several arcseconds, these
instruments can sample only very few galaxies in the cluster core and, instead, are more effective at revealing the presence of
redshift spikes extending over many arcminutes. On the other hand, the WFC3 is much more effective in handling dense fields, such
as a cluster core.
It is certainly quite common to see several overdensities in redshift space along the same line of sight, though in this
case the cluster at and the sheet at appear to be very close to each other. The structure appears
to be much less dense than Cl J1449+0856 and to lack a red galaxy population. On the other hand, cluster and sheet are not
gravitationally bound, being separated by Mpc (comoving). As this implies an infall time larger than the age of the Universe,
the two structures, while part of the same portion of “cosmic web”, are unlikely to coalesce by .
Furthermore, we note that the slight redshift revision does not change much the mass of Cl J1449+0856: the intrinsic X-ray
luminosity becomes % dimmer
( keV erg s-1, assuming the same scaling relations as in Gobat et al., 2011),
corresponding to a mass % lower, of , i.e., within the uncertainty of the first
estimate. Likewise, the inferred radius does not change appreciably compared to our previous estimate as Mpc.
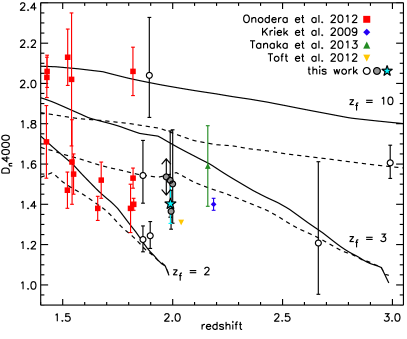
Finally, we compare age indicators for the quiescent cluster members, individual and stacked, with the field sample. We find that the stacked spectrum is consistent with a stellar population of star-formation-weighted age Gyr (i.e., a formation redshift of ), assuming solar metallicity, with little extinction (). This is in agreement with the strength of its 4000Å break ( as quantified by the 4000 index Balogh et al., 1999) and that of the individual quiescent cluster galaxies. We find that these values are consistent with those of field ETGs at in our sample and others (Toft et al., 2012; Onodera et al., 2012; Kriek et al., 2009), as shown in Figure 13. In apparent contrast with some observations of lower redshift, more evolved clusters (e.g., Gobat et al., 2008; Rosati et al., 2009; Rettura et al., 2011, but see also Muzzin et al. (2012)), there appears to be no detectable age difference (barring metallicity effects) between cluster and field quiescent galaxies. If true, this would suggest a similarity of stellar populations in already quenched galaxies in different environments at .
| ID | RA | Decl. | Redshift | Error | Quality | Instrument | MethodaaSpectrum fit or line identification | Object TypebbQuiescent, AGN, or star-forming (SF). | |
|---|---|---|---|---|---|---|---|---|---|
| (deg) | (deg) | ||||||||
| 547 | 222.3100399 | 8.9377762 | 23.42 | 1.98 | 0.02 | A | WFC3 | fit | Quiescent |
| 583 | 222.3092734 | 8.9394681 | 22.95 | 2.00 | 0.03 | B | WFC3 | fit | Quiescent,low S/N |
| 592 | 222.3106699 | 8.9390994 | 24.73 | 1.97 | 0.02 | B | WFC3 | fit | Quiescent |
| 636 | 222.3087650 | 8.9409647 | 23.60 | 1.99 | 0.03 | B | WFC3 | fit | Quiescent |
| 685 | 222.3060186 | 8.9429459 | 22.60 | 1.98 | 0.02 | A | WFC3 | fit | Quiescent |
| 661 | 222.3087325 | 8.9419476 | 23.44 | 2.002 | 0.001 | B | WFC3 | line | Quiescent,X-ray AGN |
| 607 | 222.3103930 | 8.9397659 | 24.30 | 1.992 | 0.005 | B | WFC3 | line | X-ray AGN |
| 621 | 222.3090911 | 8.9406764 | 22.67 | 1.99 | 0.02 | B | WFC3 | line | SF,dusty,low S/N |
| 41 | 222.3029141 | 8.9180000 | 24.01 | 1.995 | 0.002 | A | WFC3 | line | SF |
| 44 | 222.3025456 | 8.9179633 | 24.79 | 1.996 | 0.001 | A | WFC3 | line | SF |
| 183 | 222.2963297 | 8.9247956 | 23.44 | 1.994 | 0.020 | B | WFC3 | line | SF |
| 279 | 222.3260510 | 8.9281756 | 23.88 | 2.000 | 0.001 | A | WFC3 | line | SF |
| 422 | 222.2984180 | 8.9334464 | 22.76 | 1.988 | 0.002 | A | WFC3 | line | SF |
| 510 | 222.2998987 | 8.9368734 | 22.77 | 1.995 | 0.001 | A | WFC3 | line | SF |
| 568 | 222.3025838 | 8.9386765 | 22.46 | 1.980 | 0.004 | A | WFC3 | line | SF |
| 580 | 222.3071947 | 8.9397384 | 22.75 | 2.004 | 0.001 | A | WFC3 | line | SF |
| 599 | 222.2975461 | 8.9393429 | 24.52 | 2.017 | 0.003 | A | WFC3 | line | SF |
| 631 | 222.2969763 | 8.9402737 | 24.73 | 2.001 | 0.009 | A | WFC3 | line | SF |
| 645 | 222.3019033 | 8.9415953 | 22.84 | 2.020 | 0.010 | A | WFC3 | line | SF |
| 683 | 222.2982125 | 8.9424841 | 24.01 | 1.974 | 0.030 | B | WFC3 | line | SF |
| 709 | 222.3089050 | 8.9433599 | 24.99 | 1.990 | 0.009 | A | WFC3 | line | SF |
| 843 | 222.3242837 | 8.9524799 | 24.43 | 1.984 | 0.001 | A | WFC3 | line | SF |
| 22111 | 222.3450108 | 8.9498639 | … | 2.004 | 0.001 | A | FORS2 | fit | SF |
| 1127 | 222.3224030 | 8.8534632 | … | 2.014 | 0.001 | A | VIMOS | fit | SF |
| 141.2 | 222.1997986 | 8.9233017 | … | 2.004 | 0.001 | A | VIMOS | fit | SF |
| 1411.3 | 222.1871033 | 8.8962622 | … | 1.991 | 0.002 | B | VIMOS | fit | SF |
| 1438 | 222.1428833 | 8.8439026 | … | 1.970 | 0.002 | B | VIMOS | fit | SF |
5. Summary
We have used deep grism observations with HST/WFC3 to study the distribution of galaxies in a arcmin2 field
centered on the distant cluster Cl J1449+0856. We have obtained redshifts for 140 out of 474 sources in the HST/WFC3 field with
extracted spectra, down to a F140W magnitude of 25.5, with a success rate of % at in the uniform coverage area.
While these WFC3 observations are unusually deep, the crowding of the field and faintness of our targets presented a technical challenge.
To recover usable spectra in spite of strong contamination, in some cases we had to use a more sophisticated extraction technique than
currently implemented in the standard software. This allowed us to achieve the following main results:
We have securely measured the redshift of Cl J1449+0856 by spectroscopically identifying many cluster members, including
several ETGs in its core, which had so far proven to be unfeasible with ground-based observations. We have found that
the redshift of previously published for this cluster actually stems from a chance alignment with a more diffuse, sheet-like structure
in the background. The WFC3 observations, which cover the cluster up to its putative virial radius, instead reveal that the galaxies in
the core, including the quiescent galaxies, strongly peak at .
These galaxies had anyway been assigned to the cluster in our previous study based on photometric redshifts, whose uncertainty is
larger than the separation of the two peaks. The cluster Cl J1449+0856 and the overdensity may be part of a same large-scale
structure but, being comoving Mpc apart, do not appear to be gravitationally bound to each other.
The grism spectroscopy confirms the quiescent nature of the photometrically selected passive candidates in the cluster.
We have constructed a high S/N average spectrum of the quiescent cluster members which indicates an age of Gyr for the bulk of
stellar populations in these galaxies, in agreement with the 4000Å break strength of individual galaxies. Under the assumption of
similar metallicity, this is consistent with the age inferred for the quiescent field galaxies at .
We have assembled the first sample of spectroscopically confirmed quiescent galaxies in a high density environment at
. We have used these objects together with ETGs in the field around the cluster to constrain the effect of environment on galaxy
properties at (Strazzullo et al., 2013).
These results illustrate the importance of a thorough spectroscopic follow-up of the quiescent galaxy population in high-redshift
clusters and cluster candidates. They also demonstrate the unique capabilities of the WFC3 instrument, especially for continuum science.
This is particularly relevant in light of the success of photometric cluster searches which are now effectively approaching the
range. Yet, the analysis of slitless spectroscopic data becomes more challenging the deeper the observations and more
crowded the field, hence an optimized reduction strategy is indispensable for maximizing the scientific return of HST observations.
References
- Andreon et al. (2009) Andreon, S., Maughan, B., Trinchieri, G., & Kurk, J., 2009, A&A, 507, 147
- Balogh et al. (1999) Balogh, M.L., Morris, S.L., Yee. H.K.C., Carlberg, R.G., & Ellingson, E., 1999, ApJ, 527, 54
- Barbosa et al. (1996) Barbosa, D., Bartlett, J.G., Blanchard, A., & Oukbir, J., 1996, A&A, 314, 13
- Bertin & Arnouts (1996) Bertin, E., & Arnouts, S. 1996, A&AS, 117, 393
- Brammer et al. (2012) Brammer, G.B., van Dokkum, P.G., Franx, M., et al. 2012, ApJS, 200, 13
- Bruzual & Charlot (2003) Bruzual, G. & Charlot, S., 2003, MNRAS, 344, 1000
- Cimatti et al. (2008) Cimatti, A., Cassata, P., Pozzetti, L., et al. 2008, A&A, 482, 21
- Daddi et al. (2004) Daddi, E., Cimatti, A., Renzini, A., et al., 2004, ApJ, 617, 746
- Eisenhardt et al. (2008) Eisenhardt, P.R.M., Brodwin, M., Gonzalez, A.H., et al., 2008, ApJ, 684, 905
- Fassbender et al. (2011) Fassbender, R., Nastasi, A., Böhringer, H., et al., 2011, A&A, 527, 10
- Gladders & Yee (2000) Gladders, M.D., & Yee, H.K.C., 2000, AJ, 120, 2148
- Gobat et al. (2008) Gobat, R., Rosati, P., Strazzullo, V., et al. 2008, A&A, 488, 853
- Gobat et al. (2011) Gobat, R., Daddi, E., Onodera, M., et al. 2011, A&A, 526, 133
- Gobat et al. (2012) Gobat, R., Strazzullo, V., Daddi, E., et al., 2012, ApJ, 759, 44
- Hatch et al. (2011) Hatch, N.A., De Breuck, C., Galametz, A., et al., 2011, MNRAS, 410, 1537
- Kodama et al. (2007) Kodama, T., Tanaka, I., Kajisawa, M., et al., 2007, MNRAS, 377, 1717
- Koyama et al. (2013) Koyama, Y., Kodama, T., Tadaki, K., et al., 2013, MNRAS, 428, 1551
- Kriek et al. (2009) Kriek, M., van Dokkum, P.G., Labbé, I., et al., 2009, ApJ, 700, 221
- Kümmel et al. (2009) Kümmel, M., Walsh, J.R., Pirzkal, N., Kuntschner, H., & Pasquali, A., 2009, PASP121, 59
- Laureijs et al. (2011) Laureijs, R., Amiaux, J., Arduini, S., et al., 2011, Euclid Definition Study Report, arXiv:1110.3193
- Mei et al. (2009) Mei, S., Holden, B.P., Blakeslee, J.P., et al., 2009, ApJ, 2009, 690, 42
- Mullis et al. (2005) Mullis, C.R., Rosati, P., Lamer, G., et al., 2005, ApJ, 623, 85
- Muzzin et al. (2012) Muzzin, A., Wilson, G., Yee, H.K.C., et al., 2012, ApJ, 746, 188
- Muzzin et al. (2013) Muzzin, A., Wilson, G., Demarco, R., et al., 2013, ApJ, 767, 39
- Onodera et al. (2012) Onodera, M., Renzini, A., Carollo, M., et al., 2012, ApJ, 755, 26
- Overzier et al. (2006) Overzier, R.A., Miley, G.K., Bouwens, R.J., et al., 2006, ApJ, 637, 58
- Papovich et al. (2010) Papovich, C., Momcheva, I., Willmer, C.N.A., et al., 2010, ApJ, 716, 1503
- Pentericci et al. (1997) Pentericci, L., Roettgering, H.J.A., Miley, G.K., Carilli, C.L., McCarthy, P., 1997, A&A, 326, 580
- Reichardt et al. (2013) Reichardt, C.L., Stalder, B., Bleem, L.E., et al., 2013, ApJ, 763, 127
- Rettura et al. (2010) Rettura, A., Rosati, P., Nonino, M., et al., 2010, ApJ, 709, 512
- Rettura et al. (2011) Rettura, A., Mei, S., Stanford, S.A., et al., 2011, ApJ, 732, 94
- Romer et al. (2001) Romer, A.K., Viana, P.T.P., Liddle, A.R., & Mann, R.G., 2001, ApJ, 547, 594
- Rosati et al. (1998) Rosati, P., della Ceca, R., Norman, C., & Giacconi, R., 1998, ApJ, 492, 21
- Rosati et al. (2004) Rosati, P., Tozzi, P., Ettori, S., et al., 2004, AJ, 127, 230
- Rosati et al. (2009) Rosati, P., Tozzi, P., Gobat, R., et al., 2009, A&A, 508, 583
- Santos et al. (2011) Santos, J.S., Fassbender, R., Nastasi, A., et al., 2011, A&A, 531, 15
- Spitler et al. (2012) Spitler, L., Skielboe, A., & Hansen, S.H. 2012, ApJ, 748, 21
- Stanford et al. (1997) Stanford, S.A., Elston, R., Eisenhardt, P.R., et al., 1997, AJ, 114, 2232
- Stanford et al. (2006) Stanford, S.A., Romer, A.K., Sabirli, K., et al., 2006, ApJ, 646, 13
- Stanford et al. (2012) Stanford, S.A., Brodwin, M., Gonzalez, A.H., et al., 2012, ApJ, 753, 164
- Steidel et al. (2005) Steidel, C.C., Adelberger, K.L., Shapley, A.E., et al., 2005, ApJ, 626, 44
- Strazzullo et al. (2013) Strazzullo, V., Gobat, R., Daddi, E., et al. 2013, ApJ, 772, 118
- Sunyaev & Zel’dovich (1972) Sunyaev, R.A., & Zel’dovich, Y.B., 1972, CoASP, 4, 173
- Tanaka et al. (2010) Tanaka, M., Finoguenov, A., & Ueda, Y., 2010, ApJ, 716, 152
- Tanaka et al. (2013) Tanaka, M., Toft, S., Marchesini, D., et al., 2013, ApJ, 772, 113
- Thomas et al. (2005) Thomas, D., Maraston, C., Bender, R., & Mendes de Oliveira, C., 2005, ApJ, 621, 673
- Toft et al. (2012) Toft, S., Gallazzi, A., Zirm, A.W., et al., 2012, ApJ, 754, 3
- Tozzi et al. (2013) Tozzi, P., Santos, J.P., Nonino, M., et al., 2013, A&A, 551, A45
- Trump et al. (2011) Trump, J.R., Weiner, B.J., Scarlata, C., et al., 2011, ApJ, 743, 144
- Venemans et al. (2007) Venemans, B.P., Röttgering, H.J.A., Miley, G.K., et al., 2007, A&A, 461, 823
- Wilson et al. (2008) Wilson, G., Muzzin, A., Lacy, M., et al., 2008, in ASP Conf. Ser., 381, The Second Annual Spitzer Science Center Conference: Infrared Diagnostics of Galaxy Evolution, ed. R.-R. Chary, H.I. Teplitz, & K. Sheth (San Francisco, CA: ASP), 210
- Wuyts et al. (2007) Wuyts, S., Labbé, I., Franx, M., et al. 2007, ApJ, 655, 51
- Zirm et al. (2008) Zirm, A.W., Stanford, S.A., Postman, M., et al., 2008, ApJ, 680, 224