Galaxy evolution in overdense environments at high redshift:
passive early-type galaxies in a cluster at redshift 2
Abstract
We present a study of galaxy populations in the central region of the IRAC-selected, X-ray detected galaxy cluster Cl J1449+0856 at . Based on a sample of spectroscopic and photometric cluster members, we investigate stellar populations and morphological structure of cluster galaxies over an area of 0.7Mpc2 around the cluster core. The cluster stands out as a clear overdensity both in redshift space, and in the spatial distribution of galaxies close to the center of the extended X-ray emission. The cluster core region ( kpc) shows a clearly enhanced passive fraction with respect to field levels. However, together with a population of massive passive galaxies mostly with early-type morphologies, it also hosts massive actively star-forming, often highly dust-reddened sources. Close to the cluster center, a multi-component system of passive and star-forming galaxies could be the future BCG still assembling. We observe a clear correlation between passive stellar populations and an early-type morphology, in agreement with field studies at similar redshift. Passive early-type galaxies in this clusters are typically a factor 2-3 smaller than similarly massive early-types at , but also on average larger by a factor than their field analogs at , lending support to recent claims of an accelerated structural evolution in high-redshift dense environments. These results point towards the early formation of a population of massive galaxies, already evolved both in their structure and stellar populations, coexisting with still-actively forming massive galaxies in the central regions of young clusters 10 billion years ago.
Subject headings:
galaxies: clusters (Cl J1449+0856) – galaxies: evolution – galaxies: high redshift – galaxies: structure – galaxies: stellar content1. Introduction
In the nearby Universe and at least up to z1, overdense environments, and specifically galaxy cluster cores, are invariably found to preferentially host galaxy populations dominated by massive, passive early-type galaxies (e.g., among many others, Dressler 1980, Postman et al. 2005, Baldry et al. 2006, van der Wel et al. 2007, Patel et al. 2009, Rosati et al. 2009, Peng et al. 2010b, Wetzel et al. 2012). The way these galaxies are formed and evolve is a longstanding matter of debate, with different pieces of their formation history, and in particular peculiarities with respect to field galaxies, being put together thanks to high-redshift observations (e.g., van Dokkum & van der Marel 2007, Gobat et al. 2008, Mei et al. 2009, Rettura et al. 2010) as well as fossil-record studies (e.g., Thomas et al. 2005, 2010). Most studies agree on the early formation of a population of massive cluster early-types, with their stars formed at high redshift ( or beyond), and their mass largely assembled before (e.g., De Propris et al. 2007, Lidman et al. 2008, Andreon 2008, Mancone et al. 2010, Strazzullo et al. 2010).
While detailed studies of cluster galaxy populations are relatively common up to redshift one, they become increasingly rarer at higher redshifts, and in particular beyond , due to observational challenges both in reliably identifying clusters, and in accurately determining the properties of their galaxies. Nonetheless, the range is a crucial epoch to study massive cluster galaxies close to their main formation epoch. Indeed, recent observations of clusters started to show that massive galaxy populations are often in a still active formation stage, even in the cluster core (e.g., Tran et al. 2010, Hilton et al. 2010, Hayashi et al. 2010, 2011, Santos et al. 2011, Fassbender et al. 2011b).
From the theoretical point of view, current models, while invoking an early formation for the stars ending up in massive early-type galaxies today, maintain their hierarchical nature in predicting the late assembly of their stellar mass from smaller, mostly passive progenitors (e.g., De Lucia et al. 2006, Johansson et al. 2012). The relevance of such merging events, as well as of other processes (e.g., AGN or stellar feedback), possibly affecting both the star formation history and the galaxy structure in the evolutionary path of these systems, may be probed by the (albeit biased and complicated) comparison of cluster galaxy samples at different redshifts.
Reaching the cosmic epochs when massive cluster galaxies are still forming is thus fundamental in order to directly observe the formation of the bulk of the stars, the way stellar mass is assembled, and their morphological evolution, that together lead to the massive early-types dominating cluster cores at later times.
Ideally, this kind of investigation is carried out in clusters which are not pre-selected based on the characteristics of their galaxy populations, but rather based on their mass or overdensity. At this redshift, and with current facilities, X-ray selection becomes very challenging for the identification of moderately massive systems representative of the progenitors of typical lower-redshift clusters. On the other hand, “IRAC-selected” clusters identified based on overdensities of stellar mass-limited galaxy samples (Eisenhardt et al. 2008, Papovich 2008), ideally with a-posteriori detection of a (generally faint) X-ray emission, offer a suitable alternative for the identification of clusters beyond .
In this work, we study galaxy populations in the IRAC-selected and X-ray detected cluster Cl J1449+0856 at (RA = 14h49m14s, Dec = , Gobat et al. 2011, 2013). This is among the most distant spectroscopically confirmed galaxy clusters discovered so far, and the most distant with a detected X-ray emission. The first spectroscopic investigation with VLT/VIMOS and FORS2 spectroscopy on a wide field around the cluster, found a peak in the redshift distribution of star-forming galaxies at (Gobat et al. 2011).
Subsequent follow-up on the cluster center with slitless HST/WFC3 spectroscopy, unveiled a much stronger peak in the redshift distribution at z=2, which is the most prominent peak in the area of the galaxy overdensity, and contains about 20 spectroscopic cluster members to date, including spectroscopically confirmed massive passive red galaxies in the cluster core (Gobat et al. 2013). Cl J1449+0856 is thus now spectroscopically confirmed to be at z=2.
Given the massive use of photometric redshifts required to carry out this work, we are not able to distinguish galaxies at z=2 from galaxies at z=2.07, and we thus retain sources belonging to the z=2.07 structure in our sample of candidate members (unless a spectroscopic redshift is available). On the other hand, as discussed in detail in the Gobat et al. (2013) companion paper, the z=2.07 redshift peak seems to be associated to a large scale, less prominent, diffuse structure, which does not significantly contribute to the overdensity in the central cluster region studied here, and is likely not to significantly affect most of the results presented in this work.
A wide multi-wavelength coverage, and high-resolution restframe optical imaging, allow us to study in detail fundamental properties of cluster galaxies already 10 billion years ago. In particular, we focus in this paper on the identification of a population of passive candidate members, and on their structural properties. The trademark cluster-core galaxies up to , massive galaxies with low star formation are in fact expected to be significantly rarer by redshift two, approaching the epoch where not only they are still forming many of their stars, but also when velocity dispersion in the cluster core is still low enough that merging-driven mass assembly can play an important role. Although conclusive evidence is still lacking, the early merging of already gas-poor galaxies in an overdense environment might also affect the structural properties of the resulting massive, passive systems, producing galaxies which are structurally more evolved than their field counterparts. While statistics are still poor, Cl J1449+0856 offers one of the very rare chances of studying passive early-types very close to their formation epoch, together with still actively forming galaxies, in an already relatively evolved cluster core.
Throughout this work we assume =0.3, =0.7, H0=70 km s-1 Mpc-1, and a Salpeter (1955) IMF. Magnitudes and colors are in the AB system.
2. Data and sample selection
2.1. Catalogs and derived quantities
2.1.1 Photometry
We use photometry measured on imaging in the U,V (VLT/FORS), B,R,i,z (Subaru/Suprime-Cam), Y,J,H,Ks (Subaru/MOIRCS, plus additional VLT/ISAAC data for J and Ks), F140W (HST/WFC3), and 3.6,4.5m (Spitzer/IRAC) bands. Sources were extracted with SExtractor (Bertin & Arnouts 1996) on the F140W image, and photometry was measured in two ways, producing two independent multi–wavelength catalogs. One catalog is based on aperture photometry (1.5”) measured with SExtractor, corrected for the different resolution of the images by using aperture corrections estimated on each image from the growth curve of point–like sources. The other catalog is based on photometry measured on each image by fitting with Galfit (Peng et al. 2002, 2010a) Gaussian profiles, convolved with the image PSF, at the position of the F140W sources. While the two approches yield broadly consistent measurements, in most cases aperture photometry will be more accurate111Note that this is not a general statement: it is true, as results from simulations, given the specific approach and settings we use. A further indication of the generally more accurate aperture photometry in our case, comes from photo-z performance as discussed in section 2.1.2.. On the other hand, and especially in crowded fields typical of a cluster core, blending may be a severe issue and the second approach offers a way to deal with it. In order to take this into account, in the following we will use both catalogs as described in detail in section 2.1.2.
In the following we select a sample with (corresponding to the limit in a 1” aperture), within an area of 3.3 square arcminutes uniformly covered in the WFC3/F140W imaging. This catalog contains 370 objects. Seven point-like sources (in the F140W image) down to were removed; at fainter magnitudes, we further removed sources which may be stars based on their BzK colors (Daddi et al. 2004). The inclusion or removal of these sources has no impact on the results of this work. The galaxy sample we use in the following thus contains 330 galaxies down to .
2.1.2 Photometric redshifts
From the 13-bands photometry, we estimated photometric redshifts (photo–zs) with EAZY, using the standard set of templates (Brammer et al. 2008, 2011, Whitaker et al. 2011). Before the actual photo–z estimation, we determined possible offsets in the photometry in different bands by iteratively comparing the best-fit vs. measured photometry at fixed (spectroscopic) redshift (e.g., Capak et al. 2007, Ilbert et al. 2009) for a sample of sources with redshifts measured from WFC3 grism spectroscopy over the whole WFC3-covered field222Out of these, 94 are in the uniformly covered WFC3 image area used in the following analysis of galaxy populations, the remaining being located in the external part of the WFC3 image. (Gobat et al. 2013). Systematic offsets between measured photometry and model SED for spectroscopic sources can be attributed to different causes including zero-point and/or aperture correction errors, as well as model uncertainties333For our catalogs and with our settings, offsets were in most cases 10-20%, except for bands with large uncertainties in the determination of the photometric zero-point – as often suggested also by comparison of SEDs of stars with stellar templates – and/or in the instrument response function.. In the following, we use photometry corrected for these systematic offsets; we note that the offsets determined for the two independent photometric catalogs (SExtractor- and Galfit-based) are generally consistent within 10%.
The interquartile redshift range of the spectroscopic sample is z=[1.1-2] (with redshifts up to z3), and its interquartile range is =[22.7-24.3] (reaching up to ). Therefore, while compared to the whole sample of sources the spectroscopic sample is obviously typically brighter, it can still be considered generally representative of sources in the magnitude and redshift ranges that are the focus of this study.
Photo–zs were determined for both (SExtractor- and Galfit-based) catalogs, and for the SExtractor catalog they were also determined excluding the IRAC bands. The comparison of these three different photo-z determinations was used to improve the photo–z accuracy, selecting for each source the best estimate to be used, as follows. By comparison with the spectroscopic catalog, we find that photo–zs determined from aperture photometry including IRAC bands show the lowest scatter, but also a significant fraction of outliers (almost 10%). For sources in the magnitude range typical of our spectroscopic sample, outliers may be due to fatal errors and/or degeneracies (e.g., a double-peaked photo–z probability distribution), with these conditions worsened by systematic offsets in the photometry (of some bands) due to bad resolution (and thus contamination by neighboring sources). In such cases, the Galfit-based photometry – and thus the derived photo-z – may be more accurate than SExtractor aperture photometry, as discussed above.
We identified sources potentially affected by neighbor’s contamination by selecting in the Ks and 3.6m bands objects which were falling in the circle contaning 99% of the flux of a different source444This approach is quite conservative in that it does not make assumptions on the relative flux of the neighbors and includes potential contamination also from much fainter sources.. In the area and magnitude range that we use in this work, about 10% of our sample is classified as potentially contaminated at the K-band resolution (0.65”), and 50% at the IRAC resolution (2”).
For uncontaminated sources we use photo-zs from the SExtractor catalog, as well as for sources where only the IRAC photometry is flagged as potentially contaminated and the SExtractor-based photo-zs with and without IRAC bands are consistent. For the remaining sources (about 20% of the sample) photos-zs from the Galfit catalog are used.
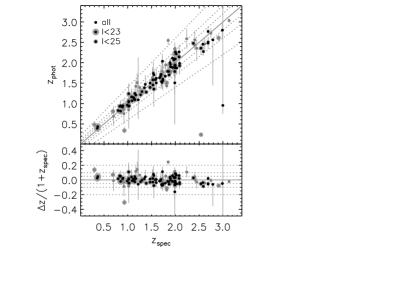
Applying this approach and comparing to the spectroscopic sample, and in spite of the comprehensibly smaller fraction (30%) of potentially contaminated sources in the spectroscopic vs. the full sample (50%), we find that we can significantly reduce the fraction of catastrophic outliers, while retaining the higher photo-z accuracy obtained with aperture photometry for the majority of the sample. The final photo-z catalog we use in the following has a scatter (as estimated with the normalized median absolute deviation (NMAD), Hoaglin et al. 1983) of 5.7% in , and 3% catastrophic outliers () (at least half of these have a “less reliable” spectroscopic redshift determination, see Figure 1). The comparison of photometric redshifts with the available spectroscopic sample is shown in Figure 1. For comparison with other studies, we note that, thanks to the WFC3 slitless spectroscopy, the spectroscopic sample we use is considerably deeper than those generally obtained from ground-based spectroscopy, with the median I band magnitude of our spectroscopic sample 25, and almost 80% of the sample fainter than I=24. For instance, considering only spectroscopic sources brighter than I=25 (23) the NMAD scatter of would be 4.5% ().
2.1.3 Stellar masses
Stellar masses were determined with FAST (Kriek et al. 2009) on the 13-bands U to 4.5m photometry, using Bruzual & Charlot (2003, hereafter, BC03) delayed exponentially declining star formation histories (SFHs, ) with 0.0110 Gyr, solar metallicities, Salpeter IMF, and the Calzetti et al. (2000) reddening law with E(B-V) up to 1 mag. Stellar masses were independently derived for both the SExtractor and the Galfit catalogs: for sources where contamination was expected to significantly affect the aperture-based SED, as discussed concerning photo-zs in section 2.1.2, stellar masses from the Galfit catalog were used.
Masses from the SExtractor catalog were corrected to ”total” masses using the ratio between AUTO and aperture flux in the detection image (F140W). For the sample, more than 90% of the objects have a correction lower than , and only 3% of sources have correction factors . While this approach corrects for the bulk of the flux loss, we note that it still relies on approximating the total flux with FLUX_AUTO, and it is based on just one band thus neglects any color gradient within the galaxy. In this respect, we note that the systematic offset between stellar masses from the Galfit catalog and the two SExtractor catalogs (with and without IRAC, corrected to total masses) is less than 0.1dex, with a scatter of up to 0.3dex. Leaving the metallicity free, and using exponentially declining SFHs rather than delayed exponentials, would introduce no systematics for the overall sample and a further scatter of less than 0.1dex in stellar mass (which is small compared to the scatter estimated above at fixed metallicity and SFH). With respect to the choice of the SFH, we note that it has been shown how other forms of SFHs might be more appropriate for star-forming galaxies at high redshift (Maraston et al. 2010, Papovich et al. 2011). For what directly concerns this work, rising or constant (possibly truncated) SFHs would change the stellar masses of our targets negligibly, and in any case well within the estimated errors. Other parameters which may be more affected by the SFH choice (like, notably, star formation rates and ages of star-forming galaxies) are not used in this paper.
On the other hand, using Maraston (2005, hereafter, M05) rather than BC03 models would produce stellar masses systematically smaller (overall for the sample of interest) by a factor 0.15dex, with a scatter of 0.15dex; this is discussed in detail below, where relevant. After accounting for the overall 0.15dex systematic offset, the stellar mass determinations with BC03 and M05 models (with metallicity either fixed to Z⊙ or allowed to vary within a factor 2 from a Z⊙) are consistent within a factor of at most 2 for 90% of the sample of interest.
Finally, the median formal error on stellar masses for our sample of candidate members is 0.2-0.3 dex (or 0.1-0.15 dex for m). In summary, we thus estimate a typical accuracy of about a factor 2 for the stellar mass determination for our targets.
2.2. Morphological analysis
A rough indication of galaxy structure (early type vs. late type), effective radius and ellipticity, was obtained by modeling of the 2D surface brightness distribution, carried out with Galfit (version 3) assuming a single Sersic profile for each F140W-detected source. The modeling was performed on the WFC3 F140W image, which has the best resolution in our data set, and probes the restframe optical light (approximately B band) at the cluster redshift. We used a PSF built from the data by using median stacking of 6 high S/N stars in the field. The background was measured and subtracted locally over the whole image, and was fixed to zero in the fit. The whole image (and thus each source) was fitted multiple times, split in overlapping cutouts of different sizes555For each source, the final estimate of each parameter was calculated as the median among all fits with residuals of 25% on at least 90% of the S/N10 pixels. Overall, 3/4 (1/2) of the sources in the magnitude range of interest (, see below) has results derived from the median of at least 5 (10) different fits, respectively., modeling simultaneously all sources in the cutout.
In order to estimate the reliability of the results as a function of magnitude and profile type, specifically for the image and fitting settings that we used, we carried out simulations of the fitting procedure by adding synthetic sources in blank parts of the image. Sources with a range of magnitudes, , radius, ellipticity and position angle were added and then fitted with Galfit using the same procedure used for real objects. These simulations provide an estimate of the reliability of our analysis in somewhat “optimistic conditions”, since they assume that sources are relatively isolated, regular Sersic profiles, convolved with the same PSF that we use for the actual fitting. The input flux is recovered within down to (corresponding to 30 times the noise in a 1” aperture). At this magnitude, these simulations suggest that the error on the semi-major axis is 10, 15, 25% for profiles with 1.5, 1.5-3, 3, respectively, while the error on the Sersic index is between for late-type profiles and for early-type profiles. In addition, as it is known from previous work (e.g., Trujillo et al. 2006b, Sargent et al. 2007, Pannella et al. 2009) at faint magnitudes the Sersic index of high-Sersic profiles tends to be underestimated; with our settings, at , these simulations find a median offset in the Sersic index of about for early-type profiles (disk-like profiles are unaffected). This systematic underestimation is negligible down to , where errors on semi-major axis are 5%, 20%, and errors on 15%, 20%, for low- and high-Sersic profiles, respectively. All parameters, for all kinds of profiles, are retrieved at better than 10% down to (corresponding to S/N100 in a 1” aperture).
Based on these simulations we set as the limiting magnitude where we consider our surface brightness modelling reliable. Beside the general sample, we will thus consider this sample for the morphological analysis. Galaxy sizes quoted in the following are the circularised half-light radii, calculated from the Galfit-based parameters as the effective semi-major axis times the square root of the axis ratio.
2.3. The candidate member sample
A spectroscopic redshift is measured for about one fourth of the sample, and for 45% of the sample. Based on the available spectroscopy, and otherwise on the photo-z analysis, we thus determine which sources in our sample are (candidate) cluster members.
We select as spectroscopic members all sources with spectroscopic redshift . All other spectroscopic sources are considered interlopers. From the spectroscopic sample of Gobat et al. (2013), we retain 14 cluster members in the area studied in this work. One source in the range, close to the edge of the studied area, is not in our catalog being close to a bright star. From its spectrum it is classified as a star forming source, and given its position more than 600 kpc away from the cluster center it would not alter (if anything it would rather reinforce) the conclusions of this study. Furthermore, an X-ray detected AGN classified as a cluster member in Gobat et al. (2013) is not included in our member sample. This source appears to have a very close neighbor at distance (with undetermined redshift), producing a likely significant contamination to its observed SED. Assuming that both sources belong to the cluster, and that the measured photometry is not significantly altered by the emission of the AGN, the total observed SED produced by both sources would suggest a dusty star-forming stellar population. The morphology of the AGN host appears very compact, essentially unresolved (although its magnitude is close to the limit where we can carry out a reliable morphological analysis). Because of such considerable uncertainties in determining the properties of this source, we will not consider it in the following analysis of galaxies in Cl J1449+0856.
For all sources without an available spectroscopic redshift, we rely on photo-zs. In determining membership by photo-zs, we decided not to purely rely on the redshift probability distribution estimated by EAZY for each object. We adopted instead an hybrid approach, taking into account also the “empirical” photo-z uncertainty as independently determined by comparison with the spectroscopic sample. By analysing photo-z results for spectroscopic sources (for the full spectroscopic sample, not just cluster members) as a function of photo-z probability distribution and quality of the best fit, we first estimated the likely reliability of a photo-z given its odds and calculated by EAZY (within our catalog). Based on such comparison, we deemed as “most reliable” photo-zs with odds98% and a within three times the median in our catalog. To the other extreme, we defined as “unreliable” photo-zs with odds lower than 95%, or with worse than six times the median .
For the purpose of membership assignment, the full sample was then split in three classes of objects, identified as interlopers, “likely” candidate members, and “possible” candidate members (which are lower-priority candidates, mainly due to a more uncertain photo-z determination), as follows. Based on the observed scatter of z/(1+z) (Sec. 2.1.2), and considering the estimated low fraction of catastrophic failures, all galaxies with a photo-z beyond 2 from the cluster redshift are considered interlopers, except those within 3.5 and with a photo-z deemed unreliable, which are retained as possible members. All galaxies with a photo-z within 2 from the cluster redshift are considered as possible members, unless they have a highly reliable photo-z and an integrated photo-z probability distribution within 1 of the cluster redshift666That is, . 30%, which classifies them as likely members. All galaxies with a photo-z within 1 of the cluster redshift are selected as likely members.
Likely members make up 15% of the full sample, and a further 15% is made of possible members. The remaining % of the full sample is rejected as foreground (55%) or background (15%) interlopers.
For comparison with other studies, we note that 3/4 of galaxies selected as likely members have 30% (with 20% for almost all likely members), and in turn 80% of galaxies with 30% are classified as likely members, making the likely-member selection roughly similar to that used by e.g., Tran et al. (2010), Papovich et al. (2012). On the other hand, possible members have as low as , with an interquartile range of of about 6-22%. The inclusion of possible members thus brings our selection closer to more conservative -based criteria adopted by other studies as e.g., Tanaka et al. (2012), Raichoor & Andreon (2012). In fact, in this work galaxies with a larger than 10% are essentially always included in the candidate sample (as either likely or possible members), unless they are spectroscopic interlopers. Overall, the selection we use is thus quite conservative, which is reflected in the considerations about completeness and contamination discussed below.
2.3.1 Completeness and contamination of the candidate member sample
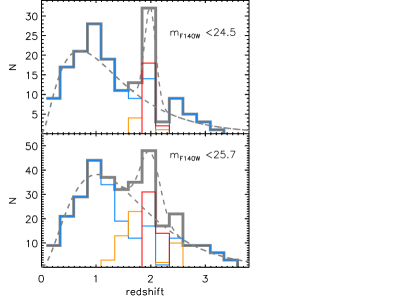
Figure 2 shows the redshift distribution in the considered area, down to 24.5 and 25.7, highlighting the different contribution of interlopers vs. possible and likely candidate cluster members. The presence of the cluster on the underlying field redshift distribution is clearly visible, even in this distribution largely based on photo-zs. By comparison with comoving number densities measured in wide fields (e.g. Muzzin et al. 2013) the comoving number density of massive (M⊙) galaxies at (the photo-z range most affected by cluster members) in the area within 150 kpc from the cluster center, is about 30 times larger than in the general field ( dex)777We verified that the comoving number density measured in our field in the range, which is not affected by the cluster, is in excellent agreement with what measured by Muzzin et al. (2013). Also note that, even in the range affected by the cluster, the comoving number density of massive galaxies beyond 200 kpc from the cluster center is only a factor 4 times the density in the general field ( dex)..
We note that, by comparison with the spectroscopic sample, our selection of candidate cluster members is highly complete (all the 19 spectroscopic cluster members in the area probed by WFC3 grism data would be classified as likely candidate members based on their photo–zs). On the other hand, as a tradeoff for completeness, the sample of candidate members is significantly contaminated by interlopers.
As a rough estimate of such contamination, we find that by comparison with the spectroscopic sample about half of the sample of “likely” cluster members would be interlopers. We note that this fraction increases significantly, possibly to 80%, for “possible” members, for the obvious reason that, by selection, this sample is made of objects with a photo-z more distant from the cluster redshift, and in most cases poorly constrained. For such (typically faint) sources, not only it is difficult to obtain a reliable redshift estimate, but also to estimate photo-z accuracy and contamination. On the other hand, as we show in the following, the vast majority of these uncertain candidates is made of low-mass star-forming galaxies that do not enter our mass-complete samples, and have generally little weight in our conclusions. We finally note that spectroscopic interlopers classified as likely and possible members are generally close to the cluster redshift (% at and , for likely and possible members, respectively).
As a further check of the relevance of contamination, we model the redshift distribution in Figure 2 with a (Brainerd et al. 1996) for the field plus a Gaussian centered at z=2 for the cluster (dashed gray lines in the figure). The modeling is only done with the purpose of estimating the cluster and field contributions in the redshift range888We use =0.72, =0.17 for , and =1, =0.51 for , but note that given the very small area we probe, and the contamination from the cluster itself, these data are not ideal for modeling , and thus the parameters determined here should not be considered for general purposes., as relevant to membership determination.
For the sample (lower panel of Figure 2), the of the Gaussian is fixed to the scatter estimated for the photo-zs, and from the modeling we estimate that, in the range, about one third of this sample should be made of cluster galaxies. Therefore, statistically we should have in our catalog, in this redshift and magnitude ranges, about 40 cluster members: we have 14 spectroscopic members, and then 31 likely and 40 possible candidates. Assuming our estimated 50% contamination for likely members and 80% contamination for possible members, yields members in very close agreement with the statistical estimate.
For the sample, the photo-z scatter is smaller (), and furthermore many cluster members are spectroscopically confirmed, resulting in a tighter Gaussian in the upper panel of Figure 2, thus for the bright sample we use . For this sample, we estimate that about 50% (and at least %) of the galaxies should be cluster members, thus statistically (and at least 23) cluster members in this magnitude and redshift range in our catalog. Since we have 13 spectroscopic members and 12 candidates, this could suggest that, for the bright sample, our membership determination is less affected by contamination (as could be expected). Overall, this check confirms that our estimate of contamination for the whole sample is realistic, if anything somewhat too high for bright sources.
2.3.2 Final samples
In the end, we have a sample of 96 candidates, with 14 spectroscopic members, 31 “likely” and 51 “possible” candidates999Four more sources classified as possible members are embedded in the halos of bright objects and were excluded, because of their unclear nature and severely corrupted photometry. down to . Based on the considerations discussed above, we expect the whole sample of candidate members to include about 50 interlopers, for the most part (3/4) selected as possible members.
We stress that, because of the significant contamination of our candidate member sample by field galaxies at similar redshift, in most of this paper we will not be able to investigate the detailed comparison of galaxy properties in cluster and field environment at . On the other hand, in spite of the significant contamination or in some cases thanks to the extensive WFC3 spectroscopy, some properties of the cluster galaxy populations are clearly visible, even after dilution of their signal with field galaxies, as discussed below.
As discussed in section 2.2, for all analyses involving the characterisation of galaxy morphological structure, we limit our sample to objects brighter than . The sample is thus reduced to sources, out of which 13 and 12 galaxies are spectroscopic and candidates members, respectively.
The mass completeness limits corresponding to the magnitudes 25.7 and 24.5, estimated for an SSP formed at , with solar metallicity and no dust reddening, are M⊙ and M⊙, respectively (Salpeter IMF).
2.4. Passive and star-forming galaxies
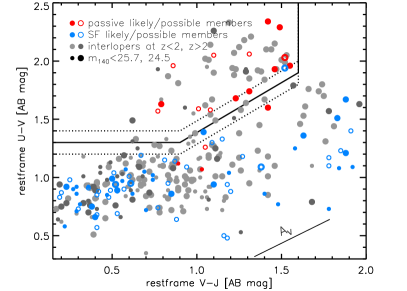
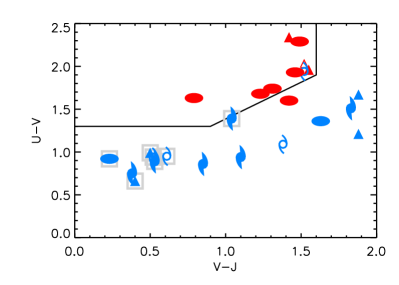
In order to broadly characterize the stellar population properties of individual sources, we split the sample in two classes of galaxies which are either essentially passively evolving, or still actively forming stars. We initially assign galaxies to one class or the other based on their restframe U-V and V-J colors (e.g., Wuyts et al. 2007, hereafter UVJ classification), as calculated based on its redshift and the appropriate observed SED (as selected in Sec. 2.1.2; spectroscopic redshifts are used where available). We use here the division between passive and active galaxies in the U-V vs V-J plane as adopted in Williams et al. (2009).
We then re-fit the observed SEDs of candidate members, at fixed redshift (photo-z or spectroscopic value), using combinations of templates from two different libraries. The first library includes only BC03 passive templates (age/4.5 and age 0.6 Gyr), with different metallicities, no dust attenuation, and a range of ages appropriate for the redshift range of the candidate members. This library is thus only appropriate for passive galaxies, in the relevant redshift range, with little dust attenuation. The second library includes only BC03 templates with constant SFH, attenuated by dust with E(B-V) up to 1.2, and with a range of ages appropriate for the redshift considered. This library may thus only describe actively star-forming (SF) populations with a broad range in dust attenuation, including highly reddened sources.
If we compare the of the best-fits for cluster members obtained with these two libraries and with the EAZY standard templates, we generally find that more than half of the galaxies UVJ-classified as star-forming are best-fitted with the EAZY library (lowest in 55% of cases), 40% are best-fitted by the constant SFH library, and only 4% have the lowest with the passive library. Instead, candidate members classified as UVJ-passive are essentially never best-fitted by constant SFH templates (with the exception of a source close to the dividing line), and in 90% of cases have (we note that the best-fit EAZY SED can also be essentially passive, with the greatest contribution coming from templates of evolved populations)101010When a spectroscopic redshift is not available, as discussed above we fix the redshift to the photometric value, which is a sensible choice given that a photometric redshift is incomparably better constrained with the general template library. Nonetheless, we note that for most (70%) of the passive sources, constant SFH templates give a poorer fit even if redshift is left as a free parameter.. In the great majority of cases, this alternative classification based on the comparison of SED fit with different libraries agrees with the UVJ selection. In very few cases the two classifications do not agree (see Figure 3): these are close to the dividing line of the UVJ plot, where it is thus particularly useful to also have a different approach, and/or faint sources whose SED is poorly constrained due to large photometric errors. In these few cases we adopt the SED-based classification.
Our sample of candidate members is thus ultimately divided in 18 passive (6 secure members plus 4 likely and 8 possible candidates) and 78 actively star-forming galaxies (8 secure members plus 27 likely and 43 possible candidates).
3. Galaxies associated with the Cl1449+0856 structure
As discussed above, our selection of candidate members should be highly complete but also significantly affected by contamination from interlopers. While it is impossible to remove this contamination based on photometric redshifts, we can at least statistically investigate some properties of the cluster galaxy populations which are strong enough not to be diluted by the significant presence of interlopers.
3.1. Projected distribution of candidate members
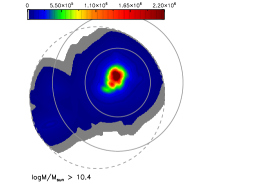
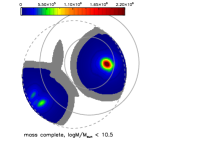
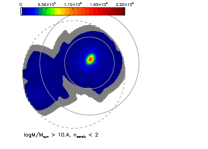
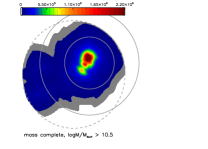
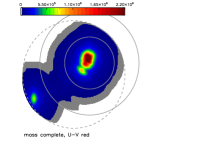
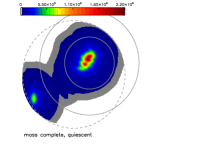
We show in Figures 4 and 5 the projected distribution of candidate cluster members in the field. Note that both figures show all candidate members – according to the specific selection as labeled in individual panels – and are thus affected by interloper contamination (as discussed in sections 2.3.1 and 2.3.2). While the more uncertain ”possible” members make up about half of the full candidate sample, their contribution is higher at low masses, and goes down to 30% and 25% for the logM/M9.9 and logM/M10.4 mass-complete samples highlighted in the figures. Accounting for spectroscopic members and the estimated contamination for “likely” and “possible” candidates, we estimate that these mass-complete samples are affected by an overall contamination of % and , for logM/M9.9 and logM/M10.4, respectively.
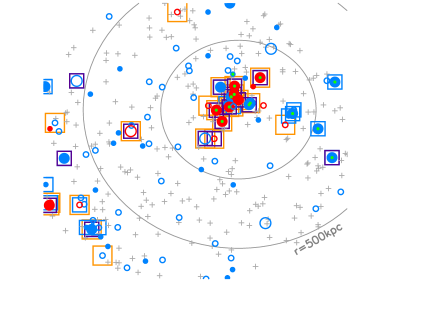
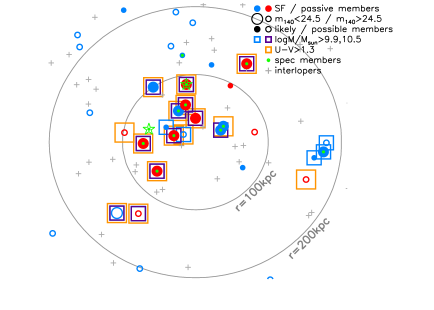
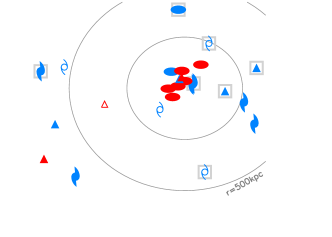
Figure 4 shows individually all galaxies in the field, highlighting ”possible” and ”likely” candidate members, as well as the nature of their stellar populations as estimated from their SED (section 2.4).
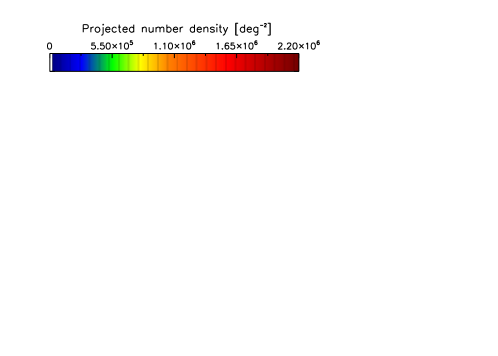
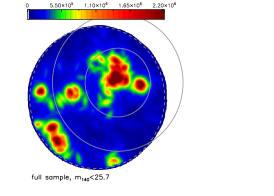
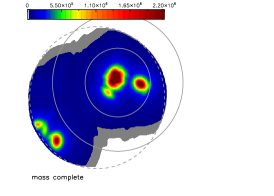
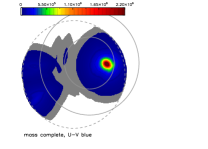
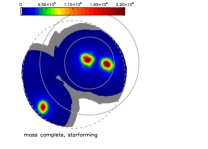
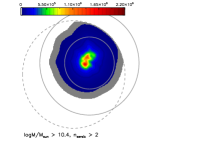
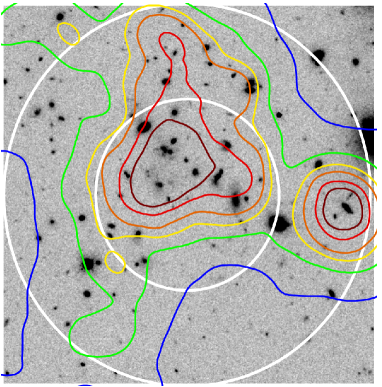
Figure 5 shows local density maps of the same sample of candidate cluster members (), as well as of the mass-complete sample (logM/M9.9), to picture more clearly their projected distribution, the density enhancement around the cluster center (taken as the center of the extended X-ray emission, as quoted in Gobat et al. 2011), and possible surrounding structures. As an estimator of local (projected) density, we used the density based on the distance to the 3rd nearest neighbour, . We correct for edge effects by accounting for uncovered area within the distance to the 3rd nearest neighbour, however minor edge effects may still persist. Contours from the density map of the full flux-limited sample of candidate members (top-left panel of Figure 5) are shown overlaid on the WFC3 F140W image in Figure 6. Figure 5 also shows local density maps of different sub-populations of the mass-complete sample, to highlight their different (projected) distribution.

Figures 4 and 5 clearly show the characteristic nature of the galaxies in the central concentration, including many massive, red, passive sources within 100-150 kpc of the cluster center. West of the cluster center, these figures show an overdensity of galaxies which seem distinct in nature, less massive, star-forming, and (whenever the measurement is possible) with a late-type structure (Figure 7). Half of these are spectroscopically confirmed to be cluster members.
Another overdensity in the projected distribution of candidate members is located south-east of the cluster center. However, as Figure 4 shows, it is made in large part of candidates less likely to be at the cluster redshift, and it contains no spectroscopically confirmed member. The reality of this structure could not be confirmed with the current spectroscopic coverage, partly due to observational issues (being located at the edge of the field fully covered by WFC3 grism spectroscopy with all 4 orientations, and being made in large part of faint sources).
Considering the mass-complete sample (blue and purple squares in Figure 4), and in spite of dilution due to interloper contamination, a concentration of massive, of optically red (restframe U-V1.3111111The restframe U-V1.3 threshold, as used here when referring to optically red sources, is close to the observed Y-K color cut used in Gobat et al. (2011).), and of passive galaxies in the cluster core is evident. This central concentration appears to include mostly passive sources, but also some dust-reddened star-forming galaxies. These results seem to be largely stable against the inclusion of interlopers. In fact, due to the selection criteria a large fraction of the less likely (”possible”) members is made of low-mass star-forming galaxies below the mass completeness limit (, vs for “likely” members). More specifically, the concentration of massive, red, and passive galaxies in the cluster core does not depend on the inclusion of less-likely members.
3.2. Structural and stellar population properties
Passive systems, as well as more massive galaxies (logM/M10.5), seem to be effectively segregated in the central cluster region, with two thirds of these galaxies within 200 kpc from the cluster centre.
At least in the mass range probed by our morphological analysis (logM/M10.4), this segregation is also evident for high-Sersic systems (), which are all within a clustercentric distance of 150 kpc, as shown in Figures 5 and 7.
This extends to a z=2 cluster previous results showing that, already before , the central regions of clusters and groups generally exhibit a segregation of more massive, older, or morphologically evolved galaxies (e.g., among others Rosati et al. 2009, Mei et al. 2012, Muzzin et al. 2012). In particular, the studies of Kurk et al. (2009), Tanaka et al. (2012, 2010b), Papovich et al. (2010, 2012) of two X-ray detected low-mass clusters at , suggest that at least some overdense structures, even with relatively low masses and already at , host in their core galaxy populations which are particularly evolved, in terms of their structure, stellar populations, and assembled stellar mass, as compared to lower density regions at the same epoch, and possibly in spite of the coexistence in the same volume of a population of galaxies which are instead still actively forming (e.g., Tran et al. 2010). Indeed, we recall results from several studies suggesting that, even at , some proto-cluster environments may already host galaxies more massive, with older stars, and more evolved structure, than their surroundings (e.g., Steidel et al. 2005, Kodama et al. 2007, Tanaka et al. 2010a, Hatch et al. 2011, Zirm et al. 2012, Spitler et al. 2012).
With respect to the comparison of structural and stellar population properties, we note the clear correlation in our sample of candidate members (at least in the probed mass range) between a high-Sersic profile and evolved host stellar populations (Figure 7), consistent with previous observations at similar redshifts in both field and high-density environments (e.g., Cimatti et al. 2008, Kurk et al. 2009, Wuyts et al. 2011, Cameron et al. 2011, Bell et al. 2012, Papovich et al. 2012, Tanaka et al. 2012, Patel et al. 2012a). As discussed also in more detail below, 70%121212Here and in the following, errors on the fraction are calculated following Cameron (2011). of candidate members more massive than the logM/M10.4 threshold for morphological analysis, and identified as passive, have n2. A similar early-type fraction is found in the passive population of our sample of interlopers at . Conversely, only 10% of star-forming candidate members more massive than the same limit are classified as morphological early-types. For comparison, Papovich et al. (2012) finds that about 80% of candidate members in the cluster XMM–LSS J02182-05102 at have n 2 (in a mass range similar to ours).
In turn, 75% of the logM/M10.4 candidate members with an early-type morphology also appear to be passive, with a similar fraction in our sample of interlopers at , although statistics are too poor to draw conclusions. For comparison, Bell et al. (2012) finds about 60% of early-type galaxies to be passive, at , down to a stellar mass limit of M⊙.
3.3. The environmental signature on galaxy populations
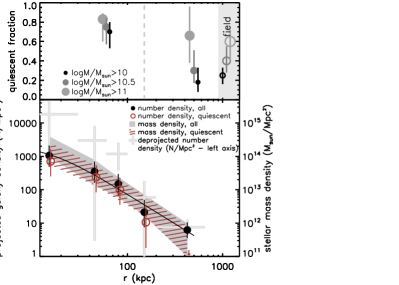
In Figure 8 we show the projected number density profile for the whole mass complete sample of candidate members more massive than 1010M⊙, as well as for passive galaxies in this sample, and the related stellar mass profiles. For the purpose of this figure, the cluster center is taken at the center of the galaxy overdensity, roughly located on a complex multi-component galaxy system, with asymmetric halos and tails clearly suggestive of an ongoing merging, that in Gobat et al. (2011) was identified as the possible proto-BCG still in a very active formation phase. This is offset by 50 kpc (in projection) from the estimated center of the X-ray emission. Note that this offset is similar to what observed in lower redshift clusters and groups, and is anyway comparable to the uncertainty on the X-ray centroid position (Fassbender et al. 2011a, George et al. 2012). All profiles shown take into account the contamination by interlopers by resampling multiple times the sample of candidate members, according to the contamination estimates discussed above. The errors shown on the number density profiles are the largest between the Poisson error on the counts and the scatter due to the resampling. For stellar mass profiles, an error of a factor two on stellar mass is included. At these masses the impact of less-likely (“possible”) members is marginal, and we verify that the inclusion or exclusion of these galaxies does not affect the profiles. The light gray crosses in Figure 8 show, as a simplistic illustration, the density profile obtained by deprojecting the observed profile (black points) assuming spherical symmetry, with a simple approach similar to McLaughlin (1999), and assuming no significant contribution to the overdensity beyond 650 kpc. Based on this estimate, the average volume number density of massive galaxies () within the region probed by this profile (650kpc from the cluster center) would be about times the density in the field at (from wide field measurements, e.g. Muzzin et al. 2013, , see also section 2.3.1), reaching central densities 4-5 orders of magnitude larger than in the field within 100 kpc from the cluster center. We stress that this is only a simplistic approximation for illustration purposes, and of course we have no proof - and likely no expectations - that this cluster is spherically simmetric.
The purpose of Figure 8 is to quantitatively show the increased galaxy density of candidate members in the cluster central region. A proper investigation of the shape of the galaxy number density profile is beyond the scope of this work, but we show as a reference the best-fitting projected -model131313A generalization of core profiles which is often used to describe cluster galaxy number density profiles (e.g., Girardi et al. 1998, Lemze et al. 2009). (, Cavaliere & Fusco-Femiano 1978, with the central projected density, the core radius, and the outer slope) to the number density profile (black points) as a black line. The profile suggests that, if there is a core, it is very small (core radius kpc), as also observed in low-redshift clusters (e.g., Biviano & Girardi 2003). The best-fit is close to typical values observed in the nearby Universe (e.g., Popesso et al. 2004). Given the small offset between the X-ray centroid and the center of the overdensity, we note that this figure would be essentially the same if considering the X-ray centroid as the cluster center, the only relevant effect being the increase of the core size to kpc.
The upper panel of Figure 8 shows the fraction of candidate members which are classified as passive in two radial bins (within and beyond a clustercentric distance of 150 kpc), for three mass-limited samples (logM/M10, 10.5, and 11). In spite of the relatively poor statistics and of the contamination by field galaxies, this Figure clearly shows that a larger fraction of galaxies has already suppressed star formation in the cluster center, corresponding to the high-density region shown by the profile in the bottom panel. The effect is seen in all the mass-limited samples shown, with the possible exception of the most massive systems (1011M⊙). Statistics are too poor to draw any conclusion, but the lack of a clear environmental effect for the most massive galaxies would hint at a predominant role of mass-related factors (so-called “mass quenching”, e.g., Baldry et al. 2006, Peng et al. 2010b), rather than local density, in quenching galaxies at the highest masses, at this epoch and for this kind of environment (but see e.g., Muzzin et al. 2012, for clusters at ). In the outer bin (between 150 and kpc) the passive fraction is consistent with the field value (estimated from these same data using galaxies classified as interlopers at and keeping into account the resampling of candidate members). However, we remind the reader that where the overdensity of cluster galaxies drops, dilution from contamination dramatically affects the possibility to recover the properties of cluster galaxies, which thus appear similar to those of the field sample. Statistically correcting for the contamination by interlopers, as it is done here, is expected to give lower passive fractions (if field galaxies have a higher star-forming fraction), especially in the outer regions were field contamination is more significant. Finally, we note that the passive fraction that we measure in the field is consistent with previous determinations at redshift two, for instance we find a passive fraction of % at masses logM/M, close – given the uncertainties – to the estimates of e.g., Daddi et al. (2005a), Brammer et al. (2011), Patel et al. (2012b).
Compared to clusters, we find as expected higher star-forming fractions, but we recall the caveat just discussed above which might bias high our estimates. For instance, in the range 10.25logM/M, Muzzin et al. (2012) finds about 20% of cluster galaxies with still active star formation within 200 kpc from the cluster core, while we estimate about 50%. However, at high stellar masses (logM/M10.95) 70% of galaxies within 200 kpc appear to be already passive, a result which is not likely to be produced by field contamination, and is already similar to the low () star-forming fractions estimated by Muzzin et al. in their sample.
3.4. The high-mass tail
At , very massive galaxies are a characteristic population of cluster cores, which generally exhibits the most evolved morphological structures and stellar populations. However, studies of clusters often show significant activity (from both the star formation and mass assembly points of view) even at the high-mass tail of cluster galaxy populations, as discussed in the introduction.
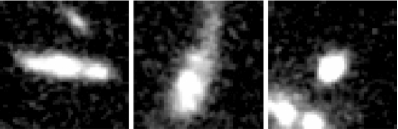
Based on the results of SED fitting, in our sample there are nine candidate members with stellar masses exceeding 1011M⊙, six of which are spectroscopic members. These objects are mostly concentrated close to the cluster center, with 5 of them within a clustercentric distance 100 kpc. Only two are classified as actively star-forming based on our criteria: one candidate at kpc, and one component of the proto-BCG system that from recent analysis seems indeed to be associated with the cluster (Gobat et al. 2013). According to our criteria, its SED is classified as star-forming. While the photometry of this source is likely significantly affected by the presence of multiple components and neighbors, a detection in the Herschel PACS imaging indeed suggests a SFR of order 100M⊙/yr (Gobat et al. 2013). All the other seven 1011M⊙ candidate members are classified as passive, four of them with an early-type morphology, although one is embedded in a large asymmetric halo with features suggestive of a recent interaction. The remaining three galaxies classified as passive are i) a likely member of disky morphology, ii) a possible member with distorted shape showing a large tail, and iii) a galaxy very close (1.5”) to the star-forming component of the proto-BCG mentioned above, identified in Gobat et al. (2011) as a proto-BCG component itself, and for which we were not able to obtain a reliable Sersic fit, likely due to its complicated surroundings. The F140W images of these three galaxies are shown in Figure 9.
In spite of the mentioned caveats, these observations would thus picture the high-mass end galaxy population in this cluster as a mix of passive galaxies with already established early-type morphologies, and of galaxies which are instead still actively forming their stars, assembling their mass, or reshaping their structure, in some cases clearly through interactions. We note that, with the exception of the proto-BCG complex, the central region within 150 kpc from the cluster center hosts the most evolved of these very massive galaxies, while those star-forming or with disk or irregular morphologies typically lie outside of the cluster core, at kpc.
As already mentioned in section 3, the most massive galaxies in the core of this cluster already show a very high passive fraction (83% for the fully spectroscopically confirmed sample of M1011M⊙ members within 150 kpc from the cluster center), close to the estimate by Raichoor & Andreon (2012) for very massive galaxies close to the central area of JKCS 041, assumed to be at roughly similar redshift.
As also found in other studies at this redshift, the fraction of very massive galaxies which have already attained an early-type morphology is significantly lower than at lower redshift. Both in our cluster and field samples, 4015% of galaxies more massive than M⊙ are classified as morphological early-types (or 20% for M⊙, in agreement with Buitrago et al. 2011). On the other hand, the fraction of early-types could be larger for M⊙ passive galaxies (6015%, larger than the 3515% estimated by van der Wel et al. (2011), but still consistent given the significant errors).
3.5. An estimate of the cluster mass from its host galaxies
As reported in Gobat et al. (2011), the total mass of Cl J1449+0856 as inferred from its X-ray luminosity would be 1013Msun. Gobat et al. (2011) also attempted an independent estimate of the cluster mass based on the stellar mass contained in the red galaxies in the very central (20”, 170 kpc) overdensity. We attempt here a refinement of this estimate based on the sample of candidate members within a clustercentric radius of 500 kpc. We stress that this only gives a very rough indication of the cluster mass, since besides the biases related to the selection of candidate members, which are extensively discussed above, there are many additional important uncertainties including our ignorance of the cluster virial radius, and of the redshift evolution up to of the relation between cluster total mass and stellar mass in galaxies.
Given the cluster redshift as well as the previous mass estimates, it is reasonable to assume that the cluster virial radius is likely not much larger than kpc, and thus that a kpc area accounts for most of the mass in galaxies in this system (as would be also suggested by Figure 8). We estimate the stellar mass in galaxies within this area141414We correct for a small fraction of uncovered area beyond 300 kpc, see e.g., Figure 5., keeping into account contamination by interlopers as discussed above, and extrapolating down to stellar masses of M⊙ assuming that the shape of the mass function is similar to what measured at by Ilbert et al. (2010). The stellar mass calculated in this way is 21012M⊙. Based on this, we then estimate the cluster mass using its relation (in the nearby Universe) with stellar mass in galaxies as determined by Andreon (2012). Since as discussed above we do not know the or 151515As for the usual definition, and are the radii within which the mean density of the cluster is 500 and 200 times, respectively, the critical density of the Universe at the cluster redshift. of this cluster, we apply both local calibrations based on stellar mass within and , in the reasonable assumption that the 500 kpc radius we use must be between or close to one of them. The two estimates, M⊙, are consistent given the uncertainty of at least 50%. This would correspond to a stellar mass fraction within the kpc area of 4-5%, also in agreement with other measurements up to (Giodini et al. 2009, Leauthaud et al. 2012, for the same IMF). On the other hand, while there is currently no evidence for a significant evolution of the stellar mass fraction in clusters up tp , there might well be a stronger evolution between and 2. The actual amount of such evolution is difficult to quantify, and we note just for reference that the Bower et al. (2006) semi-analytic model would predict a slightly lower stellar mass fraction for group/cluster-sized haloes at (Balogh et al. 2008), which would thus mildly increase, by 30%, our estimate for the cluster mass.
In any case, our revised estimate of the cluster mass based on stellar mass in galaxies is close to previous determinations. We stress nonetheless once more that, given the significant assumptions and uncertainties involved, this remains only a crude guess.
4. Passive early-type galaxies
According to the criteria described above, down to the completeness mass limit of M⊙ we identify 8 passive “likely” members and 4 passive “possible” members. As discussed above and shown in Figure 4, these candidate members – and in particular those most likely associated with the cluster – tend to be located in the cluster core, at a clustercentric radius of 150 kpc. As expected, the fraction of candidate members classified as passive strongly depends on stellar mass. At masses below logM/M passive galaxies seem very rare: we have only two in our mass-complete sample, making up % of the logM/M population of cluster candidates. Statistics are poor, and the exact number could be affected by contamination and photo-z uncertainties, but there seems to be a paucity of passive candidate members at low stellar masses in our sample (see also e.g., among others, Kodama et al. 2004, De Lucia et al. 2007, Ilbert et al. 2010, Rudnick et al. 2012, at lower to similar redshifts, and in different environments). The passive fraction increases at higher masses, getting to % at logM/M, and up to the 80% for logM/M as quoted in section 3.4.
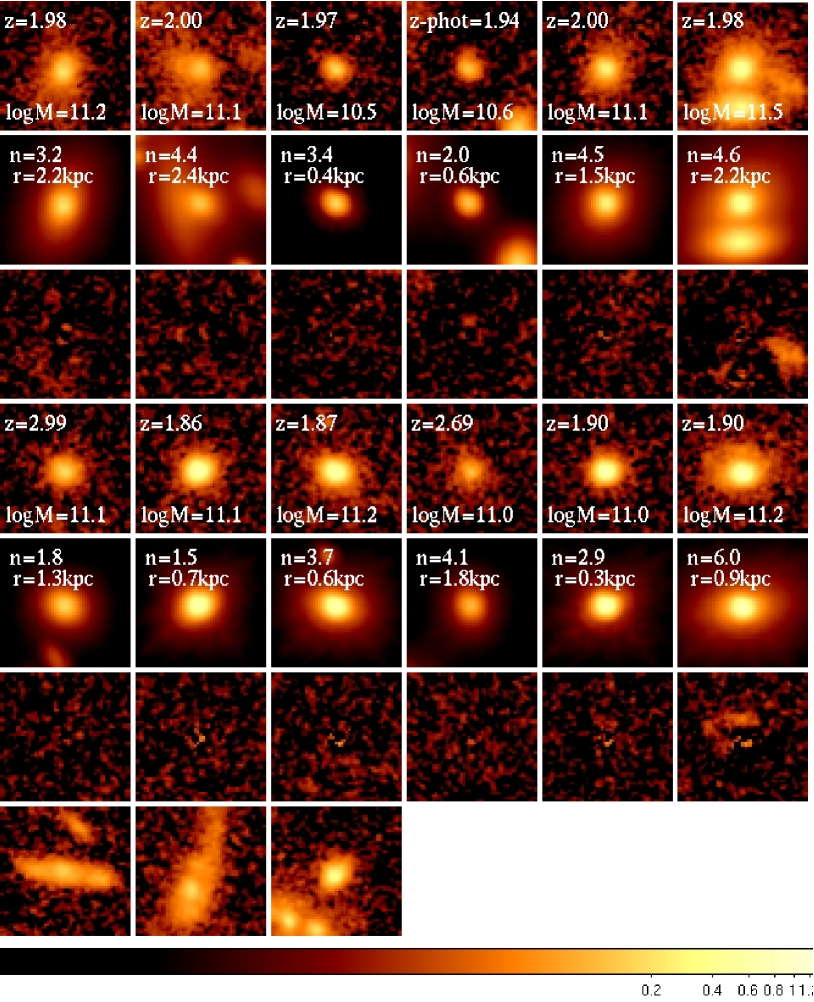
Down to our limit for morphological analysis (, MM⊙), our passive sample contains 8 “likely” and one “possible” candidate members. While the surface brightness distribution of most of these 9 sources may be described with a Sersic profile and is overall suggestive of an early-type structure, this sample also includes the three massive (M⊙) passive systems with disk, distorted or undetermined morphology, that were discussed in section 3.4 (Figure 9). These three galaxies are excluded from the following analysis. Cutouts of the six remaining bona-fide passive cluster early-types (five spectroscopic and one likely member) are shown in Figure 10, together with their Sersic models and residual maps161616These include the early-type galaxy surrounded by a large asymmetric halo already mentioned in section 3.4 – this source will be highlighted below were relevant..
Analogously, in the redshift range close to the cluster (, corresponding to Gyr around z=2) we identify 6 (all spectroscopic) interlopers classified as passive and with a likely early-type morphology171717We note that, although four of these interlopers have a similar redshift , the projected separation between any two of them is at least 200 kpc, and three out of four lie at more than 300 kpc from the cluster center.. The passive nature inferred from their photometry is also confirmed by their spectra. Cutouts of the 6 passive interlopers are shown in Figure 11, together with their Sersic models and residual maps. We include in this sample two sources with 1.5n, which is below the n threshold adopted in this work181818There are no passive candidate members with a 1.5n., and one high-nSersic source which shows signatures of interaction191919This source is shown in the right-hand panels of Figure 11, and appears in Figure 12 with a logM/M⊙=11.2 and an effective radius of 0.95 kpc. If fitting the faint component north of the source, its Sersic index and size are reduced by 30-40%. As Figure 12 shows, adopting the lower size estimate, or excluding this source (as well as the two n systems) from the sample, would not change our conclusions..
We note that this sample of interlopers might be biased, since due to our membership criteria sources in this redshift range are likely to be classified as candidate members unless they are bright enough, and possibly compact enough given our grism data, that their redshift can be measured discarding their association with the cluster. This sample of field passive galaxies might thus be, in principle, not completely representative of the logM/M population of passive galaxies at this redshift. On the other hand, we also note that at the mass of these interlopers (M⊙) all the passive cluster early-types are spectroscopically confirmed, so at least at these masses there is no uncertainty due to membership determination and we can make a meaningful, homogeneous comparison between cluster and field passive early-type galaxies in our field.

4.1. The mass-size relation of passive cluster early-types
In Figure 12 we show the ellipticity and circularised effective radius vs stellar mass for the passive candidate members with , or in fact for all but one of the plotted sources. The six passive spectroscopic interlopers at are also shown, including those with as spiral symbols.
While the average ellipticity of the cluster early-types tends to be somewhat lower than for those in the field, statistics are too poor to draw any significant conclusion concerning environmental dependence as well as redshift evolution. With this important caveat, we just note that the median ellipticity of the cluster early-types seems very similar to what is observed at low redshift (e.g., Holden et al. 2009) in a similar mass range.
All galaxies in Figure 12 appear to be more compact than similarly massive early-types in the nearby Universe, in agreement with many previous studies at high redshift in clusters and field (e.g., among many others, Daddi et al. (2005b), Trujillo et al. (2006a), Zirm et al. (2007), Cimatti et al. (2008), van der Wel et al. (2008), Rettura et al. (2010), Williams et al. (2010), Cassata et al. (2011), Cameron et al. (2011), but see also e.g. Saracco et al. (2009), Onodera et al. (2010), Mancini et al. (2010)).
For comparison, we show in Figure 12 the most commonly used local reference relation (Shen et al. 2003), and the determination by Valentinuzzi et al. (2010) for nearby cluster early-types. While the Shen et al. (2003) relation has been shown to be affected by some errors and biases (e.g., Guo et al. 2009, Taylor et al. 2010, Valentinuzzi et al. 2010), due to its widespread use in previous work we use it as the z=0 reference to compute size evolution factors, for ease of comparison with other results. We remind the reader that, while our morphological analisys is carried out in the restframe optical (4700), the Shen et al. (2003) sizes are still measured at longer wavelength (z band), which might raise issues of morphological k-correction, although up to now this does not seem to be a serious concern for the kind of sources studied here (Cassata et al. 2010, Damjanov et al. 2011, Cameron et al. 2011).
While keeping in mind the small size of our sample, from Figure 12 interlopers seem to have a larger spread in size, and to be systematically more compact than candidate members of similar mass202020We note that this is not due to the large bin – in fact, the four very compact galaxies are very close to the cluster redshift at , while the two at have sizes closer to the cluster members.. As compared to the Shen et al. (2003) relation, cluster early-types have sizes smaller on average by a factor (rms range 0.2-0.7), while field early-types have an average (rms range 0.1-0.5). This would support (at least at masses M⊙) recent claims on the typically larger sizes of early-types in high-redshift dense environments (Cooper et al. 2012, Papovich et al. 2012, Zirm et al. 2012, Tanaka et al. 2012).
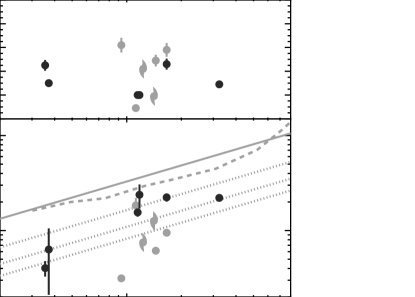
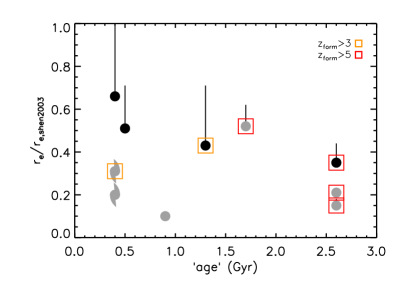
Although still debated, a correlation has been claimed by several studies across a broad redshift range, between the size of passive early-types and the age of their stellar populations, with older galaxies having smaller sizes, (e.g., Bernardi et al. (2010), Valentinuzzi et al. (2010), Saracco et al. (2011) and references therein, but see also results in e.g., Cimatti et al. (2012), Onodera et al. (2012), Whitaker et al. (2012)). In this respect, we note that the difference in size between cluster and field early-types in Figure 12 does not seem to reflect a difference in age. We show in Figure 13 the size evolution factor for the 1011M☉ sources with respect to the Shen et al. (2003) relation, vs. the “age”, defined as the time when half of the stellar mass at the epoch of observations was formed (based on the star formation history of the best-fitting model SED). At M1011M☉, the cluster and field samples are comparable in stellar mass, sizes are relatively well constrained, and both samples are fully spectroscopically confirmed. Our poor statistics and very rough age estimates do not allow us to draw any conclusion on the age vs size relation of early-types in this work, but we cannot see any evidence of segregation in this figure between cluster and field galaxies, besides the larges sizes of cluster early-types, already shown in Figure 12.
Assuming a size evolution of the form (1+z)α, would be 0.750.15 for cluster early-types, and 1.40.2 for the field. This amount of size evolution for field early-types at this redshift would be in close agreement with previous estimates (e.g., van Dokkum et al. 2008, Buitrago et al. 2008, van der Wel et al. 2008, Cassata et al. 2011, Damjanov et al. 2011, Cimatti et al. 2012, Patel et al. 2012b), although other studies have found somewhat milder evolution (e.g., Cimatti et al. 2008, Papovich et al. 2012, but see discussion below). We note that such comparison may be biased by the many systematics affecting the measurement of the mass-size relation, especially at different redshifts and on different data sets. Nonetheless, taken at face value, our estimate of the size evolution factor for early-types is consistent with the expectations from previous measurements.
Interpreting the difference in average size of field and cluster early-types as evidence that structural evolution is accelerated in the cluster environment, would suggest that cluster early-types reach - on average - the observed (at ) size about 3 Gyr earlier than early-types in the field, assuming a smooth evolution of the form given above in the field, down to at least . Note that, while some work presented evidence for a smooth size evolution in the range (Damjanov et al. 2011), other studies suggest that evolution could be faster before (Cimatti et al. 2012). With this important caveat, we note for comparison that a difference in stellar populations has sometimes been interpreted as a delay in the formation of the bulk of the stars in field relative to cluster early-types ranging from to 2 Gyr (e.g., Thomas et al. 2005, Bernardi et al. 2005, Clemens et al. 2006, van Dokkum & van der Marel 2007, Rogers et al. 2010, all in the nearby Universe). However, several other studies, including work at higher redshifts, generally concluded that if there is a delay it is small ( Gyr), and often ascribed the slightly different stellar populations to a more complex difference of star formation histories in different environments rather than a delay in the bulk of the star formation (e.g., Moran et al. 2005, Gobat et al. 2008, Thomas et al. 2010, Rettura et al. 2011, and references therein).
In any case, Figure 12 excludes the presence of extremely compact passive early-types in the cluster, at least in the mass range and area probed here. We recall however that this sample does not include the passive component of the proto-BCG, for which we do not have a reliable estimate of morphological parameters, as well as the red, compact AGN host that we discarded from the spectroscopic member sample due to severe uncertainties in the determination of its properties, as discussed in section 2.3. In principle, either or both might be examples of very compact early-types in the cluster core. Besides this caveat, cluster passive early-types seem to have sizes typically a factor 2-3 smaller than similarly massive early-types in the nearby Universe. With the possible exception of the massive source with asymmetric halo which, as mentioned above, may suggest a post-interaction stage, there are essentially no passive early-types within 1 of the local relation. This might be linked to the still incomplete evolution of a massive, core galaxy population at this epoch, at least in this cluster.
On the other hand, the evolution of the mass-size relation does not necessarily imply an evolution in size of individual galaxies, and its interpretation is complicated by several biases and selection effects, as discussed in many studies including e.g., Franx et al. (2008), Bernardi et al. (2010), Hopkins et al. (2010), Williams et al. (2010), Saracco et al. (2009, 2010, 2011), Poggianti et al. (2012). In particular, the mismatch between samples of early-types at different redshifts is often considered as a significant contribution to the observed evolution of the mass size relation, as recently summarized by e.g., Carollo et al. (2013) and Cassata et al. (2013) with representative early-type samples up to and 3. In fact, as observed in the general field and, albeit with some differences, in all environments, continuous quenching of star forming galaxies through cosmic times significantly increases the number density of passive galaxies – by about an order of magnitude in the field between and today, in the mass range of our passive sample (e.g. Ilbert et al. 2013, Muzzin et al. 2013). If galaxies quenched more recently have typically larger sizes (as for the age-size correlation discussed above), the observed mass-size relation evolves even if individual early-types in the high-redshift samples do not. Indeed, Valentinuzzi et al. (2010) showed how early-types with sizes below the Shen et al. (2003) relation by a factor 2-3 can be found also in nearby clusters, even at high stellar masses (M⊙). Such compact galaxies tend to have older stellar populations than average-sized ones, and thus made it into the early-type samples at earlier times, shifting the average mass-size relation at higher redshifts to lower sizes. Attempts to model the effect of such kind of progenitor bias on the mass-size relation evolution (van der Wel et al. 2009, Valentinuzzi et al. 2010) suggested that, by comparing early-type samples at redshift 2 and 0, the observed z=2 mass-size relation could be shifted to lower sizes by a factor even without any size evolution of the individual z=2 galaxies. On the other hand, we recall that the analysis of size evolution in age-controlled samples by Cimatti et al. (2012), albeit affected by some caveats212121Besides the intrinsic difficulties in estimating galaxy ages, Cimatti et al. (2012) used a compilation of literature data, thus age measurements were not uniform across their sample - see original paper for details., might suggest that the effect of this bias could instead be relatively mild. Although such amount of progenitor bias would be, in any case, insufficient to fully explain our observed size evolution, it still complicates the quantification of the relevance of size evolution for individual galaxies, especially when coupled to other biases and systematics on the determination of sizes (e.g., Pannella et al. 2009, Mancini et al. 2010) and stellar masses (IMF, stellar population models, etc.). In this respect, we note that stellar masses estimated with the M05 models for the sample of early-types in Figure 12 are lower by, on average, about a factor 2, thus decreasing the average evolution factor ( rather than with BC03 masses, see also Figure 13).
5. Summary
We have studied galaxy populations in the field of the z=2 galaxy cluster Cl J1449+0856, using samples of (candidate) members selected through spectroscopic and photometric redshifts. Our mass completeness limit is about 1010M⊙ (or 2.51010M⊙ where morphological analysis is involved) at the cluster redshift, thus probing the massive population of cluster galaxies.
We summarise below our main results:
In spite of the residual contamination from field galaxies, which is expected to be relevant especially at low masses, the cluster clearly stands out as an overdensity both in the redshift distribution and in the projected distribution of galaxies in the sky, close to the center of the extended X-ray emission. In the central kpc region, the projected number density of cluster galaxies more massive than M⊙ is estimated to exceed 100 galaxies/Mpc2, for a stellar mass density exceeding 1013M☉/Mpc2.
The highest density cluster core is already traced by a population of massive, quiescent, early-type galaxies. On the other hand, massive star forming galaxies, often significantly dust reddened, also populate the cluster core, as observed in other clusters. It thus appears that the core of Cl J1449+0856 might be in a transitional phase, where a population of already massive and passive early-types coexists with galaxies still actively forming their stars, and in some cases reshaping their structure through interactions or merging.
Besides the central overdensity which hosts the most massive and evolved galaxy populations, a secondary galaxy concentration at 250 kpc seems to host galaxies of clearly distinct nature, with lower masses, on-going star formation, and late-type morphologies.
Environmental signatures on galaxy populations are evident within 200 kpc from the cluster center, where the great majority of morphological early-types and of passive galaxies are concentratred, resulting in a clear increase of the passive fraction of massive galaxies. However, at the highest masses (M☉) the passive fraction is closer to (and consistent with, given our uncertainties) the field level, which might suggest a predominant role of mass over environment quenching for most massive galaxies at this redshift and in this kind of environment.
A first analysis of the spatial distribution of galaxies around the cluster center would suggest a profile shape overall similar to what observed in nearby clusters, consistent with a small-core model with .
From the estimated stellar mass in galaxies, and using the relation between stellar mass and total mass of groups and clusters in the nearby Universe, we obtain an indicative estimate for the cluster mass of about M☉, consistent with the mass inferred from the X-ray emission.
We observe a clear correlation between an early-type morphology and passive stellar populations, as also observed in lower density environments at similar redshift.
Massive passive early-types in this cluster are smaller on average by a factor 2-3 with respect to the Shen et al. (2003) determination of the stellar mass vs. size relation. However, they appear typically larger by about a factor 2 than similarly massive field galaxies at the same epoch. While statistics are still very limited, this would lend support to recent claims of accelerated structural evolution in high-redshift overdense environments.
This study pictures Cl 1449+0856 as a still-forming cluster which retains some expected characteristics of low-mass systems at early times, including massive galaxies still actively forming close to its center, and likely infalling substructures accreting onto the central regions lower mass, less evolved galaxies. On the other hand it shows how, at the same time, early formed massive galaxies, quite evolved both in their structure and in their stellar content, are a major component of galaxy populations in cluster cores already 10 billion years ago.
References
- Andreon (2008) Andreon, S. 2008, MNRAS, 386, 1045
- Andreon (2012) Andreon, S. 2012, A&A, 548, A83
- Baldry et al. (2006) Baldry, I. K., Balogh, M. L., Bower, R. G., et al. 2006, MNRAS, 373, 469
- Balogh et al. (2008) Balogh, M. L., McCarthy, I. G., Bower, R. G., & Eke, V. R. 2008, MNRAS, 385, 1003
- Bell et al. (2012) Bell, E. F., van der Wel, A., Papovich, C., et al. 2012, ApJ, 753, 167
- Bernardi et al. (2010) Bernardi, M., Shankar, F., Hyde, J. B., et al. 2010, MNRAS, 436
- Bernardi et al. (2005) Bernardi, M., Sheth, R. K., Nichol, R. C., Schneider, D. P., & Brinkmann, J. 2005, AJ, 129, 61
- Bertin & Arnouts (1996) Bertin, E. & Arnouts, S. 1996, A&AS, 117, 393
- Biviano & Girardi (2003) Biviano, A. & Girardi, M. 2003, ApJ, 585, 205
- Bower et al. (2006) Bower, R. G., Benson, A. J., Malbon, R., et al. 2006, MNRAS, 370, 645
- Brainerd et al. (1996) Brainerd, T. G., Blandford, R. D., & Smail, I. 1996, ApJ, 466, 623
- Brammer et al. (2008) Brammer, G. B., van Dokkum, P. G., & Coppi, P. 2008, ApJ, 686, 1503
- Brammer et al. (2011) Brammer, G. B., Whitaker, K. E., van Dokkum, P. G., et al. 2011, ApJ, 739, 24
- Bruzual & Charlot (2003) Bruzual, G. & Charlot, S. 2003, MNRAS, 344, 1000
- Buitrago et al. (2008) Buitrago, F., Trujillo, I., Conselice, C. J., et al. 2008, ApJ, 687, L61
- Buitrago et al. (2011) Buitrago, F., Trujillo, I., Conselice, C. J., & Haeussler, B. 2011, ArXiv e-prints
- Calzetti et al. (2000) Calzetti, D., Armus, L., Bohlin, R. C., et al. 2000, ApJ, 533, 682
- Cameron (2011) Cameron, E. 2011, PASA, 28, 128
- Cameron et al. (2011) Cameron, E., Carollo, C. M., Oesch, P. A., et al. 2011, ApJ, 743, 146
- Capak et al. (2007) Capak, P., Aussel, H., Ajiki, M., et al. 2007, ApJS, 172, 99
- Carollo et al. (2013) Carollo, C. M., Bschorr, T. J., Renzini, A., et al. 2013, ArXiv e-prints
- Cassata et al. (2010) Cassata, P., Giavalisco, M., Guo, Y., et al. 2010, ApJ, 714, L79
- Cassata et al. (2011) Cassata, P., Giavalisco, M., Guo, Y., et al. 2011, ApJ, 743, 96
- Cassata et al. (2013) Cassata, P., Giavalisco, M., Williams, C. C., et al. 2013, ArXiv e-prints
- Cavaliere & Fusco-Femiano (1978) Cavaliere, A. & Fusco-Femiano, R. 1978, A&A, 70, 677
- Cimatti et al. (2008) Cimatti, A., Cassata, P., Pozzetti, L., et al. 2008, A&A, 482, 21
- Cimatti et al. (2012) Cimatti, A., Nipoti, C., & Cassata, P. 2012, MNRAS, 422, L62
- Clemens et al. (2006) Clemens, M. S., Bressan, A., Nikolic, B., et al. 2006, MNRAS, 370, 702
- Cooper et al. (2012) Cooper, M. C., Griffith, R. L., Newman, J. A., et al. 2012, MNRAS, 419, 3018
- Daddi et al. (2004) Daddi, E., Cimatti, A., Renzini, A., et al. 2004, ApJ, 617, 746
- Daddi et al. (2005a) Daddi, E., Dickinson, M., Chary, R., et al. 2005a, ApJ, 631, L13
- Daddi et al. (2005b) Daddi, E., Renzini, A., Pirzkal, N., et al. 2005b, ApJ, 626, 680
- Damjanov et al. (2011) Damjanov, I., Abraham, R. G., Glazebrook, K., et al. 2011, ApJ, 739, L44
- De Lucia et al. (2007) De Lucia, G., Poggianti, B. M., Aragón-Salamanca, A., et al. 2007, MNRAS, 374, 809
- De Lucia et al. (2006) De Lucia, G., Springel, V., White, S. D. M., Croton, D., & Kauffmann, G. 2006, MNRAS, 366, 499
- De Propris et al. (2007) De Propris, R., Stanford, S. A., Eisenhardt, P. R., Holden, B. P., & Rosati, P. 2007, AJ, 133, 2209
- Dressler (1980) Dressler, A. 1980, ApJ, 236, 351
- Eisenhardt et al. (2008) Eisenhardt, P. R. M., Brodwin, M., Gonzalez, A. H., et al. 2008, ApJ, 684, 905
- Fassbender et al. (2011a) Fassbender, R., Böhringer, H., Nastasi, A., et al. 2011a, New Journal of Physics, 13, 125014
- Fassbender et al. (2011b) Fassbender, R., Nastasi, A., Böhringer, H., et al. 2011b, A&A, 527, L10
- Franx et al. (2008) Franx, M., van Dokkum, P. G., Schreiber, N. M. F., et al. 2008, ApJ, 688, 770
- George et al. (2012) George, M. R., Leauthaud, A., Bundy, K., et al. 2012, ApJ, 757, 2
- Giodini et al. (2009) Giodini, S., Pierini, D., Finoguenov, A., et al. 2009, ApJ, 703, 982
- Girardi et al. (1998) Girardi, M., Giuricin, G., Mardirossian, F., Mezzetti, M., & Boschin, W. 1998, ApJ, 505, 74
- Gobat et al. (2011) Gobat, R., Daddi, E., Onodera, M., et al. 2011, A&A, 526, A133
- Gobat et al. (2008) Gobat, R., Rosati, P., Strazzullo, V., et al. 2008, A&A, 488, 853
- Guo et al. (2009) Guo, Y., McIntosh, D. H., Mo, H. J., et al. 2009, MNRAS, 398, 1129
- Hatch et al. (2011) Hatch, N. A., Kurk, J. D., Pentericci, L., et al. 2011, MNRAS, 415, 2993
- Hayashi et al. (2011) Hayashi, M., Kodama, T., Koyama, Y., Tadaki, K.-I., & Tanaka, I. 2011, MNRAS, 415, 2670
- Hayashi et al. (2010) Hayashi, M., Kodama, T., Koyama, Y., et al. 2010, MNRAS, 402, 1980
- Hilton et al. (2010) Hilton, M., Lloyd-Davies, E., Stanford, S. A., et al. 2010, ApJ, 718, 133
- Hoaglin et al. (1983) Hoaglin, D. C., Mosteller, F., & Tukey, J. W. 1983, Understanding robust and exploratory data anlysis (Wiley Series in Probability and Mathematical Statistics, New York: Wiley, 1983, edited by Hoaglin, David C.; Mosteller, Frederick; Tukey, John W.)
- Holden et al. (2009) Holden, B. P., Franx, M., Illingworth, G. D., et al. 2009, ApJ, 693, 617
- Hopkins et al. (2010) Hopkins, P. F., Bundy, K., Hernquist, L., Wuyts, S., & Cox, T. J. 2010, MNRAS, 401, 1099
- Ilbert et al. (2009) Ilbert, O., Capak, P., Salvato, M., et al. 2009, ApJ, 690, 1236
- Ilbert et al. (2013) Ilbert, O., McCracken, H. J., Le Fevre, O., et al. 2013, ArXiv e-prints
- Ilbert et al. (2010) Ilbert, O., Salvato, M., Le Floc’h, E., et al. 2010, ApJ, 709, 644
- Johansson et al. (2012) Johansson, P. H., Naab, T., & Ostriker, J. P. 2012, ApJ, 754, 115
- Kodama et al. (2007) Kodama, T., Tanaka, I., Kajisawa, M., et al. 2007, MNRAS, 377, 1717
- Kodama et al. (2004) Kodama, T., Yamada, T., Akiyama, M., et al. 2004, MNRAS, 350, 1005
- Kriek et al. (2009) Kriek, M., van Dokkum, P. G., Labbé, I., et al. 2009, ApJ, 700, 221
- Kurk et al. (2009) Kurk, J., Cimatti, A., Zamorani, G., et al. 2009, A&A, 504, 331
- Leauthaud et al. (2012) Leauthaud, A., George, M. R., Behroozi, P. S., et al. 2012, ApJ, 746, 95
- Lemze et al. (2009) Lemze, D., Broadhurst, T., Rephaeli, Y., Barkana, R., & Umetsu, K. 2009, ApJ, 701, 1336
- Lidman et al. (2008) Lidman, C., Rosati, P., Tanaka, M., et al. 2008, A&A, 489, 981
- Mancini et al. (2010) Mancini, C., Daddi, E., Renzini, A., et al. 2010, MNRAS, 401, 933
- Mancone et al. (2010) Mancone, C. L., Gonzalez, A. H., Brodwin, M., et al. 2010, ApJ, 720, 284
- Maraston (2005) Maraston, C. 2005, MNRAS, 362, 799
- Maraston et al. (2010) Maraston, C., Pforr, J., Renzini, A., et al. 2010, MNRAS, 407, 830
- McLaughlin (1999) McLaughlin, D. E. 1999, AJ, 117, 2398
- Mei et al. (2009) Mei, S., Holden, B. P., Blakeslee, J. P., et al. 2009, ApJ, 690, 42
- Mei et al. (2012) Mei, S., Stanford, S. A., Holden, B. P., et al. 2012, ApJ, 754, 141
- Moran et al. (2005) Moran, S. M., Ellis, R. S., Treu, T., et al. 2005, ApJ, 634, 977
- Muzzin et al. (2013) Muzzin, A., Marchesini, D., Stefanon, M., et al. 2013, ArXiv e-prints
- Muzzin et al. (2012) Muzzin, A., Wilson, G., Yee, H. K. C., et al. 2012, ApJ, 746, 188
- Onodera et al. (2010) Onodera, M., Daddi, E., Gobat, R., et al. 2010, ApJ, 715, L6
- Onodera et al. (2012) Onodera, M., Renzini, A., Carollo, M., et al. 2012, ApJ, 755, 26
- Pannella et al. (2009) Pannella, M., Gabasch, A., Goranova, Y., et al. 2009, ApJ, 701, 787
- Papovich (2008) Papovich, C. 2008, ApJ, 676, 206
- Papovich et al. (2012) Papovich, C., Bassett, R., Lotz, J. M., et al. 2012, ApJ, 750, 93
- Papovich et al. (2011) Papovich, C., Finkelstein, S. L., Ferguson, H. C., Lotz, J. M., & Giavalisco, M. 2011, MNRAS, 412, 1123
- Papovich et al. (2010) Papovich, C., Momcheva, I., Willmer, C. N. A., et al. 2010, ApJ, 716, 1503
- Patel et al. (2012a) Patel, S. G., Holden, B. P., Kelson, D. D., et al. 2012a, ApJ, 748, L27
- Patel et al. (2009) Patel, S. G., Kelson, D. D., Holden, B. P., et al. 2009, ApJ, 694, 1349
- Patel et al. (2012b) Patel, S. G., van Dokkum, P. G., Franx, M., et al. 2012b, ArXiv e-prints
- Peng et al. (2002) Peng, C. Y., Ho, L. C., Impey, C. D., & Rix, H.-W. 2002, AJ, 124, 266
- Peng et al. (2010a) Peng, C. Y., Ho, L. C., Impey, C. D., & Rix, H.-W. 2010a, AJ, 139, 2097
- Peng et al. (2010b) Peng, Y.-j., Lilly, S. J., Kovač, K., et al. 2010b, ApJ, 721, 193
- Poggianti et al. (2012) Poggianti, B., Calvi, R., Bindoni, D., et al. 2012, ArXiv e-prints
- Popesso et al. (2004) Popesso, P., Böhringer, H., Brinkmann, J., Voges, W., & York, D. G. 2004, A&A, 423, 449
- Postman et al. (2005) Postman, M., Franx, M., Cross, N. J. G., et al. 2005, ApJ, 623, 721
- Raichoor & Andreon (2012) Raichoor, A. & Andreon, S. 2012, A&A, 537, A88
- Rettura et al. (2011) Rettura, A., Mei, S., Stanford, S. A., et al. 2011, ApJ, 732, 94
- Rettura et al. (2010) Rettura, A., Rosati, P., Nonino, M., et al. 2010, ApJ, 709, 512
- Rogers et al. (2010) Rogers, B., Ferreras, I., Pasquali, A., et al. 2010, MNRAS, 405, 329
- Rosati et al. (2009) Rosati, P., Tozzi, P., Gobat, R., et al. 2009, A&A, 508, 583
- Rudnick et al. (2012) Rudnick, G. H., Tran, K.-V., Papovich, C., Momcheva, I., & Willmer, C. 2012, ApJ, 755, 14
- Salpeter (1955) Salpeter, E. E. 1955, ApJ, 121, 161
- Santos et al. (2011) Santos, J. S., Fassbender, R., Nastasi, A., et al. 2011, A&A, 531, L15
- Saracco et al. (2009) Saracco, P., Longhetti, M., & Andreon, S. 2009, MNRAS, 392, 718
- Saracco et al. (2010) Saracco, P., Longhetti, M., & Gargiulo, A. 2010, MNRAS, L115+
- Saracco et al. (2011) Saracco, P., Longhetti, M., & Gargiulo, A. 2011, MNRAS, 412, 2707
- Sargent et al. (2007) Sargent, M. T., Carollo, C. M., Lilly, S. J., et al. 2007, ApJS, 172, 434
- Shen et al. (2003) Shen, S., Mo, H. J., White, S. D. M., et al. 2003, MNRAS, 343, 978
- Spitler et al. (2012) Spitler, L. R., Labbé, I., Glazebrook, K., et al. 2012, ApJ, 748, L21
- Steidel et al. (2005) Steidel, C. C., Adelberger, K. L., Shapley, A. E., et al. 2005, ApJ, 626, 44
- Strazzullo et al. (2010) Strazzullo, V., Rosati, P., Pannella, M., et al. 2010, A&A, 524, A17
- Tanaka et al. (2010a) Tanaka, M., De Breuck, C., Venemans, B., & Kurk, J. 2010a, A&A, 518, A18
- Tanaka et al. (2012) Tanaka, M., Finoguenov, A., Mirkazemi, M., et al. 2012, ArXiv e-prints
- Tanaka et al. (2010b) Tanaka, M., Finoguenov, A., & Ueda, Y. 2010b, ApJ, 716, L152
- Taylor et al. (2010) Taylor, E. N., Franx, M., Glazebrook, K., et al. 2010, ApJ, 720, 723
- Thomas et al. (2005) Thomas, D., Maraston, C., Bender, R., & de Oliveira, C. M. 2005, ApJ, 621, 673
- Thomas et al. (2010) Thomas, D., Maraston, C., Schawinski, K., Sarzi, M., & Silk, J. 2010, MNRAS, 404, 1775
- Tran et al. (2010) Tran, K., Papovich, C., Saintonge, A., et al. 2010, ApJ, 719, L126
- Trujillo et al. (2006a) Trujillo, I., Feulner, G., Goranova, Y., et al. 2006a, MNRAS, 373, L36
- Trujillo et al. (2006b) Trujillo, I., Förster Schreiber, N. M., Rudnick, G., et al. 2006b, ApJ, 650, 18
- Valentinuzzi et al. (2010) Valentinuzzi, T., Fritz, J., Poggianti, B. M., et al. 2010, ApJ, 712, 226
- van der Wel et al. (2009) van der Wel, A., Bell, E. F., van den Bosch, F. C., Gallazzi, A., & Rix, H. 2009, ApJ, 698, 1232
- van der Wel et al. (2007) van der Wel, A., Holden, B. P., Franx, M., et al. 2007, ApJ, 670, 206
- van der Wel et al. (2008) van der Wel, A., Holden, B. P., Zirm, A. W., et al. 2008, ApJ, 688, 48
- van der Wel et al. (2011) van der Wel, A., Rix, H.-W., Wuyts, S., et al. 2011, ApJ, 730, 38
- van Dokkum et al. (2008) van Dokkum, P. G., Franx, M., Kriek, M., et al. 2008, ApJ, 677, L5
- van Dokkum & van der Marel (2007) van Dokkum, P. G. & van der Marel, R. P. 2007, ApJ, 655, 30
- Wetzel et al. (2012) Wetzel, A. R., Tinker, J. L., & Conroy, C. 2012, MNRAS, 424, 232
- Whitaker et al. (2012) Whitaker, K. E., Kriek, M., van Dokkum, P. G., et al. 2012, ApJ, 745, 179
- Whitaker et al. (2011) Whitaker, K. E., Labbé, I., van Dokkum, P. G., et al. 2011, ApJ, 735, 86
- Williams et al. (2009) Williams, R. J., Quadri, R. F., Franx, M., van Dokkum, P., & Labbé, I. 2009, ApJ, 691, 1879
- Williams et al. (2010) Williams, R. J., Quadri, R. F., Franx, M., et al. 2010, ApJ, 713, 738
- Wuyts et al. (2011) Wuyts, S., Förster Schreiber, N. M., van der Wel, A., et al. 2011, ApJ, 742, 96
- Wuyts et al. (2007) Wuyts, S., Labbé, I., Franx, M., et al. 2007, ApJ, 655, 51
- Zirm et al. (2012) Zirm, A. W., Toft, S., & Tanaka, M. 2012, ApJ, 744, 181
- Zirm et al. (2007) Zirm, A. W., van der Wel, A., Franx, M., et al. 2007, ApJ, 656, 66