Swift Observations of the High-mass X-ray Binary IGR J16283–4838 unveil a 288-day Orbital Period
Abstract
We report on the temporal and spectral properties of the HMXB IGR J16283–4838 in the hard X-ray band. We searched the first 88 months of Swift BAT survey data for long-term periodic modulations. We also investigated the broad band (0.2–150 keV) spectral properties of IGR J16283–4838 complementing the BAT dataset with the soft X-ray data from the available Swift-XRT pointed observations. The BAT light curve of IGR J16283–4838 revealed a periodic modulation at P days (with a significance higher than 4 standard deviations). The profile of the light curve folded at Po shows a sharp peak lasting d, over a flat plateau. The long-term light curve shows also a d interval of prolonged enhanced emission. The observed phenomenology is suggestive of a Be nature of IGR J16283–4838, where the narrow periodic peaks and the d outburst can be interpreted as Type I and Type II outbursts, respectively. The broad band 0.2–150 keV spectrum can be described with an absorbed power-law and a steepening in the BAT energy range.
Subject headings:
X-rays: general — X-rays: binaries — X-rays: individuals (IGR J16283-4838)1. Introduction
High-mass X-ray binaries (HMXB) consist of a magnetized neutron star or a black hole, and a massive OB star. Three different sub-classes are distinguished, depending on the mechanism that transfers matter from the massive star onto the compact object: (i) through Roche lobe overflow via the formation of an accretion disc around the compact object, (ii) capturing the high velocity stellar wind of an early type star or (iii) capturing material from the extended envelope of the equatorial circumstellar disk of a main sequence Be star. The majority of the HMXBs observed up to now are in systems with a Be star as a companion: the low velocities and the high densities present in the Be envelope provide a dense environment that favour accretion (Bondi & Hoyle, 1944; Negueruela et al., 2007). Be/X-ray binaries are often observed as transient systems and display two types of X-ray outbursts. Type I outbursts are periodic and occur close to the periastron passage of the neutron star in an eccentric orbit, when the accretion is enhanced due to the mass capture from the equatorial disk of the Be star. Type II outbursts, usually much brighter than Type Is, are not related to the orbital phase. They are caused by sudden disk instabilities that produce a prolonged accretion of a huge fraction of the Be star disk, and can be sustained for many orbital periods.
The Burst Alert Telescope (BAT, Barthelmy et al., 2005) on board the Swift observatory (Gehrels et al., 2004) has been scanning the sky since December 2004. After 88 months the survey has achieved a sensitivity down to some units of in the 15–150 keV band and, thanks to the large field of view (1.4 steradians, half coded) and to the Swift pointing strategy that maximizes the observing duty cycle of the spacecraft instruments, BAT covers a large fraction of the sky per day (50%–80%), recording timing and spectral information for any detected source.
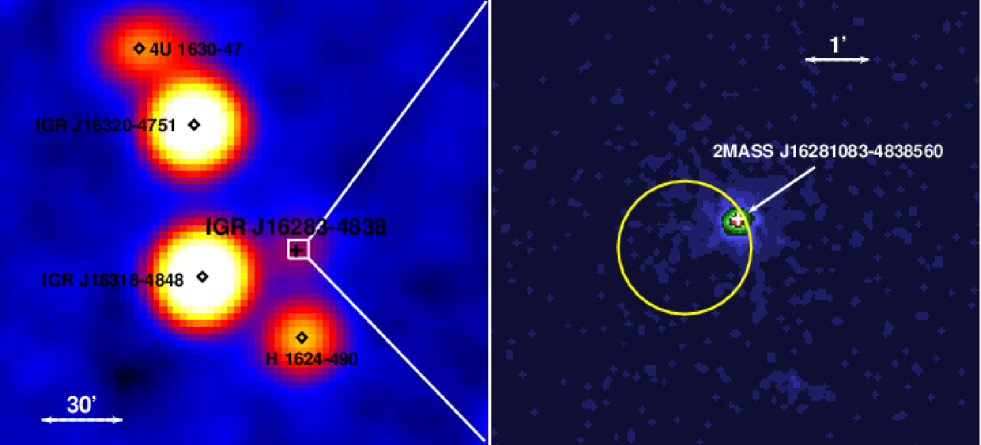
We analyze the soft and hard X-ray data collected by Swift on IGR J16283–4838. This source was discovered by INTEGRAL as a hard X-ray transient during a core program observation of the Norma Arm (Soldi et al., 2005). A Swift-XRT observation constrained better its position, setting it at RA= 16h 28m 10.7s, Dec=–48deg 38’ 55” (J2000), with a 5” radius uncertainty (Kennea et al., 2005). The source was observed to be variable, with its flux rising by a factor of 2 on a time-scale of a few days (Paizis et al., 2005; Markwardt et al., 2005). The X-ray spectrum of the source showed a strong and variable intrinsic absorption (). The continuum could be adequately modeled by either a power law with or with a black body with a temperature kT=2.0 keV (Beckmann et al., 2005). Rodriguez & Paizis (2005) indicated the near-infrared (NIR) source 2MASS J16281083–4838560 (RA = 16h 28m 10.83s, Dec =–48deg 38’ 56.1”, J2000, 1.7” from the XRT position, with magnitudes K, J 16.8, and H 15.8) as the possible counterpart of IGR J16283–4838. The Galactic Legacy Infrared Midplane Survey Extraordinaire (GLIMPSE, Benjamin et al., 2003) data show a source positionally consistent with the 2MASS source. However, a K band image acquired at the 6.5m Magellan-Baade telescope revealed that 2MASS J16281083–4838560 is indeed a blend of point sources, where the brightest resolved one has a K band magnitude of (Steeghs et al., 2005). No UV or optical source was found within the XRT error box either in Swift-UVOT images, nor in the Digitized Sky Survey (Beckmann et al., 2005). Pellizza et al. (2011), using optical and NIR images, spectra and polarimetry, suggest that the brightest object of the 2MASS J16281083–4838560 blend is the counterpart to IGR J16283–4838. The source shows NIR spectral features of late-O or early-B supergiant stars, strengthening the hypothesis that IGR J16283–4838 is a highly absorbed HMXB.
2. Observations and data reduction
The BAT survey raw data of the first 88 months of the Swift mission were processed with dedicated software (Segreto et al., 2010) that computes all-sky maps in several energy bands between 15 and 150 keV, performs source detection on these maps, and, for each detected source, produces light curves and spectra. IGR J16283–4838 was detected with highest significance in the 15–45 keV all-sky map with a signal to noise ratio of 21 standard deviations. Fig.1 shows the BAT image of the sky region around IGR J16283–4838. The source was inside the BAT field of view for a total of 30.5 Ms. The BAT timing analysis is performed on the 15–45 keV light curve extracted with the maximum available time resolution ( s). The spectrum was analyzed using the official BAT spectral redistribution matrix 111http://heasarc.gsfc.nasa.gov/docs/heasarc/caldb/data/swift/bat/index.html.
The Swift-XRT (Burrows et al., 2004) observed IGR J16283–4838 on 2005 April 13 (Obs ID 00067133001) and April 15 (Obs ID 00067133002). The source was observed both in Photon Counting (PC) mode and in Windowed Timing (WT) mode (Hill et al., 2004) in each observation. The details on the two observations are reported in Table 1. The XRT data were processed with standard procedures (xrtpipeline v 0.12.4) using ftools in the heasoft package (v 6.8) and the products were extracted with grade filtering of 0-12 and 0-2 for PC and WT data, respectively. The source events for data collected in PC mode were extracted from a circular region of 20 pixel radius (1 pixel = 2.36”) centered on the source position as determined with xrtcentroid; the background for spectral analysis was extracted from an annular region centered on the source, with an inner radius of 70 pixels and an outer radius of 130 pixels. Source events in WT mode were extracted from a 20 pixel wide portion of the WT strip centered on the source position; the background was selected from a region sufficiently far ( arcmin) to avoid the contamination due to the PSF tail of IGR J16283–4838. All source event arrival times were converted to the Solar System barycenter with the task barycorr222http://http://heasarc.gsfc.nasa.gov/ftools/caldb/help/barycorr.html. XRT ancillary response files were generated with xrtmkarf333http://heasarc.gsfc.nasa.gov/ftools/caldb/help/xrtmkarf.html. Spectra relevant to the same observing mode were summed to obtain a single source spectrum and a single background spectrum. The ancillary files were combined using addarf weighting them by the exposure times of the relevant source spectra. Each spectrum was re-binned with a minimum of 20 counts per energy channel, in order to allow the use of the statistics. We used the spectral redistribution matrix v013 and the spectral analysis was performed using xspec v.12.5. Uncertainties are stated at 90 % confidence level for a single parameter, if not stated otherwise.
| Obs # | Obs ID | PC Exposure | WT Exposure | PC Rate | WT Rate | Orb. Phase | ||
|---|---|---|---|---|---|---|---|---|
| (s) | (s) | (s) | (c/s) | (c/s) | ||||
| 1 | 00067133001 | 53473.58 | 2422 | 647 | 812 | 0.984 | ||
| 2 | 00067133002 | 53475.01 | 81644 | 5116 | 1139.9 | 0.979 |

3. Timing analysis and results
We produced the periodogram from the long term Swift-BAT 15–45 keV light curve by applying a folding technique (Leahy et al., 1983) and searching in the 0.5–500 d period range with a period spacing given by PT (P is the trial period, is the number of phase bins used to build the profile and T Ms is the data span length). The average rate in each profile phase bin was evaluated by weighting each rate with the inverse square of its statistical error. This procedure is appropriate as the data are characterized by a large span of statistical errors, being background dominated, and collected, for each source, over a wide range of off-axis directions. The periodogram (Fig. 2a) shows the presence of several prominent features. The highest one is at P d (), where the centroid and the error are taken to be the location of the peak and the standard deviation obtained from a Gaussian fit to the feature at Po. Other less significant features are clearly visible in the periodogram and they correspond to a series of sub-multiples of Po.
Figure 2b shows the intensity profile folded at Po (T MJD) using 50 phase bins. The profile is characterized by a prominent narrow peak and several lower peaks. The main peak centroid and its width have been evaluated with a Gaussian fit, obtaining a centroid phase at (that corresponds to MJD Po) and a standard deviation of ( days).
The profile shape explains the presence of the large number of Po sub-multiples in the periodogram: folding the light curve with a period equal to P, the peak is added coherently to the profile every two cycles, producing a sub-harmonic in the periodogram. The sharper and shorter the profile peak is, the more sub-multiples will appear in the periodogram. We verified this expectation by simulating a 88-month BAT light curve with a squared periodic (287.6 days) peak lasting 12 days superimposed over a white noise signal with an average intensity a factor of ten lower than the peak intensity. The periodogram obtained by the simulated light curve satisfactorily reproduced the periodogram obtained from the real data.
Figure 2c shows the 88-month BAT light curve with a time bin length of P days. The vertical shaded bars mark the times corresponding to the main peak phase: the periodic enhancement of the hard X-ray intensity is clearly visible. The source shows also a prolonged time interval of high intensity starting at the beginning of 2007 and lasting days. We have verified that this is the cause for the presence of the lower peaks in the folded profile: if we repeat the folding excluding this time interval (MJD 54080 to 54420) the resulting folded profile shows the main peak over a flat plateau consistent with zero intensity (inset in Figure 2b).
The significance of the feature at Po cannot be evaluated using statistics because the long term variability of IGR J162834838 causes the distribution in the periodogram to strongly deviate in terms of both average and fluctuation amplitude from what is expected for white noise (average ). The significance of Po is therefore evaluated as follows:
-
1.
We fitted the periodogram with a second order polynomial and derived the average trend of the versus P and the spread of the values around the best fitting parabola.
-
2.
We built a set of n1=10000 fake light curves, produced by splitting the IGR J16283–4838 data into portions of n2=900 bins and performing a random swap of the corresponding rate blocks; this was repeated n3=3 times for each fake curve, using a different starting point for the sectioning. The values of n2 and n3 were chosen after testing over several combinations of values which one reproduced better the distribution of the observed periodogram both in average trend and in scatter.
-
3.
The folding analysis was performed for each fake light curve to obtain a periodogram covering the 0.5–500 day period range. The highest value in the entire period range in the set of 10000 periodograms was 794. The probability that a random fluctuation would produce a value as high as 930 in one particular periodogram is therefore lower than and corresponds to a significance higher than standard deviations.
We performed a timing analysis on the XRT data in order to search for the presence of a periodic modulation. The arrival times of the events in PC mode were randomized within the XRT-PC time resolution bin (=2.5073 s) to avoid systematics caused by the read-out time. Moreover, XRT observations are fragmented into snapshots of different duration and time separation. This causes the presence of spurious features in the timing analysis that could affect the detection of true periodic signals. To avoid these systematics we performed a folding analysis on each snapshot with an exposure time higher than 500 s, searching in a period range [ : 100] s and [1 : 100] s, for PC and WT mode, respectively. The periodograms obtained from snapshots belonging to the same observation and observing mode were summed together. We did not find any significant feature in the resulting periodograms.
4. Spectral Analysis
Before performing a broad-band spectral analysis of non-simultaneous data we verified that no significant spectral variability is present in either of the two XRT observations or during the BAT monitoring. The two XRT spectra were each fit with an absorbed power-law spectral model. The results for the two spectra were consistent with a single set of parameters. To check if spectral variability is present during the BAT monitoring we produced three BAT spectra. Spectrum 1 was made from data obtained during the 2007 outburst (Figure 2c). Spectra 2 and 3 were constructed excluding data taken during the outburst. Spectrum 2 was built using data taken during phases 0.0-0.06 in Figure 2b, i.e., phases corresponding to the peak, while Spectrum 3 was built from data taken in the off-peak phase range 0.06-1.0. Spectra 1 and 2 were independently fit with a power law; the best fit photon indices are mutually consistent within the uncertainties. In Spectrum 3 the source is not detected, with an upper limit on the count rate of counts s-1 detector-1.
These intermediate results support the assumption of no significant spectral evolution in either soft or hard X-rays. The broad band spectral analysis was then performed on Spectrum 1 together with the XRT spectra (hereafter XB1). The trial models for the XRT spectra were multiplied by constants (XRT-PC, CPC; XRT-WT, CWT) to account for different flux levels and for inter-calibration uncertainties. A similar broad band analysis was performed on Spectrum 2 together with the XRT spectra (hereafter XB2).
The best fit of the absorbed power law model (cons*phabs*powerlaw) to XB1 yielded a of 214 for 75 degrees of freedom (d.o.f.). Therefore XB1 is not well-described by this model. We obtained a marginally acceptable fit for XB2(, 75 d.o.f.). We have then modeled the two spectra with a power-law modified by a cutoff (cons*phabs*cutoffpl), obtaining in both cases a good fit of the data ( of 89.5 with 74 d.o.f for XB1 and of 85.2 with 74 d.o.f for XB2), with consistent spectral parameters (reported in Table 2). Assuming a similar spectral shape for Spectrum 3 and using the same spectral parameters obtained for XB2 we obtain a upper limit on the 0.2–150 keV flux of .
Figure 3 shows the data, best fit model (cons*phabs*cutoffpl) and residuals for XB1 (left panel), and for XB2 (right panel).


| Parameter | Powerlaw | Cutoff powerlaw | Units |
| XRT + BAT Outburst Spectrum (XB1) | |||
| N | |||
| keV | |||
| @1 keV | |||
| 89.5 (74 dof) | |||
| XRT + BAT Peak Spectrum (XB2) | |||
| N | |||
| keV | |||
| @1 keV | |||
| 110.5 (75 dof) | 85.2 (74 dof) | ||
5. Discussion and conclusions
The analysis of the BAT survey data of the HMXB IGR J16283–4838 unveiled a modulation of its hard X-ray emission corresponding to a period of P days. This modulation, whose significance is higher than 4 standard deviations, is clearly visible in the BAT light curve (Fig. 2c) and can be interpreted as the orbital period of the binary system. Such long orbital periods are typical of Be/X-ray binaries (e.g Corbet, 1986). Moreover, we found that the source has undergone a long period of strong activity between December 2006 and November 2007, indicating enhanced accretion for more than one entire orbit. The BAT light curve outside the prolonged outburst, folded at Po is characterized by a a narrow peak over a flat plateau whose intensity is consistent with zero (inset in Figure 2b). The peak duration is days. Thus a large fraction of the emission of this source is concentrated in a short fraction of its orbit. This behavior is often observed in X-ray binaries with a Be star as a companion, and it is explained as the consequence of the enhancement of accretion when the neutron star is at or near the periastron of a highly eccentric orbit. These are the Type I outbursts. The day long outburst can be interpreted as a Type II outburst, a further signature of the Be nature of the system. The broad band 0.2–150 keV spectral analysis shows that the spectra selected during the outburst and during the periodic peaks can be both modeled with an absorbed powerlaw modified by a high energy cutoff, with consistent best fit parameters. Assuming a distance of 13.6–21.6 kpc (Pellizza et al., 2011) and isotropic emission, the 0.2–150 keV luminosities are and , respectively. During the plateau phase the source is not detected, with a upper limit on the 0.2–150 keV luminosity of .
Pellizza et al. (2011) identified the NIR counterpart of IGR J16283–4838 as the brightest object of the blend of three sources catalogued as 2MASS J16281083–4838560 and classified it as a late-O or early-B supergiant. Under this assumption, and assuming a typical mass and a typical radius (Lang, 1992) for a B0 star, we can infer the length of the orbital semi-major axis through the third Kepler’s law:
| (1) |
where we assumed the compact object to be a neutron star with . Such a wide orbital separation is not common in systems with a supergiant companion star and wind-driven accretion. Assuming the above referenced values of radius and mass for the companion star, the expected accretion rate would be (Frank et al., 2002):
| (2) |
Even considering an extreme wind loss rate () of M☉ year-1 and an accretion efficiency of 10%, the expected luminosity would correspond to 1035 erg s-1, that is an order of magnitude lower than the observed values. It is therefore quite unlikely that the system harbors a O supergiant with a wind-fed NS.
An alternative possibility is that the counterpart of IGR J16283–4838 is one of the other two sources that compose 2MASS J16281083–4838560. Both of them are fainter than the one chosen by Pellizza et al. (2011) as the counterpart, but closer to the position of the soft X-ray counterpart observed with XRT. Unfortunately, we have no information on the spectral type of either of these two objects.
We have performed timing analysis on the XRT data, searching for periodicities in the range 1–100 s, finding no evidence for periodic modulations. If the system were a Be/X-ray binary, the Corbet correlation between spin period and orbital period (Corbet, 1986) would suggest a spin period around s, that is beyond the range of periodicities that can be revealed with the available XRT data. Indeed, such long periodicities are not easily revealed in XRT observations that, because of the low satellite orbit, are split into many snapshots (one per orbit, where each orbit lasts s) lasting only a fraction of the orbit itself (between and s for this source). The timing analysis suffers from such fragmentation as it induces strong systematics that can hide the presence of long spin periods.
References
- Barthelmy et al. (2005) Barthelmy, S. D., et al. 2005, Space Science Reviews, 120, 143
- Beckmann et al. (2005) Beckmann, V., Kennea, J. A., Markwardt, C., et al. 2005, ApJ, 631, 506
- Benjamin et al. (2003) Benjamin, R. A., Churchwell, E., Babler, B. L., et al. 2003, PASP, 115, 953
- Bondi & Hoyle (1944) Bondi, H., & Hoyle, F. 1944, MNRAS, 104, 273
- Burrows et al. (2004) Burrows, D. N., Hill, J. E., Nousek, J. A., et al. 2004, Proc. SPIE, 5165, 201
- Corbet (1986) Corbet, R. H. D., 1986, MNRAS, 220, 1047
- Dickey & Lockman (1990) Dickey, J. M., & Lockman, F. J. 1990, ARA&A, 28, 215
- Frank et al. (2002) Frank, J., King, A., & Raine, D. J. 2002, Accretion Power in Astrophysics, by Juhan Frank and Andrew King and Derek Raine, pp. 398. ISBN 0521620538. Cambridge, UK: Cambridge University Press, February 2002.,
- Gehrels et al. (2004) Gehrels, N., et al. 2004, ApJ, 611, 1005
- Hill et al. (2004) Hill, J. E., Burrows, D. N., Nousek, J. A., et al. 2004, Proc. SPIE, 5165, 217
- Kalberla et al. (2005) Kalberla, P. M. W., Burton, W. B., Hartmann, D., et al. 2005, A&A, 440, 775
- Kennea et al. (2005) Kennea J. A., Burrows D. N., Nousek J. A., Chester M., Roming P., Barthelmy S., Gehrels N., Beckmann V., Soldi S., 2005, ATEL 459
- Lang (1992) Lang, K. R. 1992, Astrophysical Data I. Planets and Stars, X, 937 pp. 33 figs.. Springer-Verlag Berlin Heidelberg New York
- Leahy et al. (1983) Leahy, D. A., Darbro, W., Elsner, R. F., et al. 1983, ApJ, 266, 160
- Markwardt et al. (2005) Markwardt C. B., Swank J. H., Smith E., 2005, ATEL 465
- Negueruela et al. (2007) Negueruela, I., Smith, D. M., Torrejón, J. M., & Reig, P. 2007, ESA Special Publication, 622, 255
- Paizis et al. (2005) Paizis A., Miller J. M., Soldi S., Mowlavi N., 2005, ATEL 458
- Pellizza et al. (2011) Pellizza, L. J., Chaty, S., & Chisari, N. E. 2011, A&A, 526, A15
- Rodriguez & Paizis (2005) Rodriguez, J. & Paizis A., 2005, ATEL 460
- Segreto et al. (2010) Segreto, A., Cusumano, G., Ferrigno, C., La Parola, V., Mangano, V., Mineo, T., & Romano, P. 2010, A&A, 510, A47
- Soldi et al. (2005) Soldi, S., Brandt S., Domingo Garau A., Grebenev S. A., Kuulkers E. , Palumbo G. G.C., Tarana A., 2005, ATEL 456
- Steeghs et al. (2005) Steeghs D., Torres M. A.P., Jonker P. G., Miller J., Green P., Rakowski C., 2005, ATEL 478