Searching for Cooling Signatures in Strong Lensing Galaxy Clusters: Evidence Against Baryons Shaping the Matter Distribution in Cluster Cores
Abstract
The process by which the mass density profile of certain galaxy clusters becomes centrally concentrated enough to produce high strong lensing (SL) cross-sections is not well understood. It has been suggested that the baryonic condensation of the intra-cluster medium (ICM) due to cooling may drag dark matter to the cores and thus steepen the profile. In this work, we search for evidence of ongoing ICM cooling in the first large, well-defined sample of strong lensing selected galaxy clusters in the range . Based on known correlations between the ICM cooling rate and both optical emission line luminosity and star formation, we measure, for a sample of 89 strong lensing clusters, the fraction of clusters that have [OII]3727 emission in their brightest cluster galaxy (BCG). We find that the fraction of line-emitting BCGs is constant as a function of redshift for and shows no statistically significant deviation from the total cluster population. Specific star formation rates, as traced by the strength of the 4000Å break, D4000, are also consistent with the general cluster population. Finally, we use optical imaging of the SL clusters to measure the angular separation, Rarc, between the arc and the center of mass of each lensing cluster in our sample and test for evidence of changing [OII] emission and D4000 as a function of Rarc, a proxy observable for SL cross-sections. D4000 is constant with all values of Rarc, and the [OII] emission fractions show no dependence on Rarc for R and only very marginal evidence of increased weak [OII] emission for systems with R. These results argue against the ability of baryonic cooling associated with cool core activity in the cores of galaxy clusters to strongly modify the underlying dark matter potential, leading to an increase in strong lensing cross-sections.
Subject headings:
cooling flows - galaxies: clusters: strong lensing - techniques: spectroscopic1. Introduction
Galaxy clusters that exhibit strong lensing in their cores are some of the rarest objects in the Universe and the global strong lensing cross-section for galaxy cluster-scale structures is dominated by a small fraction of the total galaxy cluster population. In strong lensing (SL) galaxy clusters, theory and simulations predict that certain astrophysical factors play a role in increasing SL cross-sections. -body simulations predict that dark matter concentrations in strong lensing clusters should be significantly larger than most other clusters (Hennawi et al., 2007; Meneghetti et al., 2010) and that triaxiality and clumpiness in the cores could be significant in producing SL clusters (Hennawi et al., 2007). While many strong lensing clusters have high mass, Dalal et al. (2004) showed that the central mass concentration rather than the mass itself is a more important determinant of how giant arcs are produced by cluster-scale mass distributions. However, many studies have found that simple dissipationless (i.e. dark matter only) cosmological simulations tend to under-predict the abundance of SL galaxy clusters by an order of magnitude or more indicating that all factors such as triaxiality and substructure contributing to large strong lensing cross-sections have not been taken into account (e.g. Bartelmann et al., 1998; Luppino et al., 1999; Zaritsky & Gonzalez, 2003; Gladders et al., 2003; Li et al., 2006).
Additional factors that may contribute to large cross-sections include dark matter condensation due to cooling baryons (Rozo et al., 2008; Mead et al., 2010), central galaxies and substructure (Flores et al., 2000; Meneghetti et al., 2000, 2003; Hennawi et al., 2007; Meneghetti et al., 2010), triaxiality of cluster mass profiles (Oguri et al., 2003; Dalal et al., 2004; Hennawi et al., 2007; Meneghetti et al., 2010), major mergers that increase the cross-section on short timescales (Torri et al., 2004; Fedeli et al., 2006; Hennawi et al., 2007), structure along the line of sight not related to the lens or source (Wambsganss et al., 2005; Hilbert et al., 2007; Puchwein & Hilbert, 2009), and the properties of the background galaxies (Hamana & Futamase, 1997; Wambsganss et al., 2004; Bayliss et al., 2011a; Bayliss, 2012). Wambsganss et al. (2004) and Dalal et al. (2004) showed that increasing the source redshifts in simulations increases SL cross-sections. Failure to account for realistic source redshift distributions has been demonstrated to have a factor of effect on giant arc abundances (Bayliss, 2012). Using SL clusters to test predictions from theories and cosmological models has historically been limited by the lack of large, well-defined lens samples. The first homogeneously selected cluster lens samples had sizes N5 (Le Fevre et al., 1994; Zaritsky & Gonzalez, 2003; Gladders et al., 2003) and thus too small to have statistical power, but this is now changing as we move solidly into a new era of wide-field imaging surveys – such as the SDSS (e.g., Hennawi et al., 2008; Kubo et al., 2009; Diehl et al., 2009; Kubo et al., 2010; Bayliss et al., 2011b; Oguri et al., 2012), the Canada-France-Hawaii-Telescope Legacy Survey (CFHTLS; Cabanac et al., 2007), and the Second Red Sequence Cluster Survey (RCS2; Bayliss, 2012).
One reasonable physical scenario that could contribute to the accumulation of mass in the cores of strong lensing galaxy clusters involves baryonic cooling. The hot intracluster medium (ICM) in clusters cools by losing energy in the form of X-ray radiation. In this picture, in order to maintain hydrostatic equilibrium, the cool gas flows inward establishing a cooling flow (e.g. Fabian, 1994). In some galaxy clusters, the cooling rate in the center is anomalously high to the point that the cooling time is shorter than the Hubble time. Classical estimates suggest cooling rates of about 1000 M☉/yr which should lead to equally high star formation rates. However, such dramatic amounts of star formation are not observed so there must be some mechanism, such as feedback from active galactic nuclei, which can offset the energy loss from cooling (McNamara & Nulsen, 2007; Fabian, 2012; McNamara & Nulsen, 2012). Even so, there is often a small amount of cooling gas fueling star formation in these “cool core” clusters, representing the residual in the feedback/cooling balance, at typical levels of 1-10 M☉/yr (O’Dea et al., 2008; McDonald et al., 2011b), but can be as high as 100 M☉/yr (McNamara et al., 2006; O’Dea et al., 2008; McDonald et al., 2012b).
Several studies have found that cool core clusters also contain optical emission-line nebulae in the central regions (Hu et al., 1985; Johnstone et al., 1987; Heckman et al., 1989; Edwards et al., 2007; Hatch et al., 2007; McDonald et al., 2010, 2011a). In addition, star formation rates (SFR) in the brightest cluster galaxies (BCGs) of cool core clusters are known to be higher than SFRs in non-cool cores (Johnstone et al., 1987; McNamara & O’Connell, 1989; Allen, 1995) and excess IR emission has been found to be proportional to H emission suggesting both may be due to star formation as a result of the cooling intracluster medium (O’Dea et al., 2008). By studying UV and H emission of extended filaments in cool cores, McDonald et al. (2011b, 2012a) found that in the majority of clusters (with Perseus as a notable exception), the warm gas is primarily photoionized by massive, young stars, with small contributions most likely from slow shocks. Both the optical emission and the star formation seem to be related to the X-ray properties of the ICM, such as the X-ray cooling rate, suggesting that cooling gas from the intracluster medium is the source of the warm ionized gas and the fuel for star formation (e.g., Edge, 2001; O’Dea et al., 2008; McDonald et al., 2010, 2011a, 2011b; Tremblay et al., 2012). This link suggests that the presence of either warm ionized gas or ongoing star formation in the BCG may indicate that the ICM is cooling rapidly in the cluster core. Recent work demonstrates that the evolution of cool core clusters matches the evolution of optically emitting nebulae, suggesting that optical emission-line nebulae may serve as an effective tracer for cool cores (Donahue et al., 1992; McDonald, 2011; Samuele et al., 2011). This is significant because at high redshifts it is difficult to determine the cooling rate since the X-ray flux is very low for most of the sources. This paper makes use of the correlation between optical emission-line luminosity and cool core strength, the former having the advantage of being measureable from the ground via even modest aperture telescopes.
In this work we use observations of a sample of 89 strong lensing galaxy clusters with BCG spectra available from the SDSS to test for evidence that baryonic cooling is contributing strongly to the high surface mass density of strong lensing galaxy clusters. This paper is organized as follows. In Section 2 we describe the strong lensing cluster sample and the data analyzed. In Section 3, we describe our analysis methods and present the evolution of [OII] line emission and 4000Å break ratio for our sample compared to the total cluster population. Section 4 provides a discussion of the results and the paper concludes with a summary in Section 5.
In this paper we assume , , and H km s-1 Mpc-1 (Hinshaw et al., 2009).
2. Cluster Sample and SDSS Data
2.1. Strong Lensing Selected Cluster Sample
To minimize systematic effects and to allow statistically robust analysis it is important that we have a large, uniformly selected sample of SL clusters. In an attempt to obtain a well-understood sample, a systematic search for strong lensing galaxy clusters in the SDSS DR7 was carried out (Hennawi et al., 2008). Follow-up observations and analyses of subsets of the Sloan Giant Arcs Survey (SGAS) sample have been previously published (Bayliss et al., 2010; Koester et al., 2010; Bayliss et al., 2011b, a; Oguri et al., 2012). In brief, candidate galaxy clusters in the SDSS data were selected at optical wavelengths using the red sequence algorithm (Gladders & Yee, 2000). Each candidate optically selected galaxy cluster was visually inspected by four experts who each assigned a numerical score based on the presence or absence of any evidence of strong lensing in the images. The score scale ranges from 0 to 3 where 3 means there is obvious strong lensing and 0 means no evidence for lensing. The final score is the average of each individual score from each person. Follow-up observations were obtained so that the purity of the sample, the number of candidate strong lenses that actually are SL clusters, could be understood. These efforts have produced the first sample of hundreds of candidate strong lensing galaxy clusters, which will be described in full detail in a forthcoming publication (M. D. Gladders et al., in preparation).
We are using this new large sample of SL clusters to conduct the first systematic search for observational evidence of enhanced gas cooling in strong lensing galaxy clusters. The completeness and purity as a function of score for this SL sample is well understood and the majority of the sample clusters have deep, optical follow-up observations (98% follow-up for score 1.5 and 75% follow-up for score 1.0). We remove from the sample those clusters for which the score is below 1.3 to prevent clusters that do not clearly exhibit strong lensing from contaminating our conclusions because the purity of the sample as a function of score drops off strongly between mean scores of 1.5 and 1.0. After a visual inspection of deep follow-up images of each cluster, we also removed 6 SL cluster candidates that cannot be visually confirmed at high confidence as lenses. As described in detail in the next section, we then match the remaining clusters to the SDSS spectroscopic catalog using updated coordinates from follow-up data.

2.2. Matching SL Cluster Coordinates to BCG Spectra
In order to obtain the spectra for the BCGs of interest from the SDSS data set, the SL sample cluster coordinates were matched with the MPA-JHU release of spectrum measurements from SDSS DR7. The SL sample coordinates come from a visual inspection of the field where the centers of mass of the clusters are approximated by eye. When an arc forms around an obvious BCG, the centroid of the BCG is assigned as the center of mass. However, in cases where there is no obvious BCG, the centroid of the arc itself is used. As a result, we first look for exact matches to BCG spectra and then manually inspect the near-match cases. Coordinates of the SL clusters were compared to the positions in the spectral catalog to find the separation between each sample object and all the objects in the spectral database. The match for each sample cluster is then the object in the spectral database that is the smallest distance away from that SL cluster. 84 SL clusters had lensing centers that matched those of spectra in the database to within 1.5 arcseconds, where the 1.5 arcsecond cut is motivated by the size of the SDSS spectroscopic fiber aperture (3 arcsecond diameter).
Figure 1 shows the histogram of distances for the matching process between the SL cluster sample and the spectroscopic database. It is clear that some SL clusters do not have matches with the spectra file. Images of those non-matches for which the match distance is greater than 1.5 arcseconds but less than 2 arcminutes were manually inspected to determine if there are any appropriate bright cluster member galaxies with spectra. For example, some clusters may have multiple bright galaxies in the core, all located close to the center of mass of the cluster. The galaxy corresponding to the SL sample coordinates might not have a spectrum but another galaxy nearby, that is also part of the central mass distribution, might have one. As mentioned above, some of the SL coordinates are actually centroids of giant arcs so the corresponding BCG with a spectrum must be manually determined. 5 of the moderately matching systems were included in the final sample. The final sample thus results in 89 clusters. The spectroscopic redshift distribution of these clusters is shown in Figure 2.

2.3. Optically Selected Galaxy Cluster Catalog
To compare our results to the total cluster population, we are using the GMBCG catalog (Hao et al., 2010) which was also used by McDonald (2011) who studied the evolution of optical line emission in the total population. The GMBCG catalog was created by searching for BCGs and the red sequence to find galaxy clusters from SDSS DR7 producing a catalog of over 55,000 galaxy clusters in the redshift range 0.1 0.55. The spectroscopic redshift distribution of all the GMBCG clusters with SDSS spectra is shown in Figure 2. We can also compare the range in cluster masses spanned by the SL and GMBCG samples using a galaxy cluster richness estimator. Most of the SL clusters in our sample have measured richnesses from the GMBCG catalog. For the remaining clusters we used a similar procedure to that used by Hao et al. (2010) to measure richness so that we could compare the richness distribution between the two samples. We note that the richness distribution of our SL sample represents a subset of the richness distribution of the GMBCG catalog weighted towards higher richness. The mean richness and uncertainties of the SL sample is and the mean and uncertainty of the GMBCG is . The richnesses of the SL sample span the range and the GMBCG richnesses range from to with only greater than 87. The SL sample is drawn from the full range of GMBCG richnesses with a preference for higher richness as expected from simulations (Hennawi et al., 2007; Meneghetti et al., 2010).
2.4. SDSS Data
The relevent data include spectroscopic redshifts, emission line flux measurements and Å break ratios. The lines of interest in this work are H, [OII]3727, and [OIII]5007. We do not use H because at it is redshifted out of the wavelength coverage of SDSS. The [OII] line is a good tracer of star formation rates over the redshift range of our sample (Kennicutt, 1998; Kewley et al., 2003) and stays within the wavelength coverage of SDSS which is 3800Å - 9200Å111http://www.sdss.org/dr7/instruments/spectrographs/index.html. Also, in our redshift range the [OII] line stays blueward of bright sky lines that exist redward of 7300Å, which can cause residuals from sky subtraction.
An important property of the SDSS spectroscopic database is that the 3′′ spectroscopic fiber aperture encompasses different physical regions on the sky at different redshifts, as the angular diameter distance changes with redshift. For nearby BCGs, for example, the fiber aperture will only encompass a fraction of the total area of the BCG, and would therefore fail to detect any line emission from extended, often filamentary, regions beyond the physical radius probed by the SDSS fiber. McDonald (2011) showed that above a redshift of about 0.3, the fiber aperture encompasses nearly the total H emission from a sample of galaxy clusters. But for it is essential that an aperture correction be performed. Two aperture corrections were used in this work. McDonald (2011) derived a universal L profile based on low-z, well-resolved systems to determine the fraction of emission outside the aperture. The second correction assumes that the mean H luminosity should be constant with distance. Thus, the only change in H luminosity should be due to the aperture encompassing different physical diameters. As in McDonald (2011), we find that the two different aperture corrections produced consistent results.
3. Cooling Signatures in Strong Lensing Galaxy Clusters
3.1. Evolution of Emission in the Range
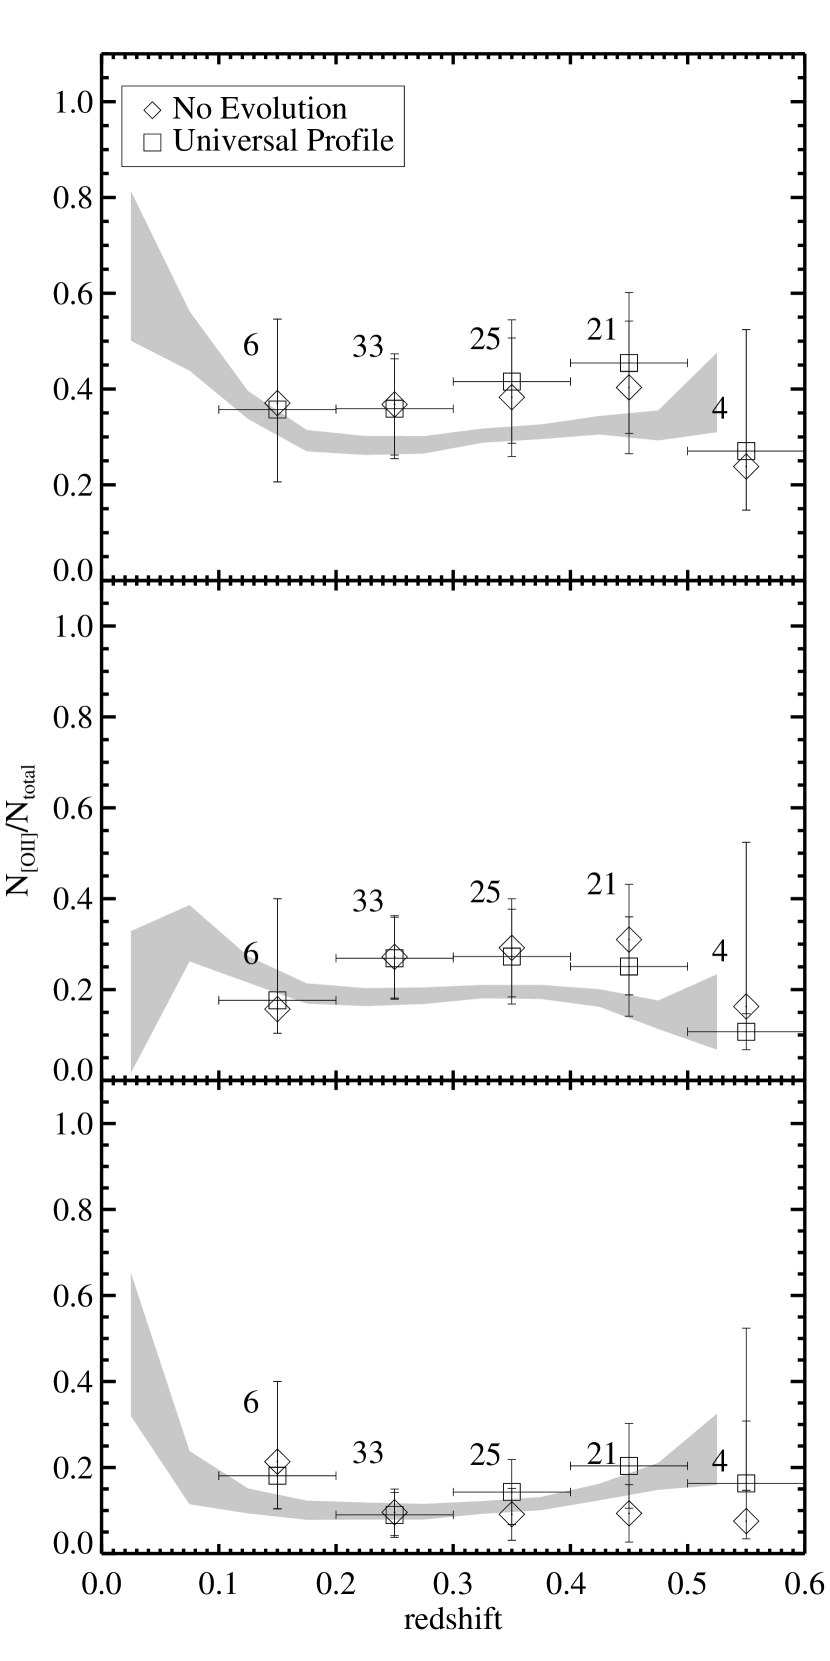
To understand the evolution of [OII] line emission in strong lensing galaxy clusters we must determine the fraction of SL galaxy clusters that exhibit [OII] line emission as a function of some redshift bin. To do this, for each SL galaxy cluster we calculate the probability, assuming Gaussian statistics, that the line luminosity is above a certain threshold. Following McDonald (2011), the condition for strong [OII] emission is erg s-1 and the condition for weak [OII] emission is erg s erg s-1. In a given redshift bin, the fraction of SL galaxy clusters with weak or strong [OII] emission is given by the average of the individual probabilities for each cluster in that bin. To avoid confusing optical line emission from warm gas in BCGs with AGN activity, if [OIII]/H (i.e. Seyfert galaxy where [OII] emission is not necessarily from star formation) for a particular cluster, the cluster is classified as non-emitting and the probability of being an [OII] emitter is set to zero. 14 of the SL clusters in the sample fall into this category of non-emitting.
Figure 3 shows the fraction of SL galaxy clusters with all, weak, and strong [OII] emission in the central galaxy. This is the evolution of [OII] emission for 89 SL galaxy clusters in the range . The over-plotted gray areas represent the evolution of emission for the GMBCG catalog from McDonald (2011). The statistical agreement between the SL sample and the GMBCG catalog indicates that the fraction of central galaxies in SL clusters with bright [OII] emission as a function of redshift differs little from the general cluster population. The trend of a constant fraction of optical line emission for in the general cluster population appears to be mirrored in the strong lensing cluster sample. If a large fraction of SL galaxy clusters showed strong [OII] emission, then this would suggest that baryonic cooling plays an important role in increasing SL cross-sections. Instead, we find no evidence for an enhancement in [OII] emission and thus, baryonic cooling, in strong lensing selected clusters. The mean [OII] fractions (for each of the all, weak, and strong cases) that we compute for both the SL sample and the GMBCG catalog at are given in Table LABEL:SL.
| SL Sample | GMBCG Catalog | |||
|---|---|---|---|---|
| Univ | NoEv | Univ | NoEv | |
| weak | .26.06 | .28.06 | .183.003 | .189.003 |
| strong | .14.04 | .09.03 | .125.003 | .110.002 |
| all | .40.07 | .38.07 | .308.004 | .299.004 |
3.2. Probing Star Formation Using the 4000Å Break Ratio
As a check on our results we can investigate the specific star formation rate (sSFR), another tracer of ongoing cooling, in each strong lensing BCG and compare it to the rate in the total population. This sSFR must be independent from our flux measurements to contain new information so we use the 4000Å break index provided by the MPA-JHU data release as a tracer for specific star formation rate. The 4000Å break index is the ratio of the mean flux in the range 4000Å - 4100Å to the mean flux in the range 3850Å - 3950Å (Brinchmann et al., 2004). Objects with low star formation, and thus few young, blue stars, will have strong 4000Å break ratios. In Figure 4 we plot the mean 4000Å break of our SL clusters in five redshift bins as well as the mean 4000Å break of the GMBCG catalog. There is no deviation from the GMBCG catalog, indicating that SL clusters exhibit the same specific rate of star formation as the general population of BCGs. This is consistent with our results above that found that [OII] line emission in SL clusters deviates little from the total population.
To understand the break strength distribution of the SL sample we also plot a histogram of the distribution in Figure 4. The lack of strong bimodality suggests that the SL sample clusters are not forming many stars in their cores. Typical star forming galaxies tend to have break strengths of 1.3 (Kauffmann et al., 2003). The division between star forming and non-star forming galaxies occurs around a break strenth of 1.6 (Kauffmann et al., 2003). The SL cluster BCGs have break strength values indicating they are predominantly non-star forming. The vertical lines in the histogram of Figure 4 indicate the 4000Å break strength values for various classical cool cores and non-cool cores. PKS0745, A1795, and A1835 are strong cool cores whereas A2029 is a non-cool core. The strong cool cores tend to have values well below the SL sample while A2029 has a value 0.1 away from the SL sample mean indicating that SL sample clusters are not exhibiting the typical break strength values of cool core clusters.

3.3. [OII] Emission Fraction As a Function of Strong Lensing Cross-Section
To better characterize the above results, we investigate whether or not clusters with a larger strong lensing cross-section show stronger emission. We use an observationally defined quantity, Rarc, for each cluster lens as a proxy for strong lensing cross-section. We define Rarc as the radial separation between the arcs and the center of mass of the SL clusters. Rarc is an observable that is simple to measure for our entire sample, and which provides an approximate estimate of the Einstein radius. The Einstein radius describes the critical curve for a given strong lens, and is defined analytically as the location in the lens plane where the formal magnification of a source distorted by a lens goes to infinity (Schneider et al., 1992). In the simplest case of a spherically symmetric lensing potential and perfect alignment between the source, lens, and observer, the source is re-imaged into a ring described by the Einstein radius. The radius of this ring is the Einstein radius, , and is given by:
| (1) |
where is Newton’s gravitational constant, is the mass of the lensing cluster, is the speed of light, DLS is the distance between the lens and the source, DL is the distance between the observer and the lens, and DS is the distance between the observer and the source.
Physically realistic lensing systems have critical curves with much more complex morphologies, but the Einstein radius for such systems can still be defined and measured as the radius of a circle which has the same area on the sky as the area contained within the critical curve. The size of the critical curve provides a measurement of the “strong-ness” of a strong lens, where the SL cluster population consists of a broad range of structures ranging from the rarest super-lenses with extreme strong lensing cross-sections, to the more numerous marginal strong lenses.
Detailed strong lensing reconstructions of the critical curves for our cluster lens sample is observationally unfeasible as it would require extensive follow-up observations. However, rather than model the critical curve for each SL cluster, it is also possible to define a simple observable quantity by fitting an ellipse to a multiply imaged source – or giant arc – and measure the radius corresponding to a circle with an area equal to the area of the fitted ellipse (Rarc). Tests in simulations show that this quantity has a large intrinsic uncertainty when used to estimate the Einstein radius for an individual lens system, but that on average it correlates with Einstein radius (Puchwein & Hilbert, 2009). We can therefore use Rarc for our SL cluster sample to sort lenses approximately by the size of their strong lensing cross-section. This sorting allows us to probe whether baryonic cooling processes may be helping to drive up strong lensing cross-sections within a subset of the total cluster lens population.
We estimate the radial separation, Rarc, of the arcs from the center of mass of the cluster in each SL cluster from optical follow-up images taken with the Mosaic Camera (MOSCA) on the 2.5m Nordic Optical Telescope. In each image the center of mass of the cluster (usually the BCG) as well as the arcs are located. The fitting program mpfitellipse (More, 1978; Markwardt, 2009) is then used to fit an ellipse to the curvature of the arcs to recover a rough estimate of the critical curve for each cluster lens. For the measured radial separations to be useful as a way to sort and compare members of our sample, they must be scaled to remove the distance dependence of each measurement. This is accomplished by scaling each measurement by:
| (2) |
where DLS, DL, DS are the relevant distance values for each particular cluster, and D, D, D are values for a fiducial lens configuration. Because the source redshifts for many of our individual SL systems are unknown, we use the typical source redshift as measured in the literature, z (Bayliss et al., 2011a; Bayliss, 2012). The source redshift uncertainty for each individual lens system produces a systematic uncertainty in the final scaled Rarc values for our SL cluster sample, but this uncertainty is quite small ( for a lens redshift of 0.3, the median of our sample) and does not impact our results.
With the scaled Rarc measurements, one can then determine the [OII] emission fraction as a function of Rarc (). Figure 5 shows the fraction of SL clusters with all, weak, and strong [OII] emission in four bins of Rarc. In this plot only those SL clusters with were included because this is where there is no evidence of changing [OII] emission fractions. From Figure 5 it seems that there is no statistically significant dependence of [OII] emission on Einstein radii above about 10 arcseconds. Below this value there is a slight increase in the fraction of weak [OII] emitters whereas the strong [OII] fraction is consistent with no dependence. For weak emission the data points in the bins below 10 arcseconds deviate from the GMBCG mean by about 1- and for total emission the data points deviate from the GMBCG mean by less than 1- and are thus not statistically robust deviations. Figure 5 also shows the 4000Å break strengths as a function of Rarc, which show no deviation from the GMBCG mean break strength and no evidence for variation in the break strength as a function of Rarc. Clusters with large Einstein radii exhibit optical tracers of baryonic cooling in their cores with the same frequency as clusters with small Einstein radii, and also as the total cluster population.

4. Discussion
Figure 3 demonstrates that the fraction of strong lensing galaxy clusters over the range with [OII] line-emitting BCGs is constant and shows no statistically significant deviation from the total cluster population, suggesting that baryonic cooling is not enhanced in SL clusters over the general cluster population. Figure 4 supports this conclusion by showing that there is no evolution in 4000Å break ratios and that they match the mean ratio in an optically selected sample of galaxy clusters – the GMBCG catalog. Furthermore, the typical D4000 value for the SL sample is consistent with non-cool cores that are not forming many stars in the BCG. If ongoing cooling were playing a continuing role in generating efficient SL clusters then we would expect to see some evidence of enhanced cooling in the form of intermediate temperature (104K) gas or ongoing star formation (e.g., Edge, 2001; O’Dea et al., 2008; McDonald et al., 2010, 2011a, 2011b; Tremblay et al., 2012), as traced by optical emission or the 4000Å break in the cluster cores.
We find no evidence for such an enhancement; instead, our analysis suggests that cool cores are no more prevalent in strong lensing clusters than in the general cluster population. Our results argue that baryonic cooling associated with cool core activity is not an efficient mechanism for dramatically increasing strong lensing cross-sections in galaxy clusters. Rozo et al. (2008) and Mead et al. (2010) found that simulations which include baryonic cooling can increase strong lensing cross-sections of simulated galaxy clusters by factors of 2-3. These scenarios require a “runaway” cooling flow which causes dark matter to condense in the core by sufficient amounts to alter the total matter density profile and the strong lensing properties of the cluster. Since runaway cooling flows are not observed, it is evident that other factors, like AGN feedback, act on sufficiently short timescales to prevent runaway cooling and unrealistically cuspy gas density profiles (Best et al., 2005; McNamara & Nulsen, 2007; Fabian, 2012; McNamara & Nulsen, 2012). Otherwise, we would observe the effects of this runaway cooling in the form of massive starbursts. This feedback scenario is consistent with recent studies (e.g. Mead et al., 2010; Killedar et al., 2012) that found that simulations which include models of AGN feedback, together with cold dark matter and gas dynamics, show less significant increases in strong lensing cross-sections. This agreement between observational and simulation-based results is encouraging, and suggests that the current generation of cosmological simulations include feedback models that are sufficiently sophisticated to recover the impact of baryonic processes on the total matter distribution in cluster cores.
Our results are also interesting in the context of recent work in which the slopes of the central density profiles in a small sample of relaxed clusters were estimated from multi-wavelength observations (Newman et al., 2013). The selection of the clusters studied by Newman et al. (2013) complicates a direct comparison between their conclusions and the results of our work, which uses a large generic strong lensing selection. Newman et al. (2013) found that the observed density profiles of their seven clusters are in good agreement with the predictions from dark matter (DM) only simulations, measuring total density profiles in the cores of seven clusters with slopes that match cold dark matter (CDM) simulations. They argue that dynamical heating is a possible mechanism for offsetting any effects that baryonic contraction might have on the matter distribution in massive cluster cores.
It makes sense that the results of such a mechanism would be observable in a sample of clusters that was chosen specifically to be dynamically relaxed and undisturbed, where the total matter distribution in the cores (baryonicDM) has had the opportunity to virialize. However, the strong lensing selection of the SGAS cluster lens sample does not preferentially select for relaxed systems, and in fact there is evidence suggesting that dynamically disturbed and merging systems should be well-represented in a strong lensing selected cluster sample (Torri et al., 2004; Oguri et al., 2013). The matter distribution in the cores of such a sample should not necessarily be expected to have the same average profile properties as a sample that is selected to be relaxed.
Having noted the different selection criteria for our sample and that of Newman et al. (2013), we do note that there is broad agreement between our results and those of Newman et al. (2013) in that neither result favors a scenario in which baryonic cooling is acting to steepen the matter distributions in the cores of clusters. It therefore follows that it is not reasonable to invoke baryonic cooling as a dominant explanation for the apparent discrepancies between observed and predicated arc abundances (Bartelmann et al., 1998; Luppino et al., 1999; Zaritsky & Gonzalez, 2003; Gladders et al., 2003; Li et al., 2006).
We note that in Figure 5 there is a marginal increase (at the level) in the fraction of strong lensing clusters with R exhibiting weak [OII] emission. The observable Rarc correlates strongly with Einstein Radius, which itself correlates with the total mass of the cluster lens, so that the R bin will include, on average, the lower-mass cluster lenses in our sample. This marginal increase is in qualitative agreement with the suggestion that baryonic cooling could be responsible for small excesses in the concentration parameters measured for lower-mass and smaller Einstein radius strong lensing selected clusters by Oguri et al. (2012). However, neither the increase in optical line emission that we measure, nor the excess concentrations in Oguri et al. (2012) are statistically robust (i.e. 2-), and we refrain from claiming that the combination of these two results can be interpreted as strong evidence for cooling baryons driving up concentrations in low-mass or small Einstein radius strong lensing clusters. These marginal excesses in optical line emission and concentration could, however, reflect consistency with the expectation from simulations that gas cooling may more strongly affect clusters with lower masses where the cooling mass in the core can comprise a larger fraction of the total mass (Rozo et al., 2008; Killedar et al., 2012).
5. Summary
In this work, we searched for optical line emission and recent star formation in a sample of 89 strong lensing galaxy clusters to probe whether or not baryonic cooling processes significantly affect the mass density profiles of clusters. Using published SDSS spectral data for the BCGs of the SL clusters we have calculated the fraction of SL clusters with [OII] line emission as a function of redshift. We find that the evolution of [OII] line emission in the SL sample is constant for and that there is no statistically significant difference between the SL sample and the general cluster population. The 4000Å break ratio in the SL sample also matches the general population, indicating that the average specific star formation rate is similar between the two populations. We also sorted the SL cluster sample by Rarc – an observable that correlates strongly with Einstein radius – to look for trends in the optical tracers of gas cooling as a function of the individual lens cross-sections. We find that [OII] line emission fractions and 4000Å break ratios showed no significant dependence on Einstein radius, suggesting that baryonic cooling does not play a large role increasing strong lensing cross-sections among either the small or large strong lensing cross-section end of the total cluster lens population. The results of this work combined with the well-studied correlations between ICM cooling and BCG star formation and line emission argue strongly that baryonic cooling associated with cool core activity does not significantly influence the dark matter distribution to steepen the mass density profile in the cores of strong lensing galaxy clusters.
References
- Allen (1995) Allen, S. W. 1995, MNRAS, 276, 947
- Bartelmann et al. (1998) Bartelmann, M., Huss, A., Colberg, J. M., Jenkins, A., & Pearce, F. R. 1998, A&A, 330, 1
- Bayliss et al. (2010) Bayliss, M. B., Wuyts, E., Sharon, K., et al. 2010, ApJ, 720, 1559
- Bayliss (2012) Bayliss, M. B. 2012, ApJ, 744, 156
- Bayliss et al. (2011a) Bayliss, M. B., Gladders, M. D., Oguri, M., Hennawi, J. F., Sharon, K., Koester, B. P., & Dahle, H. 2011a, ApJ, 727, L26
- Bayliss et al. (2011b) Bayliss, M. B., Hennawi, J. F., Gladders, M. D., Koester, B. P., Sharon, K., Dahle, H., & Oguri, M. 2011b, ApJS, 193, 8
- Best et al. (2005) Best, P. N., Kauffmann, G., Heckman, T. M., Brinchmann, J., Charlot, S., Ivezić, Ž., & White, S. D. M. 2005, MNRAS, 362, 25
- Brinchmann et al. (2004) Brinchmann, J., Charlot, S., White, S. D. M., Tremonti, C., Kauffmann, G., Heckman, T., & Brinkmann, J. 2004, MNRAS, 351, 1151
- Cabanac et al. (2007) Cabanac, R. A., et al. 2007, A&A, 461, 813
- Cameron (2011) Cameron, E. 2011, PASA, 28, 128
- Dalal et al. (2004) Dalal, N., Holder, G., & Hennawi, J. F. 2004, ApJ, 609, 50
- Diehl et al. (2009) Diehl, H. T., et al. 2009, ApJ, 707, 686
- Donahue et al. (1992) Donahue, M., Stocke, J. T., & Gioia, I. M. 1992, ApJ, 385, 49
- Edge (2001) Edge, A. C. 2001, MNRAS, 328, 762
- Edwards et al. (2007) Edwards, L. O. V., Hudson, M. J., Balogh, M. L., & Smith, R. J. 2007, MNRAS, 379, 100
- Fabian (1994) Fabian, A. C. 1994, ARA&A, 32, 277
- Fabian (2012) Fabian, A. C. 2012, ARA&A, 50, 455
- Fedeli et al. (2006) Fedeli, C., Meneghetti, M., Bartelmann, M., Dolag, K., & Moscardini, L. 2006, A&A, 447, 419
- Flores et al. (2000) Flores, R. A., Maller, A. H., & Primack, J. R. 2000, ApJ, 535, 555
- Gladders et al. (2003) Gladders, M. D., Hoekstra, H., Yee, H. K. C., Hall, P. B., & Barrientos, L. F. 2003, ApJ, 593, 48
- Gladders & Yee (2000) Gladders, M. D., & Yee, H. K. C. 2000, AJ, 120, 2148
- Hamana & Futamase (1997) Hamana, T., & Futamase, T. 1997, MNRAS, 286, L7
- Hao et al. (2010) Hao, J., et al. 2010, ApJS, 191, 254
- Hatch et al. (2007) Hatch, N. A., Crawford, C. S., & Fabian, A. C. 2007, MNRAS, 380, 33
- Heckman et al. (1989) Heckman, T. M., Baum, S. A., van Breugel, W. J. M., & McCarthy, P. 1989, ApJ, 338, 48
- Hennawi et al. (2007) Hennawi, J. F., Dalal, N., Bode, P., & Ostriker, J. P. 2007, ApJ, 654, 714
- Hennawi et al. (2008) Hennawi, J. F., et al. 2008, AJ, 135, 664
- Hilbert et al. (2007) Hilbert, S., White, S. D. M., Hartlap, J., & Schneider, P. 2007, MNRAS, 382, 121
- Hinshaw et al. (2009) Hinshaw, G., et al. 2009, ApJS, 180, 225
- Hu et al. (1985) Hu, E. M., Cowie, L. L., & Wang, Z. 1985, ApJS, 59, 447
- Johnstone et al. (1987) Johnstone, R. M., Fabian, A. C., & Nulsen, P. E. J. 1987, MNRAS, 224, 75
- Kauffmann et al. (2003) Kauffmann, G., et al. 2003, MNRAS, 341, 33
- Kennicutt (1998) Kennicutt, Jr., R. C. 1998, ARA&A, 36, 189
- Kewley et al. (2003) Kewley, L. J., Geller, M. J., & Jansen, R. A. 2003, in Bulletin of the American Astronomical Society, Vol. 35, American Astronomical Society Meeting Abstracts, 119.01
- Killedar et al. (2012) Killedar, M., Borgani, S., Meneghetti, M., Dolag, K., Fabjan, D., & Tornatore, L. 2012, MNRAS, 427, 533
- Koester et al. (2010) Koester, B. P., Gladders, M. D., Hennawi, J. F., et al. 2010, ApJ, 723, L73
- Kubo et al. (2009) Kubo, J. M., Allam, S. S., Annis, J., Buckley-Geer, E. J., Diehl, H. T., Kubik, D., Lin, H., & Tucker, D. 2009, ApJ, 696, L61
- Kubo et al. (2010) Kubo, J. M., et al. 2010, ApJ, 724, L137
- Le Fevre et al. (1994) Le Fevre, O., Hammer, F., Angonin, M. C., Gioia, I. M., & Luppino, G. A. 1994, ApJ, 422, L5
- Li et al. (2006) Li, G. L., Mao, S., Jing, Y. P., Mo, H. J., Gao, L., & Lin, W. P. 2006, MNRAS, 372, L73
- Luppino et al. (1999) Luppino, G. A., Gioia, I. M., Hammer, F., Le Fèvre, O., & Annis, J. A. 1999, A&AS, 136, 117
- Markwardt (2009) Markwardt, C. B. 2009, in Astronomical Society of the Pacific Conference Series, Vol. 411, Astronomical Data Analysis Software and Systems XVIII, ed. D. A. Bohlender, D. Durand, & P. Dowler, 251
- McDonald (2011) McDonald, M. 2011, ApJ, 742, L35
- McDonald et al. (2011a) McDonald, M., Veilleux, S., & Mushotzky, R. 2011a, ApJ, 731, 33
- McDonald et al. (2012a) McDonald, M., Veilleux, S., & Rupke, D. S. N. 2012a, ApJ, 746, 153
- McDonald et al. (2010) McDonald, M., Veilleux, S., Rupke, D. S. N., & Mushotzky, R. 2010, ApJ, 721, 1262
- McDonald et al. (2011b) McDonald, M., Veilleux, S., Rupke, D. S. N., Mushotzky, R., & Reynolds, C. 2011b, ApJ, 734, 95
- McDonald et al. (2012b) McDonald, M., et al. 2012b, Nature, 488, 349
- McNamara & Nulsen (2007) McNamara, B. R., & Nulsen, P. E. J. 2007, ARA&A, 45, 117
- McNamara & Nulsen (2012) McNamara, B. R., & Nulsen, P. E. J. 2012, New Journal of Physics, 14, 055023
- McNamara & O’Connell (1989) McNamara, B. R., & O’Connell, R. W. 1989, AJ, 98, 2018
- McNamara et al. (2006) McNamara, B. R., et al. 2006, ApJ, 648, 164
- Mead et al. (2010) Mead, J. M. G., King, L. J., Sijacki, D., Leonard, A., Puchwein, E., & McCarthy, I. G. 2010, MNRAS, 406, 434
- Meneghetti et al. (2003) Meneghetti, M., Bartelmann, M., & Moscardini, L. 2003, MNRAS, 346, 67
- Meneghetti et al. (2000) Meneghetti, M., Bolzonella, M., Bartelmann, M., Moscardini, L., & Tormen, G. 2000, MNRAS, 314, 338
- Meneghetti et al. (2010) Meneghetti, M., Fedeli, C., Pace, F., Gottlöber, S., & Yepes, G. 2010, A&A, 519, A90
- More (1978) More, J. 1978, in Lecture Notes in Mathematics, Vol. 630, Numerical Analysis, ed. G. Watson (Springer Berlin / Heidelberg), 105–116, 10.1007/BFb0067700
- Newman et al. (2013) Newman, A. B., Treu, T., Ellis, R. S., et al. 2013, ApJ, 765, 24
- O’Dea et al. (2008) O’Dea, C. P., et al. 2008, ApJ, 681, 1035
- Oguri et al. (2012) Oguri, M., Bayliss, M. B., Dahle, H., Sharon, K., Gladders, M. D., Natarajan, P., Hennawi, J. F., & Koester, B. P. 2012, MNRAS, 420, 3213
- Oguri et al. (2003) Oguri, M., Lee, J., & Suto, Y. 2003, ApJ, 599, 7
- Oguri et al. (2013) Oguri, M., Schrabback, T., Jullo, E., et al. 2013, MNRAS, 429, 482
- Puchwein & Hilbert (2009) Puchwein, E., & Hilbert, S. 2009, MNRAS, 398, 1298
- Rozo et al. (2008) Rozo, E., Nagai, D., Keeton, C., & Kravtsov, A. 2008, ApJ, 687, 22
- Samuele et al. (2011) Samuele, R., McNamara, B. R., Vikhlinin, A., & Mullis, C. R. 2011, ApJ, 731, 31
- Schneider et al. (1992) Schneider, P., Ehlers, J., & Falco, E. E. 1992, Gravitational Lenses
- Torri et al. (2004) Torri, E., Meneghetti, M., Bartelmann, M., Moscardini, L., Rasia, E., & Tormen, G. 2004, MNRAS, 349, 476
- Tremblay et al. (2012) Tremblay, G. R., et al. 2012, MNRAS, 424, 1042
- Wambsganss et al. (2004) Wambsganss, J., Bode, P., & Ostriker, J. P. 2004, ApJ, 606, L93
- Wambsganss et al. (2005) Wambsganss, J., Bode, P., & Ostriker, J. P. 2005, ApJ, 635, L1
- Zaritsky & Gonzalez (2003) Zaritsky, D., & Gonzalez, A. H. 2003, ApJ, 584, 691