Dusty OB Stars in the Small Magellanic Cloud - I: Optical Spectroscopy Reveals Predominantly Main-Sequence OB Stars
Abstract
We present the results of optical spectroscopic follow-up of 125 candidate main sequence OB stars in the Small Magellanic Cloud (SMC) that were originally identified in the S3MC infrared imaging survey as showing an excess of emission at 24 µm indicative of warm dust, such as that associated with a transitional or debris disks. We use these long-slit spectra to investigate the origin of the 24 m emission and the nature of these stars. A possible explanation for the observed 24 µm excess, that these are emission line stars with dusty excretion disks, is disproven for the majority of our sources. We find that 88 of these objects are normal stars without line emission, with spectral types mostly ranging from late-O to early-B; luminosity classes from the literature for a sub-set of our sample indicate that most are main-sequence stars. We further identify 17 emission-line stars, 7 possible emission-line stars, and 5 other objects with forbidden-line emission in our sample. We discover a new O6 Iaf star; it exhibits strong He II 4686 Å emission but relatively weak N III 4640 Å emission that we attribute to the lower nitrogen abundance in the SMC. Two other objects are identified with planetary nebulae, one with a young stellar object, and two with X-ray binaries. To shed additional light on the nature of the observed 24 µm excess we use optical and infrared photometry to estimate the dust properties of the objects with normal O and B star spectra and compare these properties to those of a sample of hot spots in the Galactic interstellar medium (ISM). We find that the dust properties of the dusty OB star sample resemble the properties of the Galactic sample of hot spots. Some may be runaway systems with bow-shocks resulting from a large velocity difference between star and ISM. We further investigate the nature of these dusty OB stars in a companion paper presenting mid-infrared spectroscopy and additional imaging.
Subject headings:
dust — infrared: ISM — infrared: stars — Magellanic Clouds — planetary systems: formation — stars: early-type1. Introduction
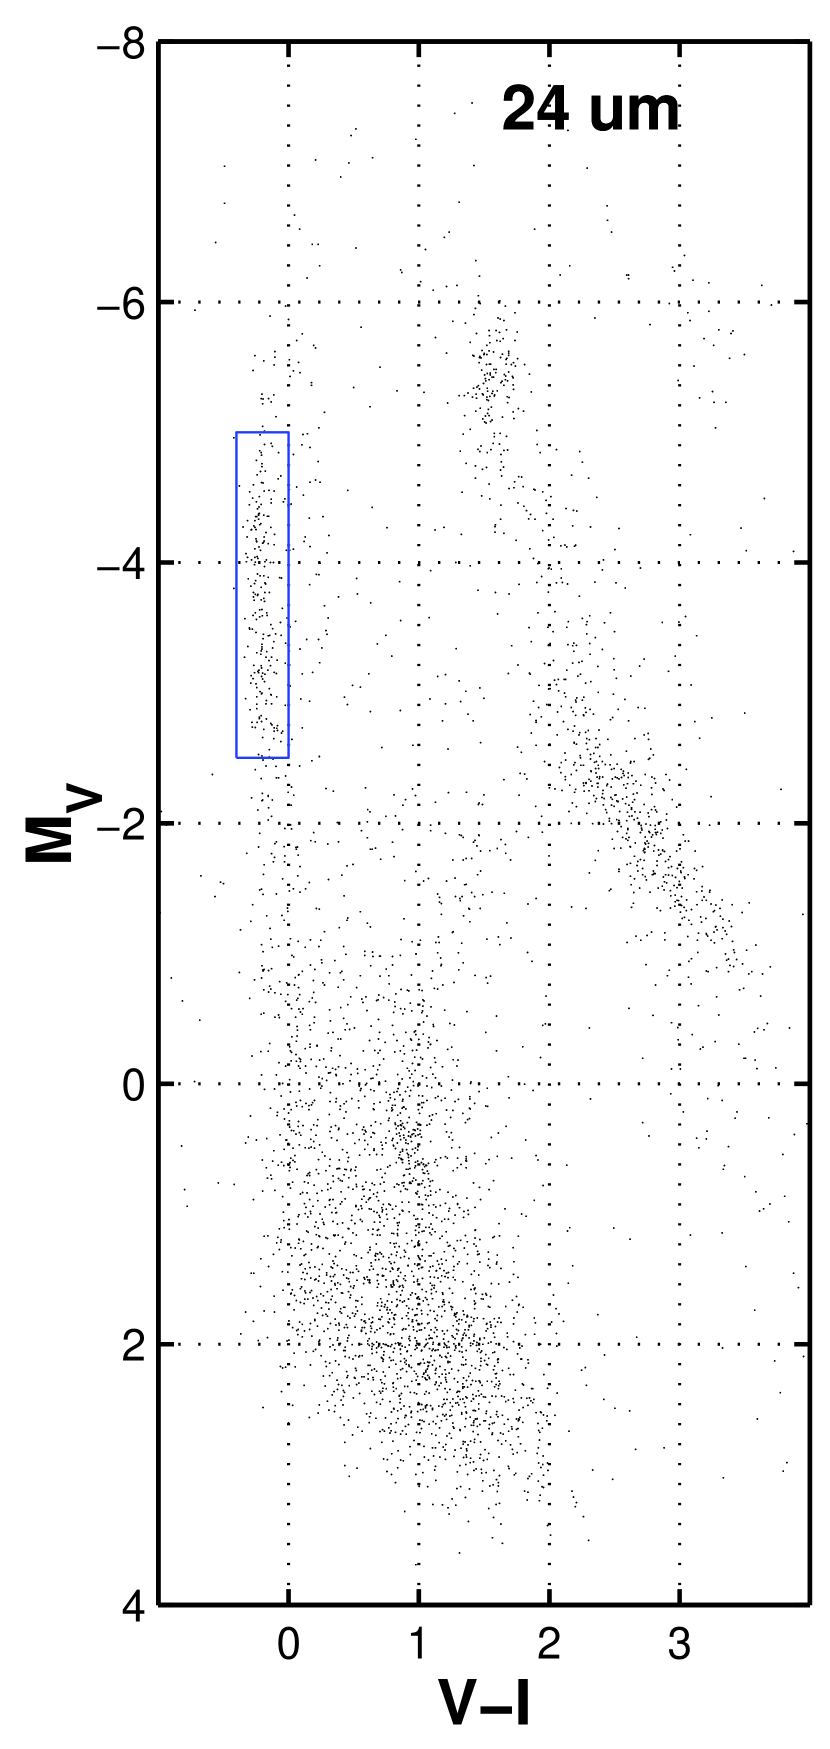
The Spitzer Survey of the Small Magellanic Cloud (S3MC) carried out deep imaging of the main body of the SMC in all seven IRAC and MIPS bands (Bolatto et al., 2007). This survey identified about 400,000 compact sources in the infrared. Compilation of spectral energy distributions and cross-correlation against optical catalogs uncovered 193 point sources with 24-µm emission, but with optical and near-infrared colors and magnitudes all consistent with O9–B3 type main-sequence stars. Photospheres of such stars are well below the detection limit of this survey, so an additional source of infrared (IR) emission must be present, presumably warm dust with a temperature close to 150 K. Figure 1 shows the color–magnitude diagram for all objects detected at 24 µm in the S3MC survey, and the box represents the and cuts on the dusty OB star sample. These sources are a puzzle, representing a few percent of all the stars in that particular color and magnitude range in the SMC. Dust in close proximity to an early B/late O star could be a remnant from the accretion process, and provide important information about the final stages of accretion and the clearing up of the original disk in massive stars. We discuss below several competing possibilities for the nature of these sources, previously presented by Bolatto et al. (2007). The discovery of these objects has been confirmed independently by the Spitzer SAGE-SMC survey (Bonanos et al., 2010, who also discuss them) and by Ita et al. (2010) using AKARI data.
If the dust is associated with the star, it must exist either in an optically thin shell surrounding the star or in a thin or transition circumstellar disk, since no appreciable reddening of the central star is detected beyond the line-of-sight extinction by our own Galaxy to the SMC. These objects have to 10-2, indicating that the dust is intercepting only a small fraction of the star’s light and re-radiating it in the IR. This also supports the thin shell or disk scenario. Since most of the dusty OB stars show little to no excess emission at wavelengths of 8 µm or shorter, a large central gap would be needed to explain the absence of significant emission from hotter dust located close to the star.
A clump of interstellar dust, heated by a nearby star, however, could also reproduce these characteristics. This is observed, for example, in the Pleiades (Arny, 1977; White & Bally, 1993; Herbig & Simon, 2001; Sloan et al., 2004). Vega-like stars, Herbig Ae/Be stars, and classical Be stars all have disks that are known to contain dust to varying degrees, and so we consider them, as well as cirrus hot spots in the ISM, as the possible causes for the excess emission seen around these O and B stars in the S3MC survey.
Vega-like stars host debris disks, which are the remnants of planet formation. They are optically thin dust disks, mostly stripped of their primordial gas and continually replenished by collisions between planetesimals. The prototypical examples are Vega, Fomalhaut, and Pictoris, all of which have disks that extend 100 to 1000 au from the star with LIR/LBol to 10-3 (Backman & Paresce, 1993, and references therein). The central region, a few au in extent, of these disks has been cleared of dust, just as in our solar system, and the mass of emitting dust is 10-3 to 10-2 M⊕ at temperatures between 50 and 125 K. The wider sample of debris disks shows an upper limit on FIR/FBol of 10-2 (Chen et al., 2006), temperatures up to 300 K, and dust masses as large as an Earth mass (Krivov, 2010). Note however that the known debris-disk hosts are observed, overwhelmingly, around much less massive stars with later spectral types. A gas-free disk around a very luminous star would be quickly cleared by radiation pressure, unless the dust grains are very large.
Classical Be stars are rapidly rotating main-sequence stars with an excretion disk of gaseous material (Porter & Rivinius, 2003). The disk produces IR excess in the form of free–free emission with approximately in the near- and mid-IR (Waters & Marlborough, 1994); this by itself would not explain the sudden rise observed in the spectral energy distribution (SED) of the dusty O and B stars at 24 µm. Miroshnichenko & Bjorkman (2000), however, found evidence for circumstellar, thermal dust emission in some Be stars in the far-IR, which they attribute to remnant dust from prior evolutionary processes.
Herbig Ae/Be stars, on the other hand, are pre-main sequence stars that are thought to be the more massive analogs to T Tauri stars. They are surrounded by gaseous accretion disks containing dust with temperatures as high as 1500 K, creating the IR excess (see, e.g. Hillenbrand et al., 1992; Waters & Waelkens, 1998). Herbig Ae/Be stars typically show significant excess at µm from this hot dust. The onset of the emission at longer wavelengths indicates that the central portion of the disk nearest the star has been cleared and is free of dust. Disks with such a central hole are transition disks (e.g., Cieza et al., 2010). It is possible that more massive, early-B and O stars also go through this stage, although modeling suggests that this may be an exceedingly short phase as disks are rapidly cleared (Alexander et al., 2006). Observational evidence for circumstellar disks around massive B and O stars remains hard to come by (Cesaroni et al., 2007).
The Galactic cirrus, comprised of wispy or filamentary patches of dust throughout the disk of the Galaxy, has a typical temperature of K (Planck Collaboration et al., 2011), but heating of the cirrus by embedded stars produces small regions of warmer dust, or hot spots, near the star, reaching temperatures of K (van Buren & McCray, 1988). It is difficult to distinguish debris disks from hot spots in the cirrus without resolved images of either the dust emission in the IR, or the scattered light in the optical. The observed SEDs can be interpreted with either scenario, as illustrated by Martínez-Galarza et al. (2009) and Su et al. (2006); Martínez-Galarza et al. model some of the same objects in Su et al. as ISM heated by stars passing through a cloud, while Su et al. model them as debris disks. Cirrus hot spots are also sometimes the cause of the far-IR emission detected around Be stars (Miroshnichenko & Bjorkman, 2000).
Understanding the source of the excess emission in these objects is valuable because the scenarios above represent different phases in the evolution of massive stars. Detecting circumstellar material around SMC stars is interesting, because it offers the opportunity to study accretion or excretion processes in a low metallicity environment, and particularly around massive stars with an unextincted line-of-sight. Detecting debris disks in the SMC would be especially exciting, as they would offer an unprecedented opportunity to study planet formation in another galaxy. Such early-type stars are under-represented in Galactic studies.
While the photometry suggested the stellar counterparts of the IR emission to be early-type main-sequence stars, this has yet to be confirmed through spectroscopic observation. The vast majority of the 193 objects in our sample do not have spectral types reported in the literature, although a small subsample has fiber optics spectroscopy (Evans et al., 2004).
Bonanos et al. (2010) compiled a catalog of IR counterparts to massive stars spectroscopically confirmed in the literature. They identify 44 objects that are similar (OB stars with 24 m emission) but not necessarily identical to our sample. They constitute % of their sample of late-O and early-B stellar types, a fraction slightly lower but otherwise similar to that reported by Bolatto et al. (2007). The 18 spectra Bonanos et al. have in hand show nebular line emission, unlike — as we shall see — the majority of the sources in this sample. Note that the spectra used by Bonanos et al. are obtained using fibers (Evans et al., 2004, 2006), which makes sky subtraction in complex regions problematic. Long-slit spectroscopy is preferred in regions of diffuse sky emission such as found around massive stars. Clearly, further spectroscopic study is warranted. Bonanos et al. (2010) conclude that most of their sources are not found within very young regions, and suggest their IR emission is likely dust associated with cirrus or a nearby molecular cloud, rather than disks. Bolatto et al. (2007), however, noted that the majority of the sources identified in their sample are in the vicinity of active star-forming regions although not in their cores, where confusion with diffuse 24 m emission would make their identification extremely difficult.
We obtained optical long-slit spectroscopy for 125 of the 193 objects from the S3MC survey in order to determine how many of them are emission-line (e.g., classical Be and Herbig Ae/Be) stars and to obtain spectral types to quantify the stellar radiation field illuminating the dust. In section 2 of this paper, we discuss the photometric and spectroscopic observations, while in section 3 we classify the stars, and in section 4 we estimate the properties of the dust around the non-emission line objects. In section 5, we discuss how well the various scenarios explain our objects and include a comparison of the dust properties to those estimated from the sample of Galactic cirrus hot spots of Gaustad & van Buren (1993). In a companion paper (Adams et al., 2013, hereafter Paper II), we discuss further infrared spectroscopic and photometric information, and comparisons to large Galactic samples based on Wide-field Infrared Survey Explorer (WISE) data.
2. Observations
2.1. Spectroscopy
The optical spectra were obtained at the 3.5-m New Technology Telescope at the European Southern Observatory at La Silla, Chile in 2007 September (programme 079.C-0485; PI J.Th.van Loon), using the EMMI instrument (Dekker et al., 1986) in RILD mode in the red arm with grism #2 and a slit. This set-up provided wavelength coverage from to 870 nm with . Biases, dome flats, and HeAr arc lamp frames were acquired for calibration. The science integrations were split into three exposures, offset along the slit, in order to correct for cosmic rays and fringing effects at wavelengths beyond 750 nm). A filter to block second-order contamination longward of 800 nm was originally planned, but it was dropped because of unwanted reduction of signal in the blue region of the spectrum.
The spectra were wavelength-calibrated with HeAr lamp exposures, using the IRAF111IRAF is distributed by the National Optical Astronomy Observatories. identify, reidentify, and transform tasks in the noao spectroscopic reduction package. The 1D spectra were then extracted using the apsum task. The extraction was at times complicated by the background emission lines from H II regions within which our targets were located. To remove this background, the aperture and background regions were set interactively, looking first at the profile of the star along the slit, away from any emission lines. If any [O III] 5007 Å emission remained in the extracted spectrum, the extraction was re-done looking instead at the profile along the slit at the [O III] line to set the aperture and background regions. The extracted spectra were summed for each object to increase the number of counts and to average out fringing effects and an electronic interference pattern that could not be removed with the bias or dark frames due to frame-to-frame variations. Lastly, the spectra were normalized to the continuum in the region between 400 and 680 nm by fitting and dividing by an order 20 polynomial.
2.2. Photometry
The photometry used to create the SEDs for each source is a combination of B, V, and I data from the OGLE II survey (Udalski et al., 1998) and the Magellanic Clouds Photometric Survey (Zaritsky et al., 2002), J, H, and Ks from the 2MASS survey (Skrutskie et al., 2006), and Spitzer Space Telescope (Werner et al., 2004) data from both the original S3MC (Bolatto et al., 2007) survey and the combined S3MC/SAGE-SMC catalogs (Gordon et al., 2011), making use of the IRAC (Fazio et al., 2004) and MIPS (Rieke et al., 2004) instruments. In the SAGE-SMC processing, combined S3MC/SAGE-SMC images were created by stacking data from both surveys before performing the photometry. For the MIPS combined catalog, on the other hand, photometry was performed on the three different observing epochs (one for S3MC, and two for SAGE-SMC) separately, after uniformly reprocessing the data. We searched the combined catalogs for coordinate matches to the dusty OB stars within 2″. The IRAC and 2MASS data points in the original S3MC photometry were replaced with the points in the combined catalog if they existed. If more than one match was found, the closest match was used. The 24 µm points in the original S3MC catalog were replaced with the weighted average of the three epochs in the combined catalog for the the closest positional match. Points were replaced as long as there was a match within 2″ in at least one of the epochs. The 70 µm data points, where they exist, must be treated with caution. The diffuse emission in the SMC is considerably brighter at 70 µm than at 24 µm, and the difference in beam size between the two channels is substantial. The beam size at 24 µm is 6″, corresponding to 2 pc at the SMC distance of 61.1 kpc (Keller & Wood, 2006), while the beam size at 70 µm is 18″, corresponding to 5 pc. Thus there is a good chance of source confusion between the two channels, and we have not searched the combined S3MC/SAGE-SMC catalog for 70 µm matches. The photometry data are given in Tables 1 and 2.
3. Spectral Classification
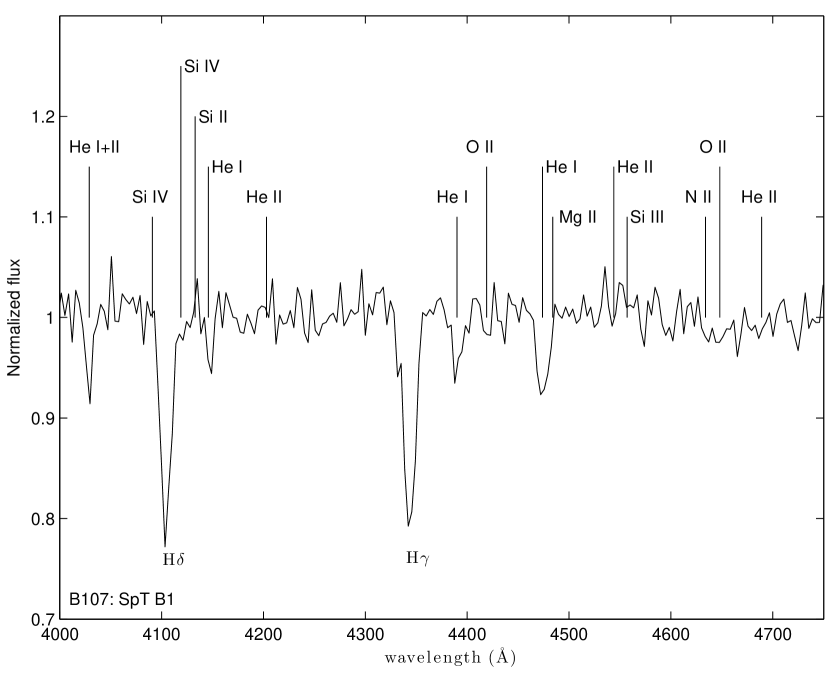
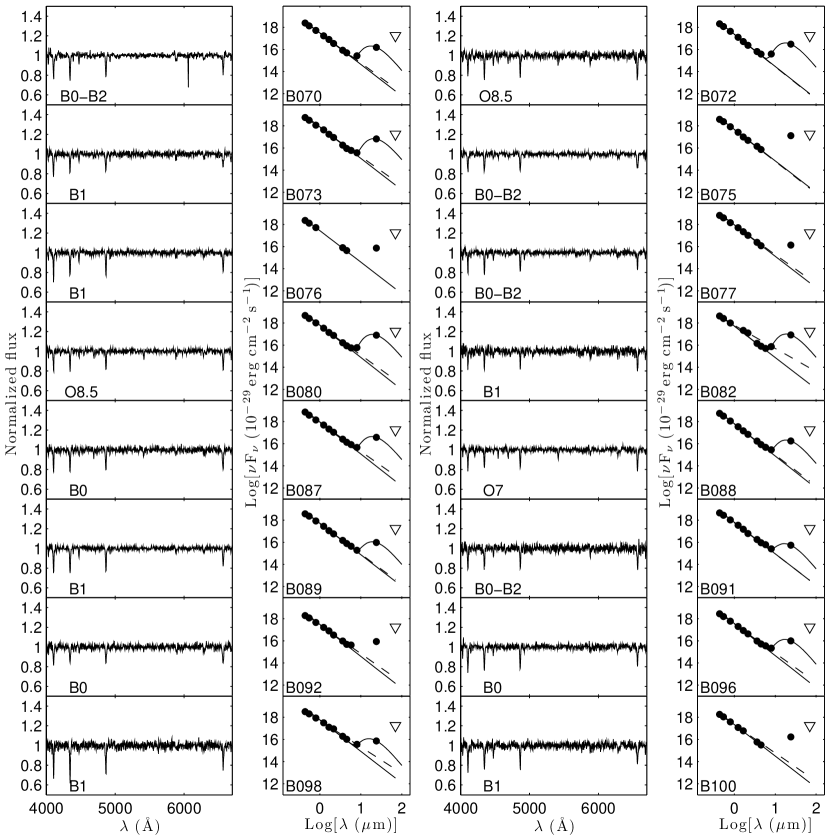
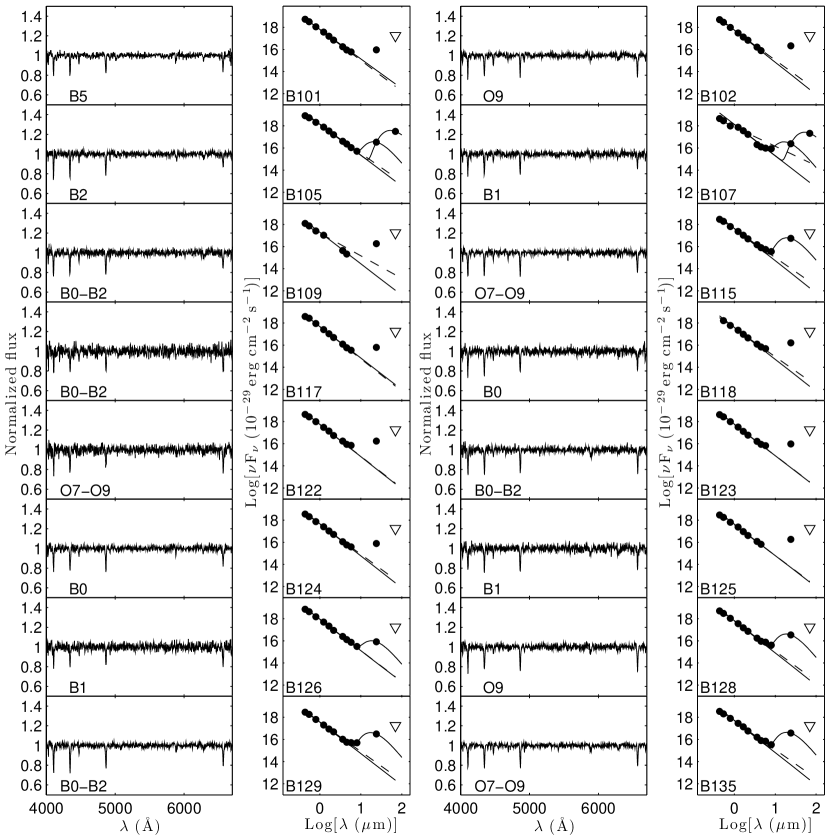
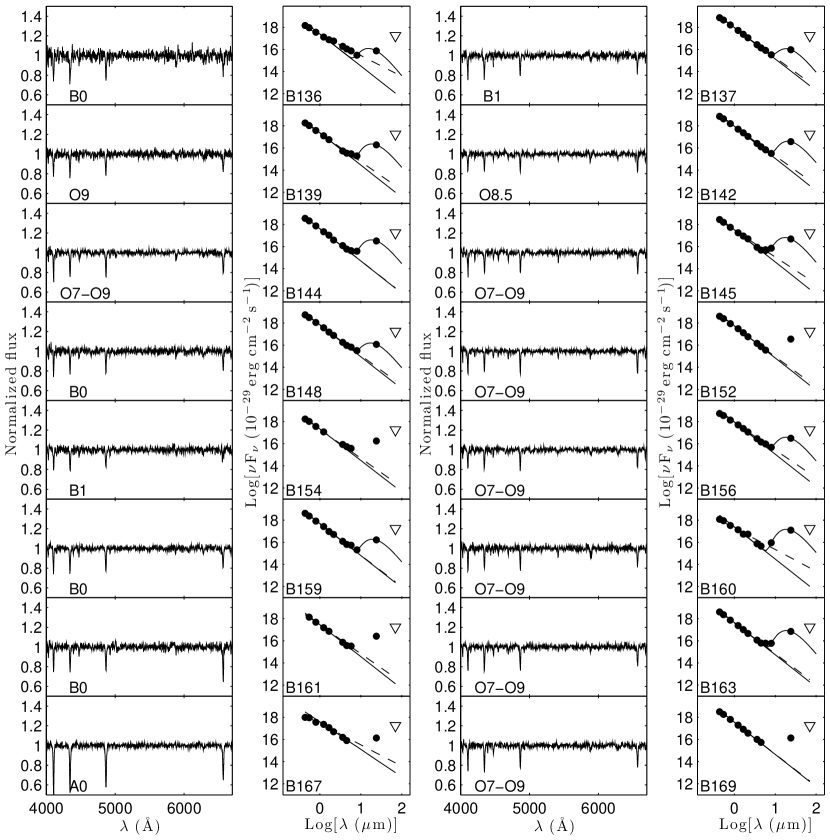
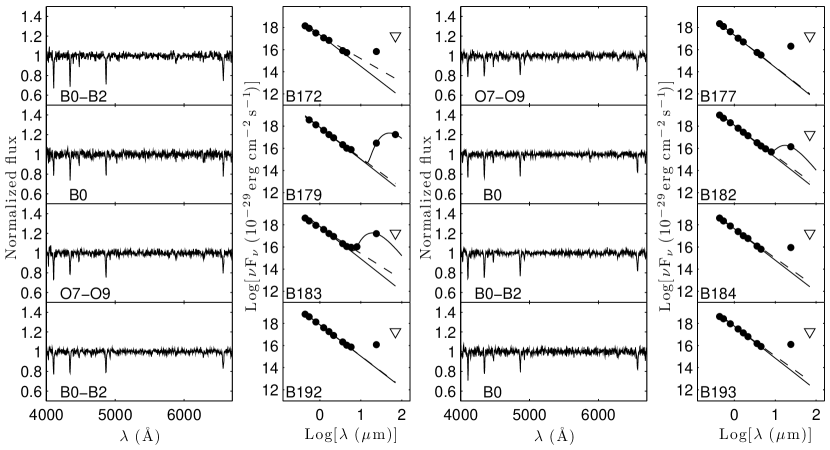
We use our long-slit spectroscopy to classify the stars. For the classification, we employ the scheme described in Evans et al. (2004), which compares the strengths of a number of lines in the 4000–5000 Å range. We use the equivalent widths of the lines, guided by visual inspection of the spectra, to compare the line strengths, but our low resolution leaves some of the important lines blended with H (Si IV 4088 Å and Si IV 4116 Å) or with each other (e.g., He I 4471 Å and Mg II 4481 Å). Note also that the original classification scheme was designed for supergiants, and so the Si lines for main-sequence stars may be too weak to detect in some cases. The classification scheme is summarized in Table 3. A sample spectrum of object B 107 is shown in Figure 2. Since B 107 shows no He II absorption features, it is not an O star. It shows no evidence of Si III 4553 Å, so it is not a B2 or B3, but the Mg II 4481 Å appears too weak for a spectral type later than B3. Thus we conclude that most likely the Si IV lines are blended with H and that the star is a B1.
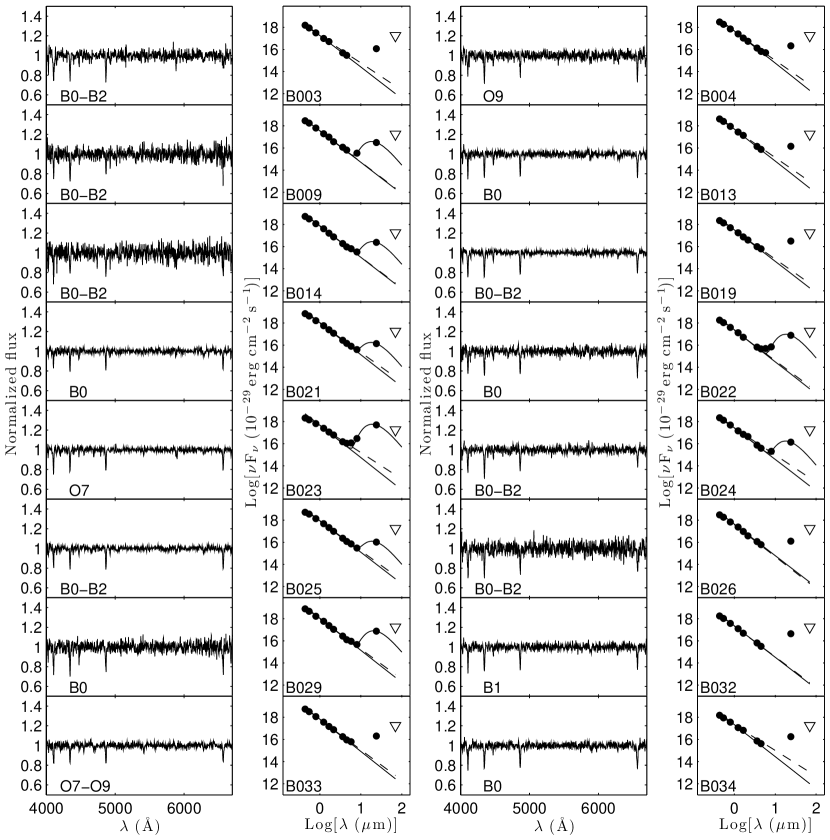
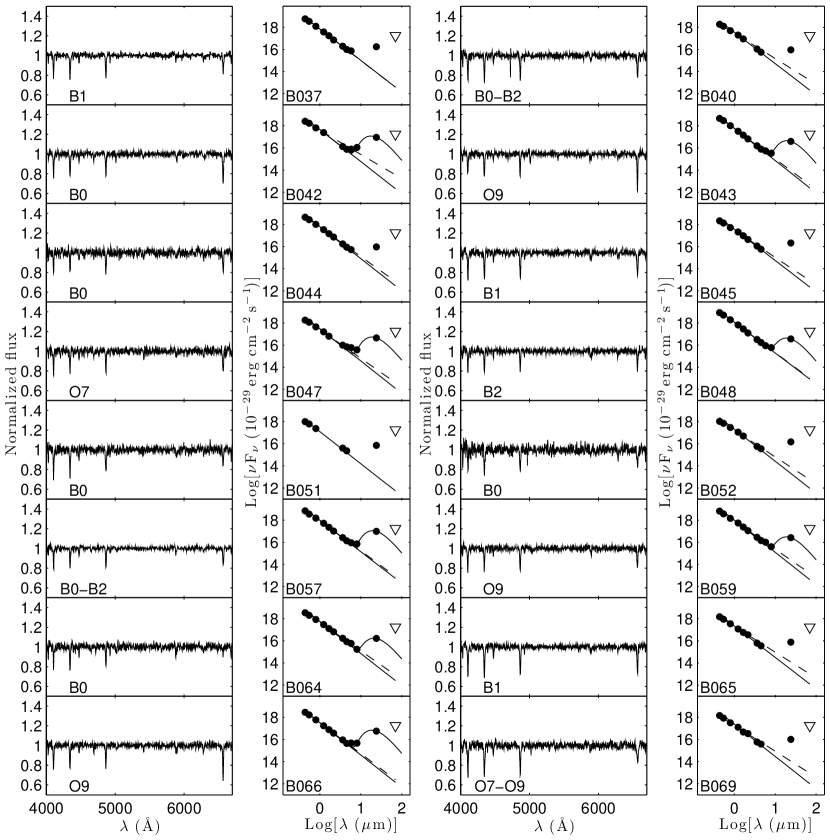
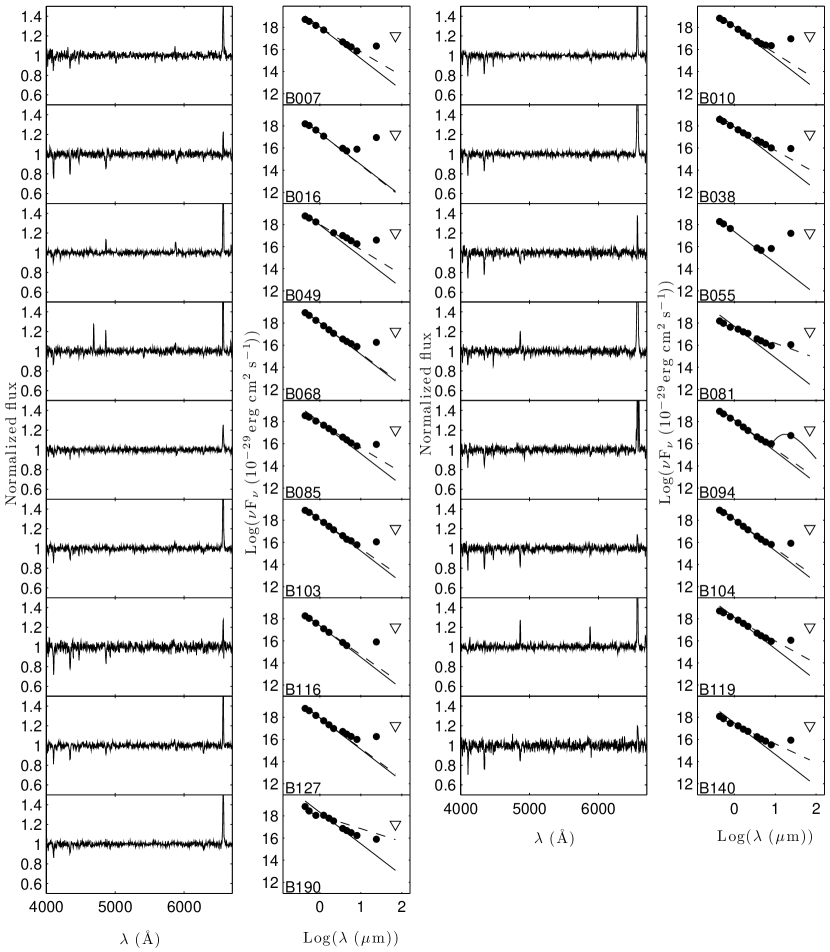
Of the 125 objects for which we obtained spectra, 87 appear to be normal main-sequence stars and one (B 167) is discussed below as a likely supergiant. Of those 87, 53 are classified via the above scheme and assigned a subtype. The remaining 34 stars were difficult to place precisely within the scheme, but they have been marked as either O7–O9, if they show He II absorption, or B0–B2 if they lack the He II lines. B 167 is unusual, however, in that it shows no significant He I absorption but has very strong Balmer absorption. It appears to be an A star; given its luminosity it is probably a supergiant. The spectra and SEDs of these 88 objects are shown in Figures 3 through 8, while the assigned spectral type is given in Table 4 as well as in the figures.
The remaining 37 of the 125 objects, which are not considered in the dust analysis in the next section, fall into one of four groups: 1) stars that show Balmer emission and sometimes He I/ II emission (16 stars plus B 094), 2) stars with unusual H profiles (7 stars, including B 035 which we especifically discuss in the following section), 3) objects that show strong forbidden line emission (6 objects), and 4) spectra that are difficult to extract (8 stars).
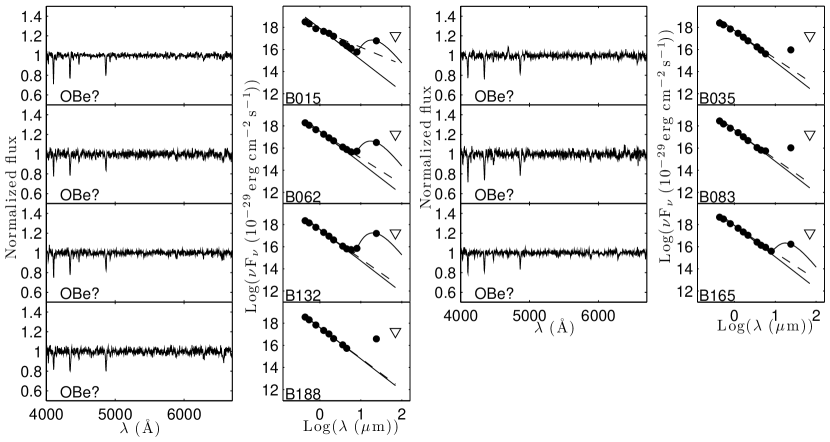
The first group of 17 stars shows the Balmer and He I/ii emission lines characteristic of Be stars (Figure 9), while the second group of 7 stars shows only weak H absorption (Figure 10). B 094 stands out, as it is the only object among the 17 stars that shows [N II] 6548,6583 emission. We include it here, rather than with the strong forbidden-line emission objects, because of the lack of [O III] emission and the weakness of the Balmer emission compared to the other objects in that group. The unusually weak Balmer absorption in the second group of stars may indicate that these objects are Be stars as well. Silaj et al. (2010) modeled the H profiles of Be stars and showed that, for many combinations of base-disk density, density distribution, and viewing angle, the H emission from the circumstellar matter does not cancel out the absorption line of the star completely. This effect could explain the unusual H profiles. The definite Be stars are noted with a spectral type of OBe in Table 4, while stars with possible weak emission are noted as “OBe?” in the table.
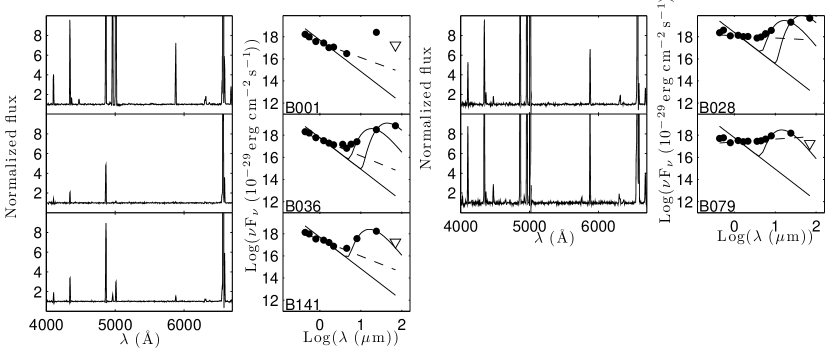
The third group is comprised of 6 objects (5 shown in Figure 11, plus the already discussed B 094), and it includes B 001, B 028, and B 079, all of which show strong Balmer and [O III] 4959,5007 emission, along with weaker [N II] 6548,6583 and He II 5876,4921, and 4471 Å emission. These spectra are typical of compact H II regions. B 141 is dominated by Balmer emission, with weak [N II] and very weak He I emission. B 141 also shows moderate [O III] emission, but unlike B 001, B 028, and B 079, the forbidden-line emission is weak relative to H. B 036 is now known to be a young stellar object (YSO) (Oliveira et al., 2013); it shows strong Balmer emission, with weak [N II] emission, very weak [O III] emission, and little to no He I emission above the continuum level. The SEDs of these five sources are much flatter than those of the non-emission-line objects, possibly due to the predominance of the free–free emission over any stellar photospheric emission. These objects are marked in Table 4 as Em in the spectral type column.
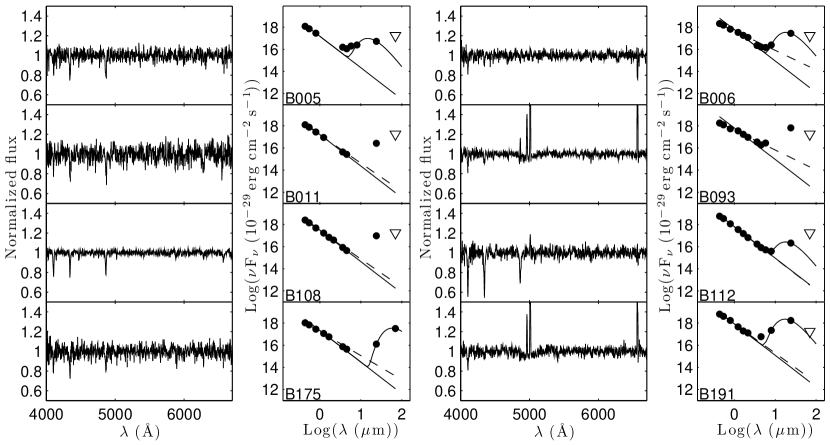
The fourth group, shown in Figure 12, includes B 005, B 011, B 112, and B 175, all of which have low signal-to-noise spectra and, except for B 011, also have a star too nearby to set the background well. Thus it is unclear whether the H absorption appears weak because of noise, background contamination, or weak Be star emission. The other 4 objects in this group are B 006, B 093, B 108, and B 191, whose complicated background in H makes it difficult to disentangle emission from the surrounding nebula from possible Be star emission. These objects are given no spectral type in Table 4.
3.1. A newly discovered O6 Iaf star
In the “OBe?” group, B 035 is the only star that shows He II 4686 Å emission. The spectrum is displayed in more detail in Figure 13. The appearance of the He II 4686 Å emission indicates a very high luminosity, class Ia (Sota et al., 2011). This is commonly accompanied by emission of the N III 4640 Å complex, but this is weak in the spectrum of B 035. We suggest that this is a metallicity effect due to the low nitrogen abundance in the SMC (van Loon et al., 2010). It does appear to be present, hence we tentatively affix the “f” suffix to the spectral type. With regard to the temperature class, the He I 4471 Å/He II 4200 Å ratio suggests a spectral type of about O6 (Sota et al., 2011). The He I+ii 4026 Å line is weaker than that of the He II 4200 Å line, which would suggest a spectral type O4, but it is also weaker than that of the He I 4471 Å line, which would suggest a spectral type O7 (which does not really happen, Sota et al. 2011) – we attribute this to uncertainties and/or possible binarity and arrive at a final spectral classification of O6 Iaf.
3.2. Comparison with literature
Accurate spectral classification based on high quality data was carried out by Evans et al. (2006), Martayan et al. (2007), Evans & Howarth (2008) and Hunter et al. (2008) for 23 of our 125 stars (see Table 4). Our own spectral classifications are in agreement with those determinations, with only a few deviations by one or two subclasses. The majority () of those classifications are of luminosity class IV–V, with only 6 of luminosity class II and none more luminous. This suggests that most of the stars in our sample are unevolved, main-sequence stars.
The sample, however, is a mixed bag of curious and seemingly very common types of objects. The “Em” objects include the planetary nebulae B 001 = LHA 115-N 9 and B 079 = LHA 115-N 47, the YSO B 036 (Oliveira et al., 2013), and the compact H II region B 028 = LHA 115-N 26 (Testor, 2001). The sample further includes the X-ray binaries B 064 = SXP 214 (Coe et al., 2011) and B 085 = CXOU J005245.0722844 (Antoniou et al., 2009) and no less than 10 or 11 eclipsing binaries. We attribute the large number of eclipsing binaries to the high overall fraction of close binary systems among massive stars (Sana et al., 2012; Sana et al., 2013).
4. Constraining the Dust Properties
In order to assess the viability of the various hypotheses for the nature of the dusty OB stars and the origin of the dust, we now use the available photometry to estimate the gross properties of the dust. The primary quantities we can constrain are the dust temperature, dust mass, the fraction of the star’s light re-radiated by the dust (FIR/FBol), and the distance of the dust from the star. We also calculate the grain size below which radiation pressure will quickly remove the dust from the system in the absence of gas drag, as well as the mass of grains of that blow-out size that would be needed to account for the observed FIR/FBol.
To determine these properties, we first find the amount of expected flux from the stellar photosphere by fitting to the SED a power law of the form
| (1) |
with in Hz and in µm, and with the slope derived from the Kurucz stellar atmosphere model (Castelli & Kurucz, 2003) of the spectral type determined. The intercept was determined using the -band flux, or if was unavailable, to scale the models. The and fluxes were corrected for the line-of-sight extinction due to the Milky Way using and from Draine & Lee (1984) and Rieke & Lebofsky (1985), with mag (Schlegel et al., 1998). We selected models for , closest among the Kurucz library to the typical abundance of young stars and gas in the SMC of (Pagel et al., 1978), and the suggested surface temperatures and surface gravities for specific stellar types from Martins et al. (2005) and Schmidt-Kaler (Aller et al., 1982). All the fits used models with for the surface gravity, and the surface temperature and slope used for each spectral type is given in Table 3. The temperature scale is similar – well within 10% – to that of Galactic main-sequence stars determined by Nieva (2013) and that of O-type stars in the SMC determined by Massey et al. (2005); the latter found that early-O type stars in the SMC are hotter than Galactic stars of the same spectral type, but that this difference vanishes around B0. A slope was used if the star was given a spectral type of “O7–O9”, while a slope was used for all other stars without a specific spectral type. From these fits, the excesses at 4.5, 8, and 24 µm were calculated (Table 5), along with the ratio of the excess to the expected photosphere.
4.1. Dust Temperature
In all but six cases, marked with a footnote in Table 5, no emission was detected at 70 µm, so we cannot fit a model to the 8, 24, and 70-µm excesses directly. Instead we estimate the color temperature of the dust using the 8- and 24-µm excesses, and place limits on the color temperature using the 24 µm flux and the 70 µm flux limit of 40,000 Jy, minus the expected photospheric flux. The color temperatures are estimated assuming a modified blackbody with emissivity , using the equation
| (2) |
where is the shorter wavelength and the longer. The color temperatures calculated for the ratios of the 8- to 24-µm excesses, for stars with a specific spectral type, are given in Table 6. Because the 8-µm band includes a major polycyclic aromatic hydrocarbon (PAH) feature, these color temperatures must be treated with caution. Note, however, that PAH emission in the SMC is considerably weaker than in the Milky Way making this less of a problem than for local samples (Sandstrom et al., 2010). The color temperatures calculated with the 24- to 70-µm ratios are very uncertain, since in most cases we have only an upper limit on the 70-µm flux, and thus are not included in the table. These values are generally in the range of 40–60 K, but they should be considered as lower limits as a 70-µm flux below the upper limit would lead to a higher derived temperature. Mid-IR spectroscopy and deeper 70-m photometry to determine the dust temperature directly are presented in Paper II.
4.2. Dust Mass
We are working in the optically thin limit at long wavelengths, so the emission of the dust is given by
| (3) |
where is the excess emission at 24 µm, is the solid angle subtended by the source, is the opacity due to the dust, and is the emission of a blackbody at the temperature of the dust. The opacity of the dust is
| (4) |
where is the mass of the dust, is the area covered by the dust, and is the dust mass absorption coefficient. Thus the dust mass is given by
| (5) |
Here we assume
| (6) |
where has units of cm2 g-1 and is given in µm. This value is due to Hildebrand (1983) and within 20% of Draine & Lee (1984). We adopt it to be easily comparable to surveys of the Milky Way (for example, the Gould Belt Survey; André et al., 2010). The dust mass then is
| (7) |
where is given in mJy, in pc, in µm, and in erg cm-2 s-1 Hz-1 sr-1. The dust masses calculated using temperatures the derived from 8/24-µm excess ratios are listed in Table 6.
4.3. Dust Luminosity
To calculate the fractional luminosity FIR/FBol, we first determined the infrared flux by integrating over the source function for graybody emission from 0.7 m to 100 m, rewriting Eq. 3 above as
| (8) |
where is in M⊕, is the distance to the source in pc, in µm, and in erg cm-2 s-1 Hz-1. We then divided by the bolometric flux, which is the luminosity for the spectral type (Table 3), scaled to the distance of the SMC.
4.4. Distance of the Dust from the Star
The observed dust temperature and stellar luminosity constrain the location of the dust in the circumstellar environment. The distance of the dust from the star at a given temperature also depends on the size of the dust grains and the wavelength range of the light being absorbed. We can set limits on the dust distance by first assuming the relation for large, blackbody grains,
| (9) |
where is the stellar radius in units of R⊙ and is the dust distance in au. The stellar radii for the stars are given in Table 3 and are taken from a second-order polynomial fit in to the values given in Appendix E of Ostlie & Carroll (1996). The distances calculated with this model are given in Table 6 as the blackbody (BB) distance. Grains that instead absorb light as blackbodies, but re-radiate as a modified blackbody proportional to , can be modeled using the equation
| (10) |
where is in L⊙, is in au, and is in µm. This equation is taken from Equation 2 of Backman & Paresce (1993), assuming and . We have assumed µm. Note that this last parameter is poorly constrained and it introduces significant uncertainty in . The distances calculated with this model are listed in Table 6. Smith & Wyatt (2010) note that in resolved debris disks, the actual distances of the particles are at most 3 times the distance predicted by the blackbody grain model, whereas in resolved cirrus hot-spots, the dust distance is an order of magnitude – or more – larger than that expected from the blackbody model, due to stochastic heating of small grains (Kalas et al., 2002).
We also estimate the blow-out size for grains due to radiation pressure in the absence of gas drag. Grains with will be blown out of the system by radiation pressure. We use the equation for from Burns et al. (1979),
| (11) |
where is the size of the grain, is the density of the grain, and is the average radiation pressure efficiency over the stellar spectrum for a given grain size. Values for for the spectral types are given in Table 3 and were derived using
| (12) |
where K from Schmidt-Kaler (Allen, 1973). Values for were derived by fitting a second-order polynomial in in logarithmic space to the values in Appendix E of Ostlie & Carroll (1996) and are also given in Table 3. We assume here , and we use g cm-3 from the Draine & Lee (1984) model. Setting gives the minimum grain size in a circular orbit that can survive the radiation pressure of the host star. Grains released from parent bodies in circular orbits, such as dust created in a debris disk, however, can be ejected from the system for as low as 0.5.
We then estimate the mass of dust needed to produce the observed FIR/FBol, based on the estimated blow-out size of the grains. This mass (in units of g) is given by
| (13) |
where is the minimum grain size to survive radiation pressure blow-out, in cm, and is the blackbody distance in cm.
4.5. Uncertainties
We estimate the uncertainty on these parameters for the 8/24 pair of excesses using the Monte Carlo method. For each of 1000 trials per object, the color temperature is calculated, and that temperature is used in the calculation of the dust mass, FIR/FBol, and dust distance. The uncertainties on the color temperature, dust mass, FIR/FBol, and dust distance are then set according to the upper and lower values that bracket the central 67% of the results for each object. Uncertainties on the excess at 8 and 24 µm are determined via error propagation, assuming an uncertainty in slope of 0.05 for B stars and 0.01 for O stars. These ranges allow for uncertainty in the spectral type. Because the O stars all have a similar slope, the range is much smaller. We apply these uncertainties to the excesses assuming a normal distribution about the value of the excess before calculating the color temperature. The dust mass calculation also includes an uncertainty in the distance to the stars, which we model as a normal distribution centered at kpc, assuming that the objects are most likely to be located near the center of the SMC. The FIR/FBol calculation further requires the uncertainty on the bolometric luminosity, assumed to be a uniform distribution with a range set by the value for spectral sub-type. For the distance calculation, we assume uncertainties for the stellar radius and stellar temperature uniformly distributed between the values for spectral sub-type. Table 6 gives the dust parameters for those objects in Table 5 that have a measurable excess at 8 m, and to which we give a secure main sequence spectral classification.
5. Discussion
5.1. Classical Be Stars
Because the majority of our sample shows no optical emission lines, Be star activity is likely not the main cause of the 24-µm excess in these O and B stars. It is possible, however, that a few of the objects without emission lines could still be Be stars, as Be stars are known to show variability in their Balmer emission. In a study of 45 Milky Way Be stars, McSwain et al. (2009) found 23 objects with variable H emission, including six that changed from strong emission to normal B-star absorption at H or vice versa over the course of just two years. Of the original sample of 193 O and B stars with 24-µm excess identified in the S3MC survey, 12 were previously catalogued as Be stars by Meyssonnier & Azzopardi (1993), and for those we did not acquire new spectra. We identify here an additional 16 stars with confirmed H emission and 7 stars with suspected weak H emission, for a total of 35 Be stars (36 if we include B 097 in the count). The remaining 88 stars in the spectroscopic sample do not display evidence of OBe activity.
To investigate the possibility of variability between the two states, we look at the 4.5-µm excesses, seen in Table 5, because Be stars, both classical and Herbig Ae/Be, are expected to show near-IR emission to some degree (see, e.g., Touhami et al., 2010). Indeed, we do see an excess ratio above the photospheric emission at 4.5 µm for 11 of the 16 OBe stars in our spectroscopic sample, as well as in 2 of the 7 “OBe?” stars. This could indicate that the other 10 OBe and “OBe?” stars were in a normal B-star phase during the IRAC observations, acquired in 2005 May. These excesses, however, are weak, at less than 4 times the expected photospheric flux, suggesting that we may just be unable to detect the excesses in our remaining spectroscopically confirmed OBe stars because of the uncertainties () in their photospheric flux in our data. Adding further uncertainty is our use of band data to scale the photosphere, because Be stars may exhibit excesses even at wavelengths as short as 1.2 µm. This can be seen in the slopes of the dashed lines in the SEDs of B 038, B 081, B 085, B 119, B 140, and B 190, for example, in Figures 9 and 10. The dashed lines are fit to and show shallower slopes than expected for the photospheric emission.
We also find 12 stars (B 023, B 033, B 047, B 115, B 128, B 135, B 136, B 142, B 154, B 156, B 160, and B 183) in Table 5 that do not show optical emission lines (see Table 4) but do have an excess ratio at 4.5 µm significant at the level. The 4.5-µm excesses are also weak, with only B 136 showing an excess/photospheric ratio greater than 1. This excess could indicate that these stars were in a Be state at the time of the IRAC photometry but settled into a normal B-star state by the time the spectra were acquired. If we assume that all of the 4.5-µm excesses are due to Be-star behavior, the fraction of transient Be-stars (counting as transient those OBe and “OBe?” optically classified stars without 4.5 µm excess, plus these 12 stars with 4.5 µm excess but no hint of H emission in their spectra) is 22/47, or about 47% of the total Be-star population in the sample. This is on par with the fraction seen in the study of Galactic Be-stars by McSwain et al. (2009). Therefore it seems unlikely that the remainder of our stars that show no Be activity in the photometry and spectra are primarily dormant Be-stars.
5.2. Herbig Ae/Be Stars
Because we do not know the ages of the Be stars in our sample, it is difficult to determine to which of the Be-star categories they belong. None of the Be stars we identified spectroscopically have the large excesses at µm that are typical of the hot dust in Herbig Ae/Be objects. Hillenbrand et al. (1992), however, identify in the Galaxy a set of objects with near-IR profiles that resemble classical Be stars, but are apparently young stars, located near reflection nebulosity. This location is more typical of Herbig Ae/Be stars. Hillenbrand et al. (1993) suggest that these objects, which they label Group III, are actually Herbig Ae/Be stars that have an optically thin circumstellar disk, rather than the optically thick disk more typical of the Herbig Ae/Be class.
The weak 4.5-µm excesses of the Be stars detected in our spectroscopic study resemble the near-IR profiles of classical Be stars as well as these Group III objects. The stars in our sample are located within regions of recent star formation, suggesting an age of Myr. Unfortunately, 10 Myr is the approximate age at which classical Be stars begin to appear in clusters (Fabregat & Torrejón, 2000), and so we cannot be certain whether these objects are young stars or older, established main-sequence stars without more accurate age determinations. The bulk of the dusty B-star sample, with neither optical emission lines nor a near-IR excess, are unlikely to be Herbig Ae/Be stars.
5.3. Cirrus Hot-Spots Comparison
Backman & Paresce (1993) note that to be certain that debris disks are the source of the excess infrared emission, spatially resolved observations of the disk are needed, because hot spots in the ISM can mimic the color temperatures and fractional luminosities of debris disks. The morphology of the dust is the best clue as to whether the heated dust is physically associated with the star in a disk, or if it is simply a concentration of ISM material close to the star. Unfortunately, at the distance of the SMC, debris disks cannot be resolved with any available facilities, and ISM hot spots are below the resolution of the Spitzer data, especially with a 6″ resolution at 24 µm.
Since we lack resolved images of the dust emission, we instead compare the dust properties of the SMC sample to the Galactic cirrus hot-spot sample of Gaustad & van Buren (1993). A broader comparison using WISE data is carried out in Paper II. The Gaustad & van Buren (1993) sample was selected by looking for IRAS excesses at 60 µm with color temperatures above the K temperature of the general Galactic cirrus and peaking at the location of a star, with to exclude H II regions, and spatially extended emission that is more extended in longer wavelengths, indicating that the temperature declines with distance from the star. We note that in cases where the reported IRAS 25-µm flux is negative, the color temperatures cannot be calculated.
Whether this cirrus hot-spot sample in fact consists solely of cirrus hot-spots is, however, uncertain. Gaustad & van Buren (1993) found that in some cases, the hot spots have 12-µm emission that is brighter than the 25-µm emission, indicating a hotter dust component than the expected K temperature of illuminated cirrus. Indeed, the color temperatures we find for the hot-spot sample from the 12/25 flux-ratios are all above 100 K. Furthermore, Kalas et al. (2002) used resolved optical images of nebulosity around three B stars that appear in both the Gaustad & van Buren (1993) and Backman & Paresce (1993) samples to model the IR emission from the objects. The authors concluded that, in all three cases, the ISM model cannot explain the 12- and 25-µm emission, requiring a source of warmer dust. The coronograph used to block the starlight for their optical images unfortunately obscures the central 100–1000 au around the star, where a circumstellar disk would be located. The warmer dust could therefore be provided by a population of either blackbody grains in a close-in circumstellar disk, or very small grains at larger distances that are heated stochastically to higher temperatures than equilibrium. In cases where the stellar velocity is large compared to the local ISM (such as runaway stars), a bow-shock could further heat the dust in addition to stellar irradiation. Distinguishing between these scenarios would require imaging at higher resolution, which we discuss further in Paper II. The 12-µm IRAS band also contains a PAH emission feature, offering another possible explanation for the excess flux at that wavelength. Illustrating the difficulty of distinguishing disks from hot-spots using SED information alone, even for nearby objects, Kalas et al. (2002) note that 31 of the 34 B-type stars in the Backman & Paresce (1993) table of debris disk candidates or Vega-like stars, appear in the Gaustad & van Buren (1993) cirrus hot-spot list.
The full hot-spot sample contains stars of spectral types O6 through B9 of all luminosity classes, but we exclude from the comparison any objects marked in the Gaustad & van Buren (1993) table as emission line stars or stars of luminosity class higher than V, to match the characteristics of the SMC dusty OB stars. We further limit the hot-spot sample to those objects that have excesses, if scaled to the SMC distance of 61.1 kpc, that we could detect at the 5- level or better at 24 µm in the S3MC survey (215 Jy; Bolatto et al. 2007). This sub-sample contains 18 stars. We then calculated the dust parameters for this sub-set of the sample, using the 12/25-µm combination in place of 8/24-µm, and these values are listed in Table 7. Stars flagged in Table 7 as “known reflection nebula” are noted in Gaustad & van Buren (1993) to have extended emission that is brighter in the blue than in the red on the Palomar Sky Survey or ESO Sky Survey plates.
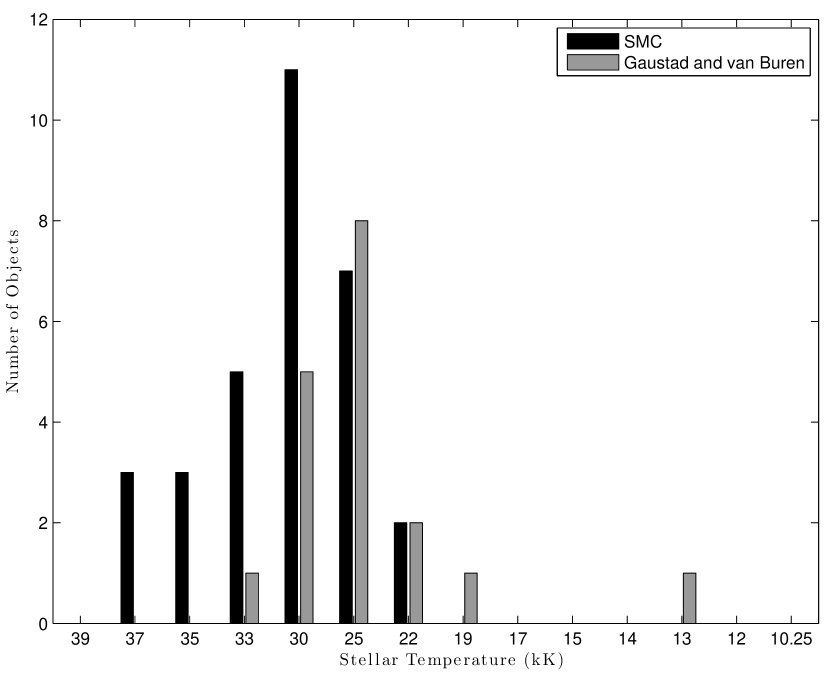
The comparison SMC sample contains a total of 31 stars (c.f., Table 6), and it is constituted by normal main sequence stars (no OBe, “OBe?,” or Em classification) that have a measurable 8 µm emission excess, in order to determine the temperature of the dust. While the distributions in both samples over spectral types peak at a similar type – B0 in the SMC vs. B1 in the hot-spot sub-sample – the SMC sample extends more towards earlier types while the hot-spot sub-sample extends towards later types. This is reflected in the distributions over stellar effective temperature, shown in Figure 14.
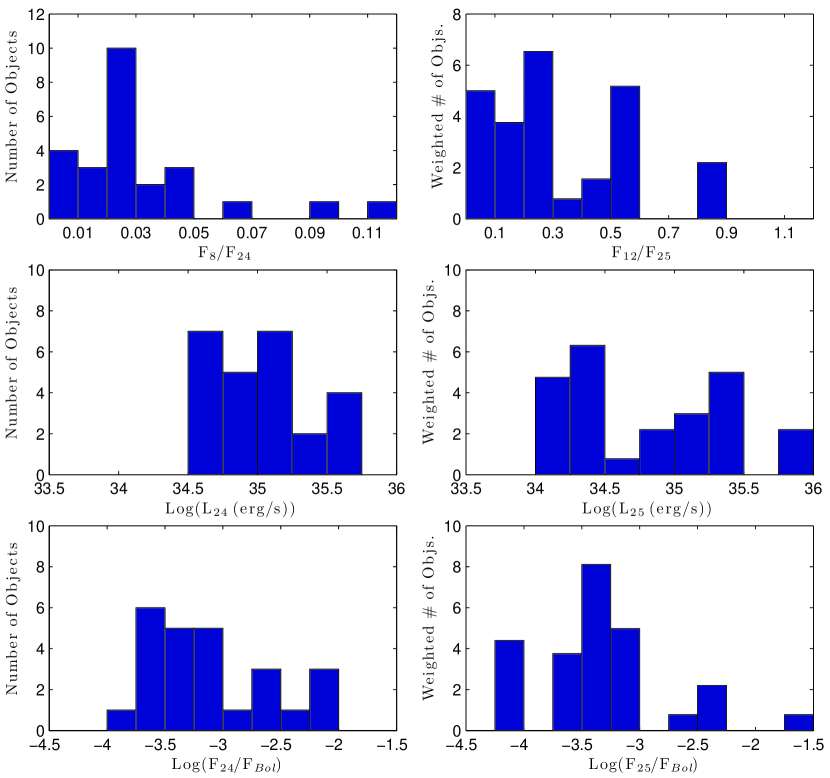
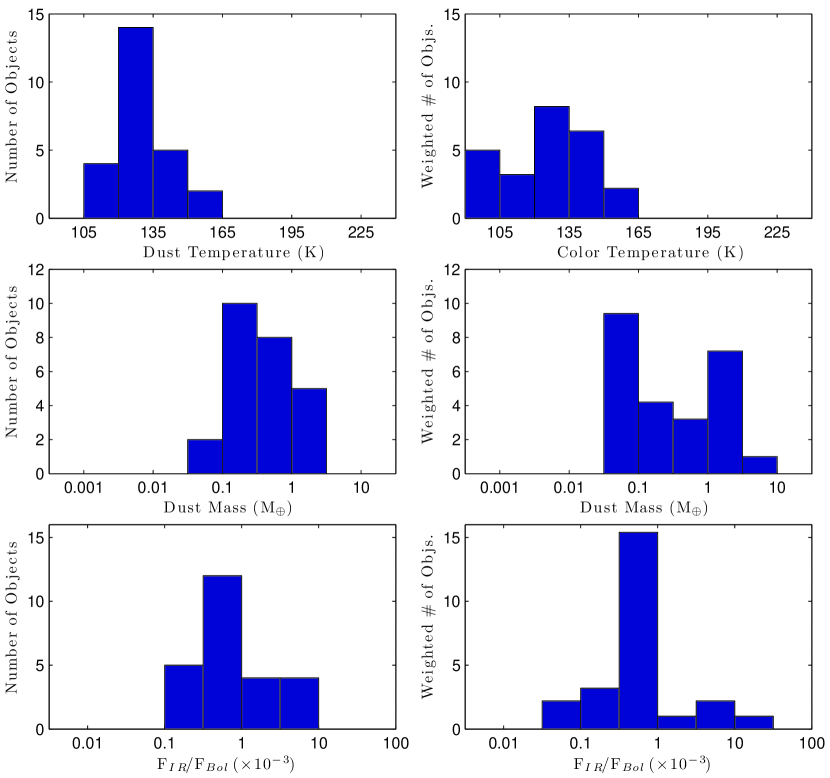
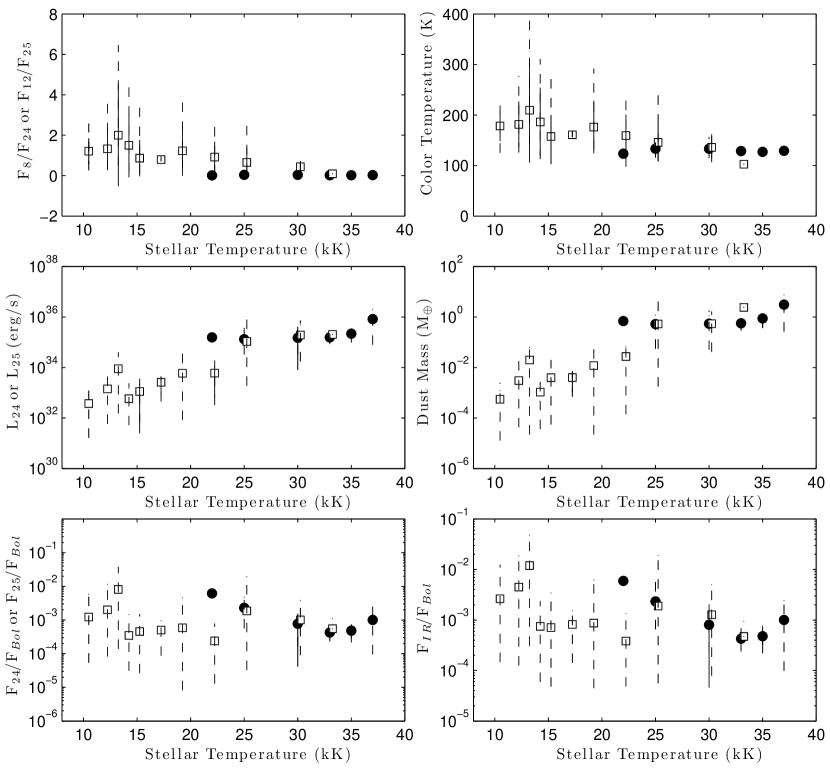
In Figure 15 we show histograms of the observable parameters, F8/F24 or F12/F25, L24 or L25, and /FBol or /FBol. The IR luminosities and fractional IR luminosities are similar; the difference in the IR ratio is largely driven by the use of the 8- vs. 12-µm bands. In Figure 16 we show histograms of the color temperature, mass, and fractional luminosity, where the samples are restricted to spectral types O9–B2, since both samples have at least one star of each of these spectral types. The histograms for the hot spots in Figures 15 and 16 are created by weighting the number of objects in that sample so that the total number of hot spots in a spectral type bin equals the total number of objects in the bin for the SMC sample. In this manner the weighting controls for the different spectral makeup of the two samples. Figure 17 shows the averages of each of the observable parameters and associated dust parameters against stellar temperature, without the restrictions on visibility at the SMC distance that are used in the histograms.
The distributions over dust temperature are very similar for both samples. they both have similar mean temperatures in the 125–130 K range, although the hot-spot sample also displays a broader range in dust temperatures, 97–226 K compared to 116–164 K for the SMC sample. The hottest color temperatures in the hot-spot sample in Figure 15 result from the coolest and most predominant spectral type, B2. The trend toward higher color temperatures in the hot-spot sample is possibly due to PAH contamination. The 12-µm PAH emission feature remains relatively unchanged over a broad range of radiation field intensities, but the thermal emission at 25 µm changes dramatically (e.g., Figure 13 in Draine & Li 2007). Thus PAHs around cooler stars would create higher color temperatures than around hotter stars; F12/F25 would be artificially high as a result of similar amounts of PAH emission at 12 µm but reduced thermal emission at 25 µm. This is likely a lesser effect in the SMC, where PAH emission is weak (e.g. Sandstrom et al., 2010).
The distributions over dust mass are also similar for both samples, though again the distribution appears broader (both towards higher and lower dust masses) in the hot-spot sample. The SMC sample may be devoid of examples of lower dust mass as these would not have been detected. The average mass at B0 and B1, where there is the greatest number of objects in both samples, is similar for each sample (Fig. 17), but the average dust mass in the SMC sample is higher at B2, and lower for O7–O9, compared to the cirrus hot-spots. We see a trend in the hot-spots of lower dust mass for cooler stars, which is reasonable given that a hotter, more massive star could illuminate larger regions of the ISM. We do not see this dependence on the stellar temperature for the SMC objects, although the smaller temperature range of the SMC sample would make such a trend perhaps difficult to detect.
At first glance, the distributions over do also appear similar between the two samples. On closer inspection, the one for the hot-spots is clearly broader. The average for the hot-spot sample is smaller than that of the SMC, which is , although this is somewhat misleading as the averages are skewed by the extremes in the sample. The derived for both samples do fall within the typical to range of debris disks (Chen et al., 2006).
While we noted minor differences in the distributions over dust temperature, dust mass and between the SMC and hot-spots samples, these can be explained by a combination of small-number statistics, selection bias, and the opposite sense of skewedness of the distributions over spectral type. Indeed, Figure 17 shows that the trends – or absence thereof – and mean values are consistent between both samples if the breakdown over spectral types is taken into account.
Interestingly, despite the low dust-to-gas ratio in the SMC (about that of the Milky Way; Leroy et al., 2007), the SMC objects show dust masses similar to the Galactic hot-spots if common selection thresholds are applied. This suggests that, if they are hot-spots, the mass of gas being illuminated is times larger in the SMC than in the Milky Way. Assuming similar gas densities, this suggests that the typical sizes of hot-spots would be larger in the SMC than in the Milky Way.
5.4. Bow-shocks and Runaway Stars
Larger dust masses, warmer dust and thus brighter emission may arise from bow-shocks ahead of runaway stars, or stars being over-run by expanding interstellar bubbles. Stars with stronger stellar winds – i.e., of earlier type and/or at later evolutionary stages – and/or larger relative velocity with respect to the local ISM sweep up more mass; larger relative velocities also result in stronger shocks and hence greater heating. Gvaramadze et al. (2011) present a sample of 12 candidate runaway stars with bowshocks in the SMC. Curiously, there is no overlap whatsoever between their sample and ours.
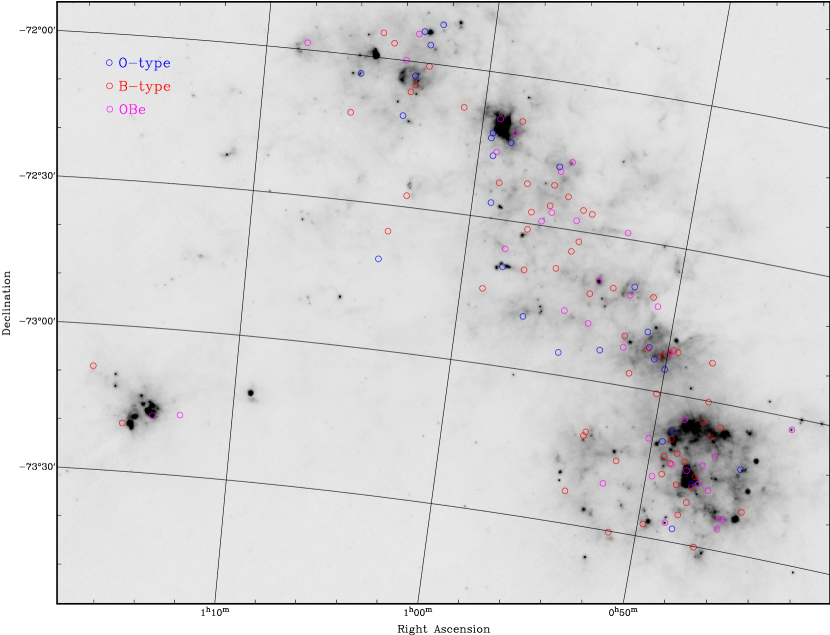
The distribution of our sample on the sky (Figure 18) seems to indicate that at least a portion of them are found outside of sites of vigorous star formation. While the late-B stars may be old enough to have migrated from their birth-sites or for their natal clouds to have dispersed, the fact that some of the O-type stars are also found outside star-forming regions suggests they may be runaways. One of our “normal” OB stars, B 064 is in fact the primary in an X-ray binary222The other primary in an X-ray binary in our sample, B 085, is a Be star and therefore excluded here from further analysis, and it is likely that the binary system will have received a high peculiar velocity when the neutron star’s progenitor star exploded as a core-collapse supernova – see Kaper et al. (1997) for the proto-typical example of a bow-shock accompanied runaway X-ray binary, Vela X-1.
We also note that the structure of the ISM in the SMC differs in important ways from that in the Milky Way disk; the SMC is dominated by expanding bubbles (Staveley-Smith et al., 1997) while gas in the Milky Way disc is more strongly entrained and collected by the recurrence of a spiral density wave. This could affect the ubiquity and properties of bow-shocks; for instance stars in the SMC might be over-run by expanding shells (see Dawson et al., 2013, for such mechanisms operating within the Large Magellanic Cloud), resulting in large relative velocities between stars and ISM without the requirement for a “kick” velocity of the star.
While proper motions relative to the systemic motion of the SMC are too small to be measured (1 mas yr-1 300 km s-1), radial velocities can be determined with much better accuracy. Our own spectroscopy, however, has neither the spectral resolving power nor velocity calibration accuracy required for such measurements. In Table 4 we list the radial velocities measured for stars in our sample by Evans et al. (2006), Martayan et al. (2007) and Evans & Howarth (2008). We also determined the velocity of the peak in the H I emission around the location of the star in question, from inspection of the datacube produced by Stanimirović et al. (1999). This differs from the intensity-weighted velocity map produced by Stanimirović et al. (2004), because we are interested in the most likely velocity difference between a star and the densest parts of the ISM. Often, more than one strong peak is seen in the H I data; in that case we list both. Of the 21 stars with radial velocity measurements, most stellar kinematics coincide with that of a strong H I peak. B 116, B 124 (and perhaps B 119) fall in between H I peaks, suggesting they might reside in the middle of a shell expanding at –20 km s-1. But two O7 stars, B 142 and especially B 145, have large velocity differences of and 75 km s-1 with respect to the nearest (in velocity) H I peak. No uncertainties were quoted for the stellar radial velocities for these stars, but measurements for other stars from the same work (with the caveat that those were all later spectral type) often agreed with H I kinematics, which suggests typical errors not much larger than km s-1. We thus suggest that these two O7 stars may be runaways – they are located just outside of the brightest H II region in the SMC, LHA 115-N 66 containing the massive O-star cluster NGC 346, lending further support to their large space velocities.
5.5. Disks
Statistics for circumstellar disk detections around stars with spectral types as early as the SMC sample are difficult to come by. Few surveys exist of stars younger than Myr, which encompasses most, if not all, of the main-sequence lifetimes of these late-O and early-B stars, and those surveys that do sample the appropriate age range still contain very few stars of these types (see Carpenter et al., 2009, and references therein).
Our sample of 87 objects with normal O- or B-star main sequence spectra in the SMC shows excesses at 24 µm that are larger than those of typical debris disks, in studies of somewhat less massive (late-B and A-type) stars in the Milky Way. Carpenter et al. (2009) set a limit, based on the properties of their sample of B7–A9 stars, for the ratio of observed flux to expected photospheric flux at 24 µm of for debris disks (but only a ratio of for solar-type stars). Any object with a larger ratio is considered to be a primordial disk. Hernández et al. (2006) define objects with mag as Herbig Ae/Be stars, while objects below this limit are debris disks. Hernández et al. (2006) also define any object with mag as a massive debris disk. The SMC objects have observed flux to expected photospheric ratios , with only 6 objects being less than 100 and a further 7 objects being within 1 of 100. The SMC objects also have mag, with only 11 objects below the limit of 5. Of those 11, we identify 7 as OBe stars.
The studies of Hernández et al. (2006) and Carpenter et al. (2009) only consider circumstellar matter around intermediate and low mass stars, so it is possible that these dividing limits around the more massive stars in our SMC sample should be higher. Carpenter et al. (2009), however, specifically excluded earlier type stars from consideration because, aside from being few in number, they may show a severely reduced dust luminosity due to the loss of small grains to radiation pressure. We find blowout grain sizes for the SMC objects on the order of 1 mm, in the absence of gas drag (see Table 6). The smallest dust grains are the most efficient (per unit mass) at capturing and reprocessing UV and optical radiation into infrared. This suggest that, if blowout is significant, started much larger than we currently measure in our sample.
Hernández et al. (2006) suggest two scenarios to explain massive circumstellar dust disks. They could be the result of collisions between two large planetesimals, greater than 1000 km, or they could be explained as a transition phase from Herbig Ae/Be star to debris disks, in which the disk still contains a significant fraction of primordial dust. The small number of these objects detected in the SMC sample suggests that they could be in a short-lived phase, and perhaps constitute transition disks remnants from the stellar accretion. In the original S3MC sample, the 24-µm excess objects were 5% of the total number of objects that met the requirements for normal late-O and early-B stars in the specific magnitude and color cuts (Bolatto et al., 2007). Counting only the stars that have normal O- and B-star spectra, which is 87 out of the 193 objects in the original list, and also assuming that all of these objects are debris disks, rather than ISM hot spots or quiescent Be stars, gives a detection fraction of only 2.2%. Including the 45 objects for which we have no spectra to judge their emission-line star status gives a maximum of 3.4%. If the possible transition object that Hernández et al. (2006) detect is truly in this transition phase, that would give a detection fraction of 3% for transition objects in the 5 Myr cluster in which it lies. This detection fraction is consistent with that seen in the SMC sample.
Finally, it is worth noting that comparison with literature classifications shows that a significant fraction of our SMC sample consists of binaries. The effect of binary systems on the formation of circumstellar disks is unclear. One might expect the disks to be dynamically disrupted, although circumbinary planets have been recently discovered by Kepler (Doyle et al., 2011; Welsh et al., 2012; Orosz et al., 2012a, b; Schwamb et al., 2012).
6. Summary and Conclusions
We obtained long-slit spectra of 125 of the 193 dusty OB stars in the S3MC survey that show large excess emission at 24 µm. These new observations cover a significant fraction of the sample, make possible accurate sky removal in the complex regions where these stars live, and allow us to draw robust conclusions on the statistics of different contributors to the sample.
We use these spectra to classify the stars and look for the signatures of the OBe activity. We find 87 objects that lack emission lines and appear to be normal, main sequence late-O/early-B main-sequence stars. For these stars, we use our spectral classification to estimate their luminosity, and calculate the dust temperature, dust mass, FIR/FBol, and equilibrium dust distance from the host star. We discuss the spectral and photometric properties of our sample in relation to several possible scenarios: classical Be stars, massive analogs of Herbig Ae/Be stars, hot-spots in the interstellar medium (possibly with contributions of bow-shocks), and disks. The results of this study are:
-
We identify 17 stars in the dusty O and B stars sample as OBe stars because of clear H emission in their spectra (this count includes B 094, the object with forbidden nitrogen emission). A further 7 stars exhibit weaker than expected H absorption and are therefore classified as possible OBe stars – one of these is an O6 Iaf star showing He II 4686 Å emission. We also identify 12 stars that show no H emission in their spectra but do show 4.5 µm excess in the photometry that could be indicative of transient Be-star activity. If these 12 stars are dormant OBe stars, along with the 11 spectroscopically identified OBe stars that show no excess at 4.5 µm, the transient total OBe star fraction would be %. This fraction is consistent with the study of transient Be star activity by McSwain et al. (2009). Thus it seems unlikely that the remaining 75 stars, with neither 4.5 µm excesses nor H emission, are OBe stars that happened to be in normal OB star states during both the photometric and spectroscopic observations.
-
Our dusty OB stars are generally located near regions of recent star formation, similar to Herbig Ae/Be type stars, and in that respect resemble the Group III Herbig Ae/Be objects in Hillenbrand et al. (1992). Our objects have ages Myr. Note that classical Be-star activity begins to appear in clusters around Myr of age, once again suggesting that the majority of them cannot be explained by excretion disks with a dusty component.
-
The SMC sample exhibits broadly similar characteristics when compared to the cirrus hot-spot sample of Gaustad & van Buren (1993). The hot-spot sample shows trends for decreasing dust temperature and increasing dust mass for hotter stars, which the SMC sample does not. However, these differences likely arise from the different distributions over spectral type, and perhaps stronger contamination of the broadband colors by PAHs in the Milky Way. We show evidence that at least some of the stars in the SMC sample are runaways, including one X-ray binary; heating in a bow-shock could add to the radiative heating of the dust.
-
The SMC sample of objects show higher 24 µm excesses than typical debris disks around intermediate mass stars in the Milky Way. There are not enough debris disks known around comparably massive stars, however, to indicate what is typical for an early-B or late-O debris disk. Alternatively, if the stars are young, we may be observing the remnants of the accretion process — analogs to transition disks around massive stars. The detection fraction of these objects when compared to stars with similar optical colors and luminosities is 2.2%–3.5%, which is consistent with the expected short lifetime of a transition phase.
We analyze and discuss additional observations of the SMC dusty OB sample, as well as further comparison with a sample of massive stars in the Galaxy compiled using WISE photometry, in Paper II.
References
- Adams et al. (2013) Adams, J. J., Simon, J. D., Bolatto, A. D., Sloan, G. C., Sandstrom, K. M., Schmiedeke, A., van Loon, J. Th., Oliveira, J. M., & Keller, L. D. 2013, ApJsubmitted (Paper II)
- Allen (1973) Allen, C. W. 1973, London: University of London, Athlone Press
- Alexander et al. (2006) Alexander, R. D., Clarke, C. J., & Pringle, J. E. 2006, MNRAS, 369, 229
- Aller et al. (1982) Aller, L. H., et al. 1982, Landolt-Bornstein: Numerical Data and Functional Relationships in Science and Technology
- André et al. (2010) André, P., Men’shchikov, A., Bontemps, S., et al. 2010, A&A, 518, L102
- Antoniou et al. (2009) Antoniou, V., Hatzidimitriou, D., Zezas, A., & Reig, P. 2009, ApJ, 707, 1080
- Arny (1977) Arny, T. 1977, ApJ, 217, 83
- Backman & Paresce (1993) Backman, D. E., & Paresce, F. 1993, Protostars and Planets III, 1253
- Bolatto et al. (2007) Bolatto, A. D., et al. 2007, ApJ, 655, 212
- Bonanos et al. (2010) Bonanos, A. Z., et al. 2010, AJ, 140, 416
- Burns et al. (1979) Burns, J. A., Lamy, P. L., & Soter, S. 1979, Icarus, 40, 1
- Carpenter et al. (2009) Carpenter, J. M., Mamajek, E. E., Hillenbrand, L. A., & Meyer, M. R. 2009, ApJ, 705, 1646
- Castelli & Kurucz (2003) Castelli, F., & Kurucz, R. L. 2003, Modelling of Stellar Atmospheres, 210, 20P
- Cesaroni et al. (2007) Cesaroni, R., Galli, D., Lodato, G., Walmsley, C. M., & Zhang, Q. 2007, Protostars and Planets V, 197
- Chen et al. (2006) Chen, C. H., et al. 2006, ApJS, 166, 351
- Cieza et al. (2010) Cieza, L. A., Schreiber, M. R., Romero, G. A., et al. 2010, ApJ, 712, 925
- Coe et al. (2011) Coe, M. J., et al. 2011, MNRAS, 414, 3281
- Dawson et al. (2013) Dawson, J. R., McClure-Griffiths, N. M., Wong, T., Dickey, J. M., Hughes, A., Fukui, Y., & Kawamura, A. 2013, ApJ, 763, 56
- Dekker et al. (1986) Dekker, H., Delabre, B., & Dodorico, S. 1986, Proc. SPIE, 627, 339
- Doyle et al. (2011) Doyle, L. R., Carter, J. A., Fabrycky, D. C., et al. 2011, Science, 333, 1602
- Draine & Lee (1984) Draine, B. T., & Lee, H. M. 1984, ApJ, 285, 89
- Draine & Li (2007) Draine, B. T., & Li, A. 2007, ApJ, 657, 810
- Evans et al. (2004) Evans, C. J., Howarth, I. D., Irwin, M. J., Burnley, A. W., & Harries, T. J. 2004, MNRAS, 353, 601
- Evans et al. (2006) Evans, C. J., Lennon, D. J., Smartt, S. J., & Trundle, C. 2006, A&A, 456, 623
- Evans & Howarth (2008) Evans, C. J., & Howarth, I. D. 2008, MNRAS, 386, 826
- Fabregat & Torrejón (2000) Fabregat, J., & Torrejón, J. M. 2000, A&A, 357, 451
- Fazio et al. (2004) Fazio, G. G., et al. 2004, ApJS, 154, 10
- Flower (1996) Flower, P. J. 1996, ApJ, 469, 355
- Gaustad & van Buren (1993) Gaustad, J. E., & van Buren, D. 1993, PASP, 105, 1127
- Gordon et al. (2011) Gordon, K. D., et al. 2011, AJ, 142, 102
- Gvaramadze et al. (2011) Gvaramadze, V. V., Pflamm-Altenburg, J., & Kroupa, P. 2011, A&A, 525A, 17
- Herbig & Simon (2001) Herbig, G. H., & Simon, T. 2001, AJ, 121, 3138
- Hernández et al. (2006) Hernández, J., Briceño, C., Calvet, N., Hartmann, L., Muzerolle, J., & Quintero, A. 2006, ApJ, 652, 472
- Hildebrand (1983) Hildebrand, R. H. 1983, QJRAS, 24, 267
- Hillenbrand et al. (1993) Hillenbrand, L. A., Massey, P., Strom, S. E., & Merrill, K. M. 1993, AJ, 106, 1906
- Hillenbrand et al. (1992) Hillenbrand, L. A., Strom, S. E., Vrba, F. J., & Keene, J. 1992, ApJ, 397, 613
- Hunter et al. (2008) Hunter, I., Lennon, D. J., Dufton, P. L., Trundle, C., Simón-Díaz, S., Smartt, S. J., Ryans, R. S. I., & Evans, C. J. 2008, A&A, 479, 541
- Ita et al. (2010) Ita, Y., et al. 2010, PASJ, 62, 273
- Kalas et al. (2002) Kalas, P., Graham, J. R., Beckwith, S. V. W., Jewitt, D. C., & Lloyd, J. P. 2002, ApJ, 567, 999
- Kaper et al. (1997) Kaper, L., van Loon, J. Th., Augusteijn, T., Goudfrooij, P., Patat, F., Waters, L. B. F. M., & Zijlstra, A. A. 1997, ApJ, 475, L37
- Keller & Wood (2006) Keller, S. C., & Wood, P. R. 2006, ApJ, 642, 834
- Krivov (2010) Krivov, A. V. 2010, Research in Astronomy and Astrophysics, 10, 383
- Leroy et al. (2007) Leroy, A., Bolatto, A., Stanimirović, S., Mizuno, N., Israel, F., & Bot, C. 2007, ApJ, 658, 1027
- Martayan et al. (2007) Martayan, C., Frémat, Y., Hubert, A.-M., Floquet, M., Zorec, J., & Neiner, C. 2007, A&A, 462, 683
- Martínez-Galarza et al. (2009) Martínez-Galarza, J. R., Kamp, I., Su, K. Y. L., Gáspár, A., Rieke, G., & Mamajek, E. E. 2009, ApJ, 694, 165
- Martins et al. (2005) Martins, F., Schaerer, D., & Hillier, D. J. 2005, A&A, 436, 1049
- Massey et al. (2005) Massey, P., Puls, J., Pauldrach, A. W. A., Bresolin, F., Kudritzki, R. P., & Snow, T. 2005, ApJ, 627, 477
- McSwain et al. (2009) McSwain, M. V., Huang, W., & Gies, D. R. 2009, ApJ, 700, 1216
- Meyssonnier & Azzopardi (1993) Meyssonnier, N., & Azzopardi, M. 1993, A&AS, 102, 451
- Miroshnichenko & Bjorkman (2000) Miroshnichenko, A. S., & Bjorkman, K. S. 2000, IAU Colloq. 175: The Be Phenomenon in Early-Type Stars, 214, 484
- Nieva (2013) Nieva, M. F. 2013, A&A, 550, A26
- Oliveira et al. (2013) Oliveira, J. M., et al. 2013, MNRAS, 428, 3001
- Orosz et al. (2012a) Orosz, J. A., Welsh, W. F., Carter, J. A., et al. 2012, ApJ, 758, 87
- Orosz et al. (2012b) Orosz, J. A., Welsh, W. F., Carter, J. A., et al. 2012, Science, 337, 1511
- Ostlie & Carroll (1996) Ostlie, D. A., & Carroll, B. W. 1996, An Introduction to Modern Stellar Astrophysics
- Pagel et al. (1978) Pagel, B. E. J., Edmunds, M. G., Fosbury, R. A. E., & Webster, B. L. 1978, MNRAS, 184, 569
- Planck Collaboration et al. (2011) Planck Collaboration, Abergel, A., Ade, P. A. R., et al. 2011, A&A, 536, A24
- Porter & Rivinius (2003) Porter, J. M., & Rivinius, T. 2003, PASP, 115, 1153
- Rieke & Lebofsky (1985) Rieke, G. H., & Lebofsky, M. J. 1985, ApJ, 288, 618
- Rieke et al. (2004) Rieke, G. H., et al. 2004, ApJS, 154, 25
- Sana et al. (2013) Sana, H., de Koter, A., de Mink, S. E., et al. 2013, A&A, 550, A107
- Sana et al. (2012) Sana, H., de Mink, S. E., de Koter, A., et al. 2012, Science, 337, 444
- Sandstrom et al. (2010) Sandstrom, K. M., Bolatto, A. D., Draine, B. T., Bot, C., & Stanimirović, S. 2010, ApJ, 715, 701
- Schlegel et al. (1998) Schlegel, D. J., Finkbeiner, D. P., & Davis, M. 1998, ApJ, 500, 525
- Schwamb et al. (2012) Schwamb, M. E., Orosz, J. A., Carter, J. A., et al. 2012, arXiv:1210.3612
- Silaj et al. (2010) Silaj, J., Jones, C. E., Tycner, C., Sigut, T. A. A., & Smith, A. D. 2010, ApJS, 187, 228
- Skrutskie et al. (2006) Skrutskie, M. F., et al. 2006, AJ, 131, 1163
- Sloan et al. (2004) Sloan, G. C., et al. 2004, ApJ, 614, L77
- Smith & Wyatt (2010) Smith, R., & Wyatt, M. C. 2010, A&A, 515A, 95
- Sota et al. (2011) Sota, A., Maíz-Apellániz, J., Walborn, N. R., Alfaro, E. J., Barbá, R. H., Morrell, N. I., Gamen, R. C., Arias, & J. I. 2011, ApJS, 193, 24
- Stanimirović et al. (1999) Stanimirović, S., Staveley-Smith, L., Dickey, J. M., Sault, R. J., & Snowden, S. L. 1999, MNRAS, 302, 417
- Stanimirović et al. (2004) Stanimirović, S., Staveley-Smith, L., & Jones, P. A. 2004, ApJ, 604, 176
- Staveley-Smith et al. (1997) Staveley-Smith, L., Sault, R. J., Hatzidimitriou, D., Kesteven, M. J., & McConnell, D. 1997, MNRAS, 289, 225
- Su et al. (2006) Su, K. Y. L., et al. 2006, ApJ, 653, 675
- Takeuchi & Artymowicz (2001) Takeuchi, T., & Artymowicz, P. 2001, ApJ, 557, 990
- Terebey & Fich (1986) Terebey, S., & Fich, M. 1986, ApJ, 309, L73
- Testor (2001) Testor, G. 2001, A&A, 372, 667
- Touhami et al. (2010) Touhami, Y., et al. 2010, PASP, 122, 379
- Udalski et al. (1998) Udalski, A., Szymański, M., Kubiak, M., Pietrzyński, G., Woźniak, P., & ebruń, K. 1998, Acta Astronomica, 48, 147
- van Buren & McCray (1988) van Buren, D., & McCray, R. 1988, ApJ, 329, L93
- van Loon et al. (2010) van Loon, J. Th., Oliveira, J. M., Gordon, K. D., Sloan, G. C., & Engelbracht, C. W. 2010, AJ, 139, 1553
- Waters & Marlborough (1994) Waters, L. B. F. M., & Marlborough, J. M. 1994, IAU Symposium 162: Pulsation; rotation; and mass loss in early-type stars (Kluwer), 399
- Waters & Waelkens (1998) Waters, L. B. F. M., & Waelkens, C. 1998, ARA&A, 36, 233
- Welsh et al. (2012) Welsh, W. F., Orosz, J. A., Carter, J. A., et al. 2012, Nature, 481, 475
- Werner et al. (2004) Werner, M. W., et al. 2004, ApJS, 154, 1
- White & Bally (1993) White, R. E., & Bally, J. 1993, ApJ, 409, 234
- Zaritsky et al. (2002) Zaritsky, D., Harris, J., Thompson, I. B., Grebel, E. K., & Massey, P. 2002, AJ, 123, 855

| ID No. | Name | RA (J2000) | Dec (J2000) | BaaOriginal S3MC data point. | VaaOriginal S3MC data point. | IaaOriginal S3MC data point. | J | H | K |
|---|---|---|---|---|---|---|---|---|---|
| (deg) | (deg) | (Jy) | (Jy) | (Jy) | (Jy) | (Jy) | (Jy) | ||
| B001 | J004336.56730226.80 | 10.90234 | 73.04078 | 2078.39 | 1585.23 | 918.67 | 1088.65aaOriginal S3MC data point. | 564.29aaOriginal S3MC data point. | 827.17aaOriginal S3MC data point. |
| B003 | J004511.14732111.95 | 11.29644 | 73.35332 | 1909.53 | 1424.6 | 780.47 | 387.0 | 278.2 | … |
| B004 | J004537.37731236.50 | 11.40574 | 73.21014 | 3743.92 | 2976.41 | 1783.03 | 1008 | 573.7 | 391.1 |
| B005 | J004600.13732324.54 | 11.50056 | 73.39015 | 1502.89 | 1180.57 | 715.75 | … | … | … |
| B006 | J004610.79732535.61 | 11.54496 | 73.42656 | 2684.89 | 2484.81 | 1688.72 | 1339 | 996.1 | 852.6 |
| B007 | J004611.72732325.54 | 11.54884 | 73.39043 | 6530.19 | 5655.79 | 3742.47 | 2295.56aaOriginal S3MC data point. | … | … |
| B009 | J004655.83730452.89 | 11.73266 | 73.08136 | 3625.15 | 2824.18 | 1596.46 | 768.6 | 523.2 | 261.5 |
| B010 | J004656.08731054.83 | 11.73367 | 73.18190 | 8190.79 | 6787.24 | 4409.19 | 2667 | 1709 | 1199 |
| B011 | J004657.30731808.71 | 11.73879 | 73.30242 | 1575.16 | 1221.5 | 682.27 | 353.91aaOriginal S3MC data point. | … | … |
| B013 | J004707.66733008.17 | 11.78192 | 73.50227 | 5187.12 | 4007.68 | 2255.06 | 1099.74aaOriginal S3MC data point. | 749.38aaOriginal S3MC data point. | … |
| B014 | J004718.97730711.20 | 11.82905 | 73.11978 | 6590.62 | 5134.44 | 2956.37 | 1613 | 881.3 | 536.9 |
| B015 | J004726.74731316.13 | 11.86142 | 73.22115 | 3905.94 | 3351.92 | 1933.56 | 1740 | 1549 | 1125 |
| B016 | J004727.53731705.89 | 11.86473 | 73.28497 | 1945.03 | 1775.39 | 1073.39 | 477.85aaOriginal S3MC data point. | … | … |
| B019 | J004740.20731548.63 | 11.91752 | 73.26351 | 2780.52 | 2214.59 | 1273.97 | 699.7 | 403.9 | 280.5 |
| B021 | J004742.79730009.75 | 11.92833 | 73.00271 | 8800.88 | 7009.6 | 4080.92 | 2281 | 1324 | 849.4 |
| B022 | J004746.41731809.93 | 11.94339 | 73.30276 | 2239.37 | 1744.59 | 988.91 | 518.2 | 280.5 | … |
| B023 | J004747.53731727.74 | 11.94806 | 73.29104 | 2592.54 | 2333.96 | 1620.16 | 977.4 | 618.7 | 433.2 |
| B024 | J004747.93730431.15 | 11.94971 | 73.07532 | 2757.57 | 2144.34 | 1229.02 | 580.3 | 379.8 | 317.3 |
| B025 | J004752.03725207.85 | 11.96681 | 72.86885 | 6393.31 | 5755.63 | 3495.9 | 1899 | 1146 | 700.0 |
| B026 | J004752.19732121.95 | 11.96750 | 73.35610 | 3806.50 | 2976.41 | 1728.06 | 947.3 | 519.4 | 275.1 |
| B028 | J004808.41731454.70 | 12.03507 | 73.24853 | 2906.2 | 6316.74 | 3064.49 | 5376 | 5601 | 7522 |
| B029 | J004809.68732413.06 | 12.04036 | 73.40363 | 9676.67 | 7566.47 | 4141.51 | 2310 | 1308 | 792.0 |
| B032 | J004818.08731312.79 | 12.07537 | 73.22022 | 2196.47 | 1689.25 | 939.2 | 492.6 | 262.5 | … |
| B033 | J004818.91732715.30 | 12.07881 | 73.45425 | 6806.53 | 5139.17 | 2852.06 | 1425 | 800.0 | 547.9 |
| B034 | J004830.03731809.53 | 12.12513 | 73.30265 | 1872.95 | 1424.6 | 900.24 | 466.11aaOriginal S3MC data point. | 360 aaOriginal S3MC data point. | … |
| B035 | J004840.43730441.87 | 12.16846 | 73.07830 | 3018.05 | 2662.52 | 1750.49 | 1133 | 687.9 | 434.0 |
| B036 | J004841.77732615.25 | 12.17408 | 73.43757 | 2631.03 | 2575.69 | 1516.21 | 1272 | 1047 | 987.9 |
| B037 | J004843.19731147.65 | 12.18000 | 73.19657 | 7239.79 | 5645.38 | 3084.31 | 1520 | 935.6 | 503.0 |
| B038 | J004853.00731410.31 | 12.22087 | 73.23620 | 4818.66 | 4011.37 | 2713.68 | 1780 | 1253 | 1029 |
| B040 | J004858.95731403.62 | 12.24565 | 73.23434 | 2295.76 | 2012.3 | 1234.69 | 790.1 | 482.5 | … |
| B042 | J004907.89730906.30 | 12.28289 | 73.15175 | 3180.72 | 2793.14 | 1618.67 | 988.3aaOriginal S3MC data point. | … | … |
| B043 | J004910.86730719.66 | 12.29525 | 73.12213 | 5868.49 | 4717.3 | 2555.99 | 1273 | 786.9 | 467.7 |
| B044 | J004916.70731631.62 | 12.31962 | 73.27545 | 5661.43 | 4410.55 | 2548.93 | 1344 | 791.9 | 521.8 |
| B045 | J004919.07731247.23 | 12.32949 | 73.21312 | 2638.31 | 2198.33 | 1320.56 | 832.7 | 515.6 | 314.4 |
| B047 | J004930.97730952.88 | 12.37908 | 73.16469 | 2255.93 | 1881.45 | 1102.45 | 636.9 | 346.0 | … |
| B048 | J004931.95725116.88 | 12.38313 | 72.85469 | 10827.45 | 8474.09 | 4906.35 | 2619 | 1574 | 903.5 |
| B049 | J004942.72731718.20 | 12.42801 | 73.28839 | 7470.09 | 6161.59 | 4257.54 | … | … | 1264.72aaOriginal S3MC data point. |
| B051 | J004944.38725102.05 | 12.43493 | 72.85057 | 1212.62 | 979.25 | 586.62 | … | … | … |
| B052 | J004944.32732721.63 | 12.43470 | 73.45601 | 1274.46 | 1115.05 | 733.77 | 437.8 | 263.0 | … |
| B055 | J004952.37725131.60 | 12.46821 | 72.85878 | 2336.29 | 1838.62 | 1099.41 | … | … | … |
| B057 | J004957.89725154.79 | 12.49123 | 72.86522 | 8752.38 | 5766.24 | 3861.52 | 2101 | 1216 | 735.8 |
| B059 | J005000.46725512.36 | 12.50192 | 72.92010 | 8190.79 | 6133.28 | 3670.78 | 2172 | 1295 | 815.82aaOriginal S3MC data point. |
| B062 | J005010.98730943.41 | 12.54577 | 73.16206 | 2399.53 | 1845.41 | 1167.24 | 712.0 | 454.1 | 326.2 |
| B064 | J005011.21730026.02 | 12.54675 | 73.00723 | 4259.18 | 3302.88 | 2129.9 | 1190 | 691.0 | 468.1 |
| B065 | J005016.35725239.03 | 12.56816 | 72.87751 | 1845.55 | 1444.42 | 875.71 | 477.0 | 306.7 | 255.6 |
| B066 | J005034.13725328.17 | 12.64223 | 72.89116 | 3523.11 | 2630.83 | 1473.53 | 681.2 | 413.3 | 262.7 |
| B068 | J005049.59724239.96 | 12.70665 | 72.71110 | 10678.89 | 7850.42 | 4454.09 | 2245 | 1317 | 824.0 |
| B069 | J005053.67725116.34 | 12.72363 | 72.85454 | 1759.24 | 1352.99 | 792.79 | 505.9 | 253.2 | 244.3 |
| B070 | J005058.13725141.14 | 12.74222 | 72.86143 | 3009.72 | 2194.29 | 1303.64 | 663.3 | 424.9 | 248.2 |
| B072 | J005105.15724810.08 | 12.77149 | 72.80280 | 2561.69 | 1925.28 | 1086.32 | 501.7 | 279.2 | 168.4 |
| B073 | J005105.83724057.50 | 12.77430 | 72.68264 | 7094.57 | 5177.18 | 2878.45 | 1719 | 933.0 | 632.6 |
| B075 | J005118.76733016.19 | 12.82818 | 73.50450 | 4881.19 | 3834.36 | 2106.49 | 1037 | 538.4 | 356.7 |
| B076 | J005131.66731529.01 | 12.88192 | 73.25806 | 2842.67 | 2101.32 | 1298.85 | … | … | … |
| B077 | J005137.38725713.64 | 12.90577 | 72.95379 | 8281.82 | 6469.83 | 3670.78 | 2010 | 1195 | 751.5 |
| B079 | J005158.09732031.38 | 12.99207 | 73.34205 | 644.65 | 945.57 | 525.72 | 1320 | 1429 | 2060 |
| B080 | J005202.13723930.09 | 13.00888 | 72.65836 | 6038.46 | 4165.75 | 2586.77 | 1339 | 745.3 | 541.4 |
| B081 | J005206.00725209.19 | 13.02502 | 72.86922 | 1918.34 | 1536.36 | 1067.48 | 1106 | 874.8 | 823.2 |
| B082 | J005206.44724946.84 | 13.02685 | 72.82968 | 5298.17 | 4204.29 | 2502.41 | … | 1153 | 895.2 |
| B083 | J005210.67724119.21 | 13.04448 | 72.68867 | 3497.24 | 2408.2 | 1561.56 | 989.2 | 560.7 | 346.4 |
| B085 | J005245.05722844.03 | 13.18771 | 72.47890 | 4366.43 | 4015.07 | 2782.01 | 1894 | 1281 | 855.7 |
| B087 | J005300.20724027.84 | 13.25087 | 72.67440 | 9014.18 | 6093.87 | 3518.51 | 1929 | 1137 | 766.9 |
| B088 | J005309.30725331.30 | 13.28879 | 72.89203 | 6812.81 | 4989.91 | 2771.78 | 1358 | 771.8 | 493.8 |
| B089 | J005310.59731038.38 | 13.29413 | 73.17733 | 4652.92 | 3699.07 | 2149.6 | 1130 | 615.3 | 413.4 |
| B091 | J005315.69731128.17 | 13.31541 | 73.19116 | 5708.55 | 4542.48 | 2656.8 | 1374 | 823.9 | 441.7 |
| B092 | J005342.39732320.18 | 13.42664 | 73.38894 | 2401.74 | 1881.45 | 1146.99 | 658.4 | 429.2 | 239.0 |
| B093 | J005342.42723921.52 | 13.42678 | 72.65598 | 2206.61 | 1966.5 | 1357.56 | 1379.39aaOriginal S3MC data point. | 920.24aaOriginal S3MC data point. | 654.03aaOriginal S3MC data point. |
| B094 | J005353.43724828.58 | 13.47266 | 72.80794 | 10503.31 | 8003.74 | 5128.12 | 3023 | 1773 | 1116 |
| B096 | J005401.98724221.92 | 13.50825 | 72.70609 | 3461.99 | 2533.34 | 1495.4 | 777.8 | 468.9 | 308.7 |
| B098 | J005429.76722607.36 | 13.62401 | 72.43538 | 3956.64 | 3296.8 | 2151.59 | 1258.02aaOriginal S3MC data point. | 678.42aaOriginal S3MC data point. | 629.79aaOriginal S3MC data point. |
| B100 | J005454.44723209.52 | 13.72685 | 72.53598 | 2283.11 | 1777.02 | 954.9 | 478.3 | 318.5 | … |
| B101 | J005455.07722537.27 | 13.72946 | 72.42702 | 6657.73 | 5087.37 | 2766.68 | 1446 | 842.4 | 489.7 |
| B102 | J005503.27725521.36 | 13.76366 | 72.92260 | 6145.06 | 4635.46 | 2445.45 | 1205.84aaOriginal S3MC data point. | 709.09aaOriginal S3MC data point. | 487.07aaOriginal S3MC data point. |
| B103 | J005504.51724637.52 | 13.76883 | 72.77709 | 9784.22 | 8100.15 | 4541.07 | 2484.78aaOriginal S3MC data point. | 1521.6 aaOriginal S3MC data point. | 981.74aaOriginal S3MC data point. |
| B104 | J005509.36722756.55 | 13.78901 | 72.46571 | 9966.12 | 7996.37 | 4528.54 | 2607 | 1531 | 984.3 |
| B105 | J005510.66723420.78 | 13.79445 | 72.57244 | 10245.33 | 8528.9 | 5185.12 | 3049 | 1862 | 1130 |
| B107 | J005541.20722320.14 | 13.92170 | 72.38893 | 5645.81 | 4648.29 | 2454.47 | 2984.61aaOriginal S3MC data point. | 1963.81aaOriginal S3MC data point. | 1216.73aaOriginal S3MC data point. |
| B108 | J005544.60721609.94 | 13.93584 | 72.26943 | 3139.97 | 2316.82 | 1206.59 | 666.3 | 377.7 | 282.0 |
| B109 | J005545.75723817.55 | 13.94066 | 72.63821 | 1563.6 | 1189.3 | 653.97 | 422.75aaOriginal S3MC data point. | … | … |
| B112 | J005611.62721824.26 | 14.04843 | 72.30674 | 7029.53 | 5527.05 | 2878.45 | 1383 | 814.1 | 474.2 |
| B115 | J005617.30721728.75 | 14.07210 | 72.29132 | 3716.43 | 3110.95 | 1636.66 | 928.3 | 576.4 | 357.7 |
| B116 | J005620.07722702.23 | 14.08366 | 72.45062 | 2260.09 | 1773.75 | 1003.6 | 491.7 | 318.2 | … |
| B117 | J005623.53722124.12 | 14.09807 | 72.35670 | 4770.08 | 4402.44 | 2252.99 | 1016 | 580.6 | 353.1 |
| B118 | J005627.11722542.88 | 14.11296 | 72.42858 | … | 2638.11 | 1499.54 | 864.8 | 521.8 | 319.7 |
| B119 | J005644.27722906.75 | 14.18448 | 72.48521 | 6328.87 | 5557.67 | 3886.5 | 2922 | 2060 | 1465 |
| B122 | J005656.35724906.78 | 14.23481 | 72.81855 | 5486.89 | 4282.46 | 2474.9 | 1185 | 739.1 | 389.0 |
| B123 | J005712.13723935.13 | 14.30056 | 72.65976 | 5293.29 | 4239.29 | 2438.7 | 1265 | 711.0 | 426.1 |
| B124 | J005715.21722734.30 | 14.31341 | 72.45953 | 4423.09 | 3348.83 | 1879.14 | 992.9 | 575.3 | 363.7 |
| B125 | J005719.21723112.90 | 14.33005 | 72.52025 | 3641.88 | 2938.28 | 1626.14 | 949.9 | 501.5 | 298.1 |
| B126 | J005737.27722154.32 | 14.40530 | 72.36509 | 8849.65 | 6843.73 | 3763.21 | 1959 | 1171 | 639.6 |
| B127 | J005811.84723552.65 | 14.54937 | 72.59796 | 7779.04 | 6457.93 | 3704.75 | 1941 | 1147 | 697.5 |
| B128 | J005812.38723934.81 | 14.55161 | 72.65967 | 6242.03 | 4840.53 | 2733.75 | 1421 | 817.9 | 525.7 |
| B129 | J005813.89720919.51 | 14.55790 | 72.15542 | 3631.83 | 2911.34 | 1606.79 | 790.1 | 470.7 | 340.4 |
| B132 | J005827.49721153.91 | 14.61457 | 72.19831 | 2827 | 2306.18 | 1413.7 | 795.2 | 492.8 | 297.8 |
| B135 | J005837.02721359.91 | 14.65429 | 72.23331 | 4173.75 | 3312.02 | 1967.7 | 1130 | 733.0 | 410.7 |
| B136 | J005853.66722230.75 | 14.72359 | 72.37521 | 1838.76 | 1508.32 | 904.4 | 527.8 | 411.1 | 405.8 |
| B137 | J005859.13724434.11 | 14.74641 | 72.74281 | 9224.14 | 7239.24 | 4114.89 | 2061 | 1244 | 807.5 |
| B139 | J005908.61722648.58 | 14.78591 | 72.44683 | 2239.37 | 1703.31 | 942.67 | 501.7 | 308.4 | … |
| B140 | J005912.41721617.86 | 14.80172 | 72.27163 | 1508.43 | 1215.89 | 713.11 | 679.3 | 461.2 | 379.8 |
| B141 | J005913.87720927.32 | 14.80780 | 72.15759 | 1675.43 | 1560.61 | 851.84 | 1060.93aaOriginal S3MC data point. | 875.59aaOriginal S3MC data point. | 530.63aaOriginal S3MC data point. |
| B142 | J005920.70721710.89 | 14.83629 | 72.28636 | 9014.18 | 7003.14 | 3940.57 | 1990 | 1264 | 794.9 |
| B144 | J005928.82721231.57 | 14.87009 | 72.20877 | 4480.5 | 3395.42 | 1873.95 | 877.6 | 577.4 | 280.8 |
| B145 | J005931.78721334.96 | 14.88242 | 72.22638 | 3433.41 | 2580.44 | 1400.74 | 708.7 | 487.4 | 353.8 |
| B148 | J010055.17720804.66 | 15.22989 | 72.13463 | 6825.37 | 5082.68 | 2784.57 | 1474 | 823.9 | 537.9 |
| B152 | J010217.77715143.09 | 15.57407 | 71.86197 | 5027.2 | 4048.49 | 2189.57 | 1214 | 705.8 | 405.1 |
| B154 | J010241.58720036.14 | 15.67326 | 72.01004 | 2115.08 | 1686.14 | 910.25 | 458.87aaOriginal S3MC data point. | … | … |
| B156 | J010245.09715612.26 | 15.68790 | 71.93674 | 6670 | 5603.93 | 3400.62 | 1981 | 1281 | 806.0 |
| B159 | J010300.05722738.19 | 15.75023 | 72.46061 | 5172.8 | 3816.74 | 2068.04 | 1060 | 519.9 | 373.2 |
| B160 | J010304.84715335.77 | 15.77017 | 71.89327 | 1500.12 | 1461.82 | 830.92 | 534.2 | 294.0 | 392.64aaOriginal S3MC data point. |
| B161 | J010312.30720445.66 | 15.80126 | 72.07935 | … | 2241.26 | 1222.25 | 620.1 | 391.8 | … |
| B163 | J010315.76720251.61 | 15.81567 | 72.04767 | 5101.83 | 3695.67 | 1884.34 | 960.5 | 563.8 | 335.1 |
| B165 | J010318.91715413.35 | 15.82883 | 71.90371 | 5879.31 | 5096.75 | 3036.4 | 1845 | 1167 | 790.6 |
| B167 | J010322.54720616.59 | 15.84393 | 72.10461 | 1219.34 | 1441.76 | 876.51 | 899.7 | 632.6 | 354.8 |
| B169 | J010336.20721120.32 | 15.90086 | 72.18898 | 3938.46 | 2938.28 | 1594.99 | 775.7 | 440.9 | 260.1 |
| B172 | J010339.23723523.13 | 15.91347 | 72.58976 | 1749.55 | 1385.78 | 812.75 | 471.3 | 375.9 | … |
| B175 | J010344.37715953.37 | 15.93491 | 71.99816 | 1311.37 | 1123.29 | 713.77 | 452.6 | 308.4 | … |
| B177 | J010356.40724117.95 | 15.98504 | 72.68832 | 2790.78 | 2029.05 | 1045.1 | 436.6 | 274.1 | … |
| B179 | J010421.39715642.39 | 16.08913 | 71.94511 | … | 5851.85 | 3271.59 | 1694 | 952.1 | 631.4 |
| B182 | J010452.94715449.28 | 16.22062 | 71.91369 | 12397.27 | 8357.82 | 5118.69 | 2564 | 1540 | 973.5 |
| B183 | J010541.21720340.39 | 16.42175 | 72.06122 | 5031.83 | 3675.3 | 2217.98 | 1499 | 886.1 | 634.9 |
| B184 | J010557.47721154.24 | 16.48946 | 72.19840 | 5050.4 | 3624.88 | 1955.05 | 969.37aaOriginal S3MC data point. | 564.81aaOriginal S3MC data point. | 418.02aaOriginal S3MC data point. |
| B188 | J010812.07715833.34 | 17.05033 | 71.97593 | 4468.13 | 3278.63 | 1694.96 | 885.7 | 583.3 | 292.6 |
| B190 | J011229.71731729.83 | 18.12382 | 73.29162 | 8632.29 | 4492.55 | 2794.85 | 4542 | 3332 | 2509 |
| B191 | J011348.83731805.04 | 18.45350 | 73.30140 | 7916.37 | 6651.09 | 4245.79 | 1835.22aaOriginal S3MC data point. | 1034.43aaOriginal S3MC data point. | 917.9aaOriginal S3MC data point. |
| B192 | J011513.70732003.29 | 18.80712 | 73.33425 | 8537.41 | 6369.32 | 3413.17 | 1636 | 997.9 | 585.5 |
| B193 | J011647.69730839.62 | 19.19872 | 73.14434 | 5230.29 | 4262.78 | 2337.54 | 1228 | 757.0 | 462.5 |
| ID No. | 3.6 µm | 4.5 µm | 5.8 µm | 8.0 µm | 24 µmaaIncludes correction factor from MIPS to IRAC scale. | aaIncludes correction factor from MIPS to IRAC scale. | 70 µmaaIncludes correction factor from MIPS to IRAC scale. | aaIncludes correction factor from MIPS to IRAC scale. | ||||
|---|---|---|---|---|---|---|---|---|---|---|---|---|
| (Jy) | (Jy) | (Jy) | (Jy) | (Jy) | (Jy) | (Jy) | (Jy) | (Jy) | (Jy) | (Jy) | (Jy) | |
| B001 | … | … | 444.40bbOriginal S3MC data point. | 2.93 | … | … | … | … | 198102.30 | 624.29 | … | … |
| B003 | 58.53 | 2.28 | 44.12 | 2.51 | … | … | … | … | 930.76 | 26.62 | … | … |
| B004 | 159.10 | 4.02 | 99.99 | 3.94 | 98.28bbOriginal S3MC data point. | 8.64 | … | … | 1684.34 | 26.40 | … | … |
| B005 | 189.40 | 7.51 | 168.70 | 6.12 | 382.80 | 23.00 | 666.20 | 33.63 | 4215.01 | 42.52 | … | … |
| B006 | 263.10 | 14.05 | 238.36bbOriginal S3MC data point. | 1.74 | 287.10 | 17.45 | 659.70 | 40.85 | 22090.02 | 111.60 | … | … |
| B007 | 575.10 | 9.76 | 412.60 | 9.30 | 323.90 | 14.23 | 198.40 | 12.74 | 1647.90 | 29.82 | … | … |
| B009 | 142.30 | 6.08 | 96.72 | 4.76 | … | … | 92.00bbOriginal S3MC data point. | 9.48 | 2500.48 | 31.08 | … | … |
| B010 | 661.70 | 14.72 | 500.50 | 11.84 | 478.50 | 18.28 | 584.80 | 31.21 | 7382.77 | 55.72 | … | … |
| B011 | 51.80 | 1.96 | 39.78 | 2.78 | … | … | … | … | 2087.20 | 28.72 | … | … |
| B013 | 167.60 | 3.61 | 110.60 | 3.62 | … | … | … | … | 1149.26 | 28.52 | … | … |
| B014 | 225.30 | 4.66 | 142.00 | 4.02 | 123.76bbOriginal S3MC data point. | 9.19 | 87.58bbOriginal S3MC data point. | 11.13 | 1948.75 | 28.46 | … | … |
| B015 | 485.20 | 14.90 | 319.70 | 12.28 | 238.50 | 15.34 | 158.24bbOriginal S3MC data point. | 14.35 | 4843.77 | 46.41 | … | … |
| B016 | 114.80 | 4.17 | 83.30 | 4.40 | … | … | 211.60bbOriginal S3MC data point. | 14.35 | 7047.57 | 52.57 | … | … |
| B019 | 118.30 | 3.81 | 92.86 | 3.76 | … | … | … | … | 2534.84 | 54.48 | … | … |
| B021 | 331.90 | 6.01 | 214.00 | 4.20 | 155.40 | 12.08 | 104.88bbOriginal S3MC data point. | 8.54 | 1093.05 | 27.72 | … | … |
| B022 | 79.59 | 2.59 | 67.77 | 2.90 | 93.73bbOriginal S3MC data point. | 9.06 | 186.10 | 11.38 | 6160.64 | 58.06 | … | … |
| B023 | 178.60 | 3.62 | 162.40 | 5.56 | 229.90 | 13.47 | 790.30 | 27.31 | 39214.47 | 204.24 | … | … |
| B024 | 88.11 | 2.55 | 58.20 | 1.84 | … | … | 55.02bbOriginal S3MC data point. | 9.16 | 1093.05 | 29.29 | … | … |
| B025 | 282.60 | 6.98 | 180.80 | 3.83 | 138.32bbOriginal S3MC data point. | 8.68 | 80.96bbOriginal S3MC data point. | 10.03 | 835.30 | 28.19 | … | … |
| B026 | 140.80 | 3.77 | 90.96 | 3.72 | … | … | … | … | 1002.48 | 27.70 | … | … |
| B028 | 9138.00 | 466.30 | 14030.00 | 513.70 | 37120.00 | 1022.00 | 100300.00 | 8321.00 | 1632288.00bbOriginal S3MC data point. | 1264.81 | 11107800.00bbOriginal S3MC data point. | 36590.40 |
| B029 | 319.80 | 8.72 | 186.60 | 5.31 | 178.20 | 13.72 | 125.12bbOriginal S3MC data point. | 13.98 | 5955.56 | 46.19 | … | … |
| B032 | 76.24 | 2.36 | 48.01 | 2.97 | … | … | … | … | 3525.87 | 91.61 | … | … |
| B033 | 208.50 | 4.38 | 133.10 | 3.82 | 119.21bbOriginal S3MC data point. | 9.19 | … | … | 1591.69 | 25.90 | … | … |
| B034 | 86.66 | 2.59 | 62.21 | 2.99 | … | … | … | … | 1414.72 | 31.51 | … | … |
| B035 | 204.30 | 4.58 | 128.90 | 3.61 | 75.53bbOriginal S3MC data point. | 8.78 | … | … | 721.31bbOriginal S3MC data point. | 60.49 | … | … |
| B036 | 1836.80bbOriginal S3MC data point. | 27.55 | 983.10 | 39.52 | 3013.00 | 104.30 | 7000.00 | 432.70 | 256606.50 | 591.81 | 1687950.00bbOriginal S3MC data point. | 8396.19 |
| B037 | 231.70 | 4.55 | 147.90 | 4.19 | 141.96bbOriginal S3MC data point. | 8.34 | … | … | 1380.37 | 28.68 | … | … |
| B038 | 619.30 | 10.64 | 498.10 | 13.19 | 402.40 | 12.17 | 274.60 | 11.75 | 726.10 | 28.66 | … | … |
| B040 | 133.80 | 3.67 | 84.04 | 4.17 | … | … | … | … | 729.74 | 55.17 | … | … |
| B042 | 161.60 | 4.59 | 115.30 | 4.05 | 152.88bbOriginal S3MC data point. | 8.34 | 298.70 | 17.57 | 7348.42 | 47.92 | … | … |
| B043 | 188.00 | 3.99 | 116.30 | 3.88 | 106.47bbOriginal S3MC data point. | 8.22 | 90.80bbOriginal S3MC data point. | 12.88 | 3146.94 | 32.16 | … | … |
| B044 | 208.90 | 4.30 | 134.20 | 3.80 | 102.83bbOriginal S3MC data point. | 6.18 | … | … | 751.91bbOriginal S3MC data point. | 64.57 | … | … |
| B045 | 135.70 | 2.91 | 87.31 | 3.59 | … | … | … | … | 1661.44 | 30.26 | … | … |
| B047 | 118.70 | 3.30 | 103.50 | 4.81 | 114.66bbOriginal S3MC data point. | 6.97 | 99.36bbOriginal S3MC data point. | 12.24 | 3603.94 | 37.27 | … | … |
| B048 | 391.10 | 6.55 | 251.50 | 5.06 | 173.60 | 17.48 | 157.00 | 11.22 | 2900.23 | 35.98 | … | … |
| B049 | 1217.00 | 25.07 | 922.20 | 19.78 | 664.50 | 17.57 | 478.80 | 14.78 | 3100.10 | 43.77 | … | … |
| B051 | 47.97 | 1.97 | 34.55 | 2.44 | … | … | … | … | 563.18 | 41.64 | … | … |
| B052 | 69.03 | 3.48 | 52.24 | 2.32 | … | … | … | … | 1175.29 | 24.27 | … | … |
| B055 | 90.66 | 2.93 | 68.99 | 2.85 | … | … | 180.80 | 15.15 | 12804.30 | 117.53 | … | … |
| B057 | 311.40 | 6.36 | 206.00 | 5.53 | 174.72bbOriginal S3MC data point. | 9.92 | 192.20 | 12.72 | 7842.89 | 75.97 | … | … |
| B059 | 339.20 | 9.42 | 215.70 | 4.84 | 197.10 | 18.82 | 105.80bbOriginal S3MC data point. | 12.33 | 2094.49 | 29.79 | … | … |
| B062 | 150.40 | 3.46 | 112.10 | 4.10 | 88.82bbOriginal S3MC data point. | 6.36 | 139.84bbOriginal S3MC data point. | 12.33 | 2556.70 | 32.02 | … | … |
| B064 | 203.10 | 4.37 | 127.60 | 3.50 | 111.93bbOriginal S3MC data point. | 8.63 | 45.17bbOriginal S3MC data point. | 11.22 | 1308.54 | 26.49 | … | … |
| B065 | 74.88 | 2.12 | 53.21 | 3.18 | … | … | … | … | 603.16 | 34.53 | … | … |
| B066 | 108.70 | 3.69 | 65.00 | 2.60 | 90.73bbOriginal S3MC data point. | 8.52 | 122.36bbOriginal S3MC data point. | 12.24 | 4538.76 | 46.96 | … | … |
| B068 | 428.00 | 7.25 | 321.90 | 8.50 | 262.60 | 11.26 | 202.10 | 11.29 | 1424.09 | 25.89 | … | … |
| B069 | 70.29 | 2.74 | 56.89 | 2.86 | … | … | … | … | 802.61 | 58.30 | … | … |
| B070 | 102.00 | 3.16 | 73.00 | 3.23 | … | … | 71.12bbOriginal S3MC data point. | 12.24 | 1229.42 | 29.92 | … | … |
| B072 | 77.25 | 2.10 | 55.66 | 2.23 | … | … | 101.20bbOriginal S3MC data point. | 12.24 | 2370.36 | 29.36 | … | … |
| B073 | 218.70 | 5.25 | 133.20 | 4.86 | 114.66bbOriginal S3MC data point. | 6.50 | 97.52bbOriginal S3MC data point. | 11.59 | 5202.92 | 33.44 | … | … |
| B075 | 168.20 | 5.22 | 108.40 | 4.76 | … | … | … | … | 10368.36 | 56.60 | … | … |
| B076 | 96.57 | 3.35 | 66.32 | 2.62 | … | … | … | … | 593.37 | 33.31 | … | … |
| B077 | 287.90 | 8.23 | 180.10 | 4.98 | … | … | … | … | 1106.58 | 24.86 | … | … |
| B079 | 3343.00 | 83.64 | 4702.00 | 69.86 | 8568.00 | 107.40 | 23370.00 | 213.00 | 123670.80 | 436.18 | … | … |
| B080 | 199.70 | 3.73 | 129.90 | 4.72 | 109.20bbOriginal S3MC data point. | 5.93 | 156.80 | 16.59 | 6383.41 | 35.59 | … | … |
| B081 | 445.60 | 8.69 | 373.80 | 7.63 | 302.10 | 11.44 | 236.90 | 9.44 | 870.07 | 28.67 | … | … |
| B082 | 173.70 | 3.95 | 119.20 | 4.18 | 98.28bbOriginal S3MC data point. | 8.72 | 197.60 | 21.12 | 6613.47 | 69.29 | … | … |
| B083 | 135.20 | 3.08 | 96.48 | 4.87 | 107.38bbOriginal S3MC data point. | 5.76 | … | … | 854.04 | 34.96 | … | … |
| B085 | 469.30 | 8.46 | 337.70 | 13.86 | 230.20 | 11.22 | 169.70 | 28.80 | 693.51 | 27.76 | … | … |
| B087 | 308.50 | 5.90 | 199.00 | 5.07 | 160.16bbOriginal S3MC data point. | 7.50 | 120.52bbOriginal S3MC data point. | 9.20 | 3015.78 | 30.47 | … | … |
| B088 | 204.30 | 4.36 | 124.70 | 3.38 | 91.00bbOriginal S3MC data point. | 9.28 | 74.52bbOriginal S3MC data point. | 11.22 | 1408.47 | 27.68 | … | … |
| B089 | 179.50 | 4.20 | 115.00 | 2.91 | 84.45bbOriginal S3MC data point. | 8.91 | 50.97bbOriginal S3MC data point. | 9.08 | 768.26 | 32.27 | … | … |
| B091 | 214.90 | 5.42 | 136.60 | 3.53 | 118.30bbOriginal S3MC data point. | 9.28 | 67.90bbOriginal S3MC data point. | 10.58 | 430.97 | 33.31 | … | … |
| B092 | 115.40 | 3.08 | 72.07 | 3.09 | 79.81bbOriginal S3MC data point. | 8.00 | … | … | 687.06 | 49.97 | … | … |
| B093 | 417.76bbOriginal S3MC data point. | 3.89 | 281.79bbOriginal S3MC data point. | 1.27 | 535.99bbOriginal S3MC data point. | 10.56 | … | … | 51925.08 | 181.97 | … | … |
| B094 | 493.80 | 8.59 | 363.70 | 7.00 | 273.30 | 11.54 | 263.20 | 9.89 | 4334.72 | 46.56 | … | … |
| B096 | 116.10 | 2.82 | 76.57 | 2.27 | 68.43bbOriginal S3MC data point. | 6.29 | 58.60bbOriginal S3MC data point. | 8.72 | 796.16 | 25.82 | … | … |
| B098 | 227.20 | 5.41 | 152.40 | 4.26 | … | … | 94.76bbOriginal S3MC data point. | 13.34 | 582.02 | 22.55 | … | … |
| B100 | 70.68 | 2.20 | 47.07 | 2.25 | … | … | … | … | 1319.99 | 26.75 | … | … |
| B101 | 210.60 | 4.30 | 133.70 | 4.17 | 115.57bbOriginal S3MC data point. | 9.10 | … | … | 727.35 | 26.19 | … | … |
| B102 | 194.80 | 8.24 | 117.40 | 4.12 | … | … | … | … | 1660.39 | 25.78 | … | … |
| B103 | 486.08bbOriginal S3MC data point. | 4.87 | 284.82bbOriginal S3MC data point. | 1.16 | 264.81bbOriginal S3MC data point. | 9.74 | 159.16bbOriginal S3MC data point. | 9.38 | 870.28 | 32.01 | … | … |
| B104 | 427.40 | 8.06 | 280.60 | 6.77 | 209.60 | 11.90 | 168.90 | 11.31 | 655.83 | 32.27 | … | … |
| B105 | 482.60 | 8.98 | 345.80 | 7.71 | 211.60 | 12.35 | 136.60 | 13.50 | 2679.53 | 29.50 | 72527.40bbOriginal S3MC data point. | 10291.05 |
| B107 | 240.70 | 4.89 | 183.90 | 4.96 | 188.37bbOriginal S3MC data point. | 8.09 | 225.10 | 14.99 | 1967.49 | 29.69 | 48787.20bbOriginal S3MC data point. | 2308.68 |
| B108 | 99.76 | 3.96 | 65.54 | 9.10 | … | … | … | … | 7553.50 | 53.29 | … | … |
| B109 | 52.32 | 1.93 | 32.05 | 2.12 | … | … | … | … | 1467.81 | 24.17 | … | … |
| B112 | 202.80 | 3.69 | 124.30 | 5.38 | 99.19bbOriginal S3MC data point. | 7.28 | 101.20bbOriginal S3MC data point. | 16.28 | 1660.39 | 28.11 | … | … |
| B115 | 176.80 | 5.20 | 117.90 | 5.42 | 106.47bbOriginal S3MC data point. | 6.99 | 94.76bbOriginal S3MC data point. | 19.14 | 4382.61 | 36.25 | … | … |
| B116 | 86.94 | 2.53 | 56.00 | 2.42 | … | … | … | … | 638.55 | 34.38 | … | … |
| B117 | 146.20 | 2.59 | 86.68 | 2.69 | 66.52bbOriginal S3MC data point. | 6.03 | … | … | 501.76 | 34.35 | … | … |
| B118 | 148.90 | 3.87 | 101.70 | 4.08 | 91.91bbOriginal S3MC data point. | 8.64 | … | … | 1270.02 | 25.91 | … | … |
| B119 | 600.70 | 13.71 | 435.50 | 8.94 | 352.80 | 17.41 | 245.40 | 11.80 | 901.51 | 30.18 | … | … |
| B122 | 207.50 | 4.53 | 131.20 | 4.25 | 136.50bbOriginal S3MC data point. | 8.47 | … | … | 1361.63 | 23.57 | … | … |
| B123 | 195.60 | 4.59 | 132.60 | 5.01 | 127.40bbOriginal S3MC data point. | 8.65 | … | … | 766.28 | 24.85 | … | … |
| B124 | 135.60 | 3.29 | 87.41 | 3.56 | 74.44bbOriginal S3MC data point. | 8.04 | … | … | 624.60 | 34.35 | … | … |
| B125 | 143.80 | 3.85 | 98.06 | 5.69 | … | … | … | … | 1465.73 | 29.20 | … | … |
| B126 | 297.10 | 5.27 | 192.60 | 4.27 | 140.14bbOriginal S3MC data point. | 6.91 | 81.70bbOriginal S3MC data point. | 10.76 | 661.03 | 31.23 | … | … |
| B127 | 628.00 | 10.72 | 447.10 | 8.66 | 360.40 | 14.61 | 263.40 | 9.61 | 1441.78 | 27.39 | … | … |
| B128 | 206.20 | 5.18 | 135.30 | 4.07 | 144.69bbOriginal S3MC data point. | 9.83 | 107.64bbOriginal S3MC data point. | 12.97 | 2709.72 | 33.50 | … | … |
| B129 | 123.20 | 3.59 | 83.92 | 2.78 | 99.19bbOriginal S3MC data point. | 9.83 | 132.10 | 15.81 | 2466.13 | 28.99 | … | … |
| B132 | 135.20 | 5.09 | 96.28 | 4.71 | 104.65bbOriginal S3MC data point. | 9.83 | 190.60 | 20.00 | 12814.71 | 87.02 | … | … |
| B135 | 189.30 | 4.48 | 118.40 | 3.75 | 131.04bbOriginal S3MC data point. | 9.37 | 88.96bbOriginal S3MC data point. | 12.33 | 2993.92 | 34.81 | … | … |
| B136 | 228.80 | 10.10 | 164.80 | 7.40 | 143.78bbOriginal S3MC data point. | 7.60 | 81.42bbOriginal S3MC data point. | 11.13 | 579.84 | 31.23 | … | … |
| B137 | 319.90 | 8.71 | 206.80 | 5.76 | 158.10 | 15.93 | 87.40bbOriginal S3MC data point. | 12.33 | 754.93 | 25.00 | … | … |
| B139 | 65.09 | 2.06 | 50.48 | 2.37 | 58.24bbOriginal S3MC data point. | 6.93 | 52.26bbOriginal S3MC data point. | 9.57 | 1522.98 | 26.40 | … | … |
| B140 | 211.40 | 5.08 | 161.50 | 4.86 | 137.41bbOriginal S3MC data point. | 9.83 | 86.02bbOriginal S3MC data point. | 12.70 | 675.40bbOriginal S3MC data point. | 62.44 | … | … |
| B141 | … | … | 730.23bbOriginal S3MC data point. | 1.52 | … | … | 9752.00bbOriginal S3MC data point. | 49.40 | 136371.00 | 514.46 | … | … |
| B142 | 304.40 | 6.22 | 193.40 | 5.10 | 132.30 | 13.08 | 86.11bbOriginal S3MC data point. | 12.70 | 2992.88 | 31.77 | … | … |
| B144 | 145.80 | 3.42 | 87.71 | 3.58 | 82.90bbOriginal S3MC data point. | 8.60 | 102.12bbOriginal S3MC data point. | 15.18 | 2608.75 | 35.49 | … | … |
| B145 | 103.20 | 2.75 | 71.58 | 3.16 | 100.10bbOriginal S3MC data point. | 8.22 | 189.20 | 11.01 | 3907.91 | 49.22 | … | … |
| B148 | 212.30 | 3.71 | 139.20 | 3.62 | 126.49bbOriginal S3MC data point. | 9.46 | 85.38bbOriginal S3MC data point. | 14.08 | 927.84 | 27.39 | … | … |
| B152 | 174.90 | 3.71 | 110.30 | 4.02 | 68.80bbOriginal S3MC data point. | 8.79 | … | … | 2816.95 | 29.05 | … | … |
| B154 | 101.60 | 2.56 | 81.33 | 3.06 | 73.35bbOriginal S3MC data point. | 6.89 | … | … | 1415.76 | 29.00 | … | … |
| B156 | 342.40 | 8.35 | 210.70 | 5.29 | 182.00bbOriginal S3MC data point. | 11.38 | 124.80 | 17.24 | 2463.01 | 32.10 | … | … |
| B159 | 147.20 | 3.55 | 96.16 | 2.31 | 104.65bbOriginal S3MC data point. | 9.19 | 55.02bbOriginal S3MC data point. | 8.81 | 1303.33 | 27.99 | … | … |
| B160 | 87.84 | 2.79 | 67.16 | 2.60 | … | … | 240.90 | 12.10 | 9942.59 | 61.82 | … | … |
| B161 | 87.86 | 1.97 | 56.74 | 2.17 | 64.97bbOriginal S3MC data point. | 6.17 | … | … | 2092.41 | 35.31 | … | … |
| B163 | 139.50 | 2.98 | 94.13 | 2.71 | 118.30bbOriginal S3MC data point. | 7.46 | 159.70 | 10.80 | 5640.14 | 45.03 | … | … |
| B165 | 310.70 | 5.42 | 203.70 | 4.86 | 173.81bbOriginal S3MC data point. | 8.41 | 104.88bbOriginal S3MC data point. | 12.24 | 1355.38 | 27.62 | … | … |
| B167 | 183.40 | 4.12 | 118.60 | 3.13 | … | … | … | … | 1087.85 | 55.17 | … | … |
| B169 | 118.40 | 4.67 | 79.94 | 2.77 | … | … | … | … | 1088.89 | 26.06 | … | … |
| B172 | 98.63 | 4.45 | 81.56 | 4.29 | … | … | … | … | 537.16 | 33.31 | … | … |
| B175 | 88.11 | 2.95 | 65.13 | 3.51 | … | … | … | … | 1009.46 | 26.55 | 75141.00bbOriginal S3MC data point. | 3016.53 |
| B177 | 66.51 | 2.35 | 49.52 | 2.59 | … | … | … | … | 1630.21 | 40.73 | … | … |
| B179 | 257.40 | 4.99 | 154.90 | 4.56 | 148.33bbOriginal S3MC data point. | 8.78 | … | … | 2327.68 | 29.01 | 41055.30bbOriginal S3MC data point. | 2123.55 |
| B182 | 378.10 | 7.24 | 246.80 | 5.58 | 173.30 | 12.55 | 125.12bbOriginal S3MC data point. | 13.06 | 1099.30 | 23.78 | … | … |
| B183 | 239.40 | 5.89 | 167.00 | 6.22 | 181.09bbOriginal S3MC data point. | 10.83 | 280.40 | 13.41 | 12679.38 | 168.64 | … | … |
| B184 | 141.30 | 6.19 | 93.57 | 4.53 | … | … | … | … | 711.11 | 36.93 | … | … |
| B188 | 131.60 | 5.57 | 80.09 | 3.15 | … | … | … | … | 3050.13 | 29.75 | … | … |
| B190 | 868.70 | 15.06 | 714.40 | 11.39 | 591.50 | 17.26 | 451.40 | 12.28 | 617.21 | 26.92 | … | … |
| B191 | … | … | 872.64bbOriginal S3MC data point. | 2.21 | … | … | 5805.20bbOriginal S3MC data point. | 38.00 | 135121.80 | 689.04 | … | … |
| B192 | 251.90 | 5.55 | 160.90 | 4.36 | 142.87bbOriginal S3MC data point. | 12.19 | … | … | 960.74 | 25.23 | … | … |
| B193 | 183.90 | 4.07 | 122.80 | 3.47 | … | … | … | … | 1018.72 | 26.20 | … | … |
| SpT | Teff | Radius | Mass | Lbol | Slope | BC | Criteria |
|---|---|---|---|---|---|---|---|
| ( K) | (R⊙) | (M⊙) | (103 L⊙) | ||||
| O6 | 39 | 12.2 | 30.5 | 309.0 | 2.91 | 3.72 | He II 4686, 4541 Å, He I+He II 4026 He II 4200 Å |
| O7 | 37 | 11.3 | 27.3 | 213.3 | 2.91 | 3.54 | He II 4686, 4200 Å, He II 4541 Å He I 4471 Å |
| O8.5 | 34 | 9.9 | 22.8 | 118.4 | 2.91 | 3.27 | He II 4686, 4200 Å, He II 4541 Å He I 4387 Å |
| O9 | 33 | 9.5 | 21.5 | 96.3 | 2.91 | 3.18 | He II 4686, He II 4200 Å He I 4143 Å |
| B0 | 30 | 8.3 | 17.8 | 50.3 | 2.89 | 2.98 | He II 4686, 4541 Å, weak He II 4200 Å |
| B0.5 | 27 | 7.2 | 14.5 | 24.8 | 2.86 | 2.60 | Weak He II 4686 Å, no He II 4200, 4541 Å |
| B1/1.5 | 25 | 6.5 | 12.5 | 15.0 | 2.84 | 2.41 | Si IV 4088, 4116 Å |
| B2/B3 | 22 | 5.6 | 10.0 | 6.6 | 2.79 | 2.11 | Si III 4553 Å |
| B5/B8 | 15 | 3.8 | 5.4 | 0.6 | 2.67 | 1.24 | Si II 4128/4132 Å, no Si III 4553 Å |
| B9 | 10 | 2.8 | 3.2 | 0.1 | 2.52 | 0.30 | Si II 4128/4132 Å, Mg II 4481 Å He I 4471 Å |
| This Work | Literature | |||||
|---|---|---|---|---|---|---|
| No. | SpTaa”Em” denotes objects with forbidden emission lines. ”OBe” denotes Be stars. ”OBe?” denotes stars with unusually weak H absorption. No spectral type information indicates that the spectra were difficult to extract. | SpT | vrad | sourcebb A09 = Antoniou et al. (2009); C11 = Coe et al. (2011); E06 = Evans et al. (2006); EH08 = Evans & Howarth (2008); H08 = Hunter et al. (2008); M07 = Martayan et al. (2007); S = Simbad. | vrad H I | Identification |
| (km s-1) | (km s-1) | |||||
| B001 | Em | Planetary Nebula | ||||
| B003 | B0–B2 | |||||
| B004 | O9 | |||||
| B005 | … | Eclipsing binary | ||||
| B006 | … | |||||
| B007 | OBe | |||||
| B009 | B0–B2 | |||||
| B010 | OBe | Emission-line star | ||||
| B011 | … | |||||
| B013 | B0 | |||||
| B014 | B0–B2 | |||||
| B015 | OBe? | |||||
| B016 | OBe | |||||
| B019 | B0–B2 | |||||
| B021 | B0 | B1–2 II | EH08 | 136 | ||
| B022 | B0 | |||||
| B023 | O7 | |||||
| B024 | B0–B2 | Eclipsing binary | ||||
| B025 | B0–B2 | |||||
| B026 | B0–B2 | |||||
| B028 | Em | Compact H II region | ||||
| B029 | B0 | |||||
| B032 | B1 | |||||
| B033 | O7–O9 | |||||
| B034 | B0 | |||||
| B035 | OBe? | O6 Iaf (see section 3) | ||||
| B036 | Em | B0 V? | S | Young stellar object | ||
| B037 | B1 | |||||
| B038 | OBe | |||||
| B040 | B0–B2 | |||||
| B042 | B0 | |||||
| B043 | O9 | |||||
| B044 | B0 | |||||
| B045 | B1 | |||||
| B047 | O7 | |||||
| B048 | B2 | B0.5 IV | EH08 | 119, 141 | ||
| B049 | OBe | |||||
| B051 | B0 | |||||
| B052 | B0 | |||||
| B055 | OBe | Emission-line star | ||||
| B057 | B0–B2 | B2 | S | |||
| B059 | O9 | B3 | S | |||
| B062 | OBe? | |||||
| B064 | B0 | B1–3 III–V(e) | C11 | X-ray binary | ||
| B065 | B1 | |||||
| B066 | O9 | |||||
| B068 | OBe | B2? | S | Emission-line star | ||
| B069 | O7–O9 | |||||
| B070 | B0–B2 | |||||
| B072 | O8.5 | |||||
| B073 | B1 | Eclipsing binary | ||||
| B075 | B0–B2 | Eclipsing binary | ||||
| B076 | B1 | |||||
| B077 | B0–B2 | |||||
| B079 | Em | Planetary Nebula | ||||
| B080 | O8.5 | Emission-line star | ||||
| B081 | OBe | Emission-line star | ||||
| B082 | B1 | Emission-line star | ||||
| B083 | OBe? | B1–5 III | EH08 | 125, 159 | ||
| B085 | OBe | O9–B0e | A09 | X-ray binary | ||
| B087 | B0 | |||||
| B088 | O7 | |||||
| B089 | B1 | |||||
| B091 | B0–B2 | |||||
| B092 | B0 | Eclipsing binary | ||||
| B093 | … | Eclipsing binary | ||||
| B094 | Em | B2? | S | Emission-line star | ||
| B096 | B0 | Eclipsing binary | ||||
| B098 | B1 | |||||
| B100 | B1 | B0.5 V | H08, E06 | 129, 160–180 | ||
| B101 | B5 | B1–5 II | EH08 | 134, 167 | ||
| B102 | O9 | |||||
| B103 | OBe | B1 II | S | |||
| B104 | OBe | B1–3 II | EH08 | 128, 163 | ||
| B105 | B2 | B3? | S | |||
| B107 | B1 | Emission-line star | ||||
| B108 | … | B2 IV | M07 | 137, 165 | ||
| B109 | B0–B2 | |||||
| B112 | … | Eclipsing binary | ||||
| B115 | O7–O9 | O9 V | M07 | 136, 164 | ||
| B116 | OBe | B2 III(IVe?) | 151 | H08, S, E06 | 130, 170 | |
| B117 | B0–B2 | B0.5 V | E06 | Spectroscopic binary | ||
| B118 | B0 | B2 II | 130 | H08, E06 | 130, 166 | |
| B119 | OBe | B0 III | , 159 | M07, E06 | 129, 167 | |
| B122 | O7–O9 | Eclipsing binary? | ||||
| B123 | B0–B2 | |||||
| B124 | B0 | B1 V, B1–2 III | H08, EH08 | 131, 168 | ||
| B125 | B1 | |||||
| B126 | B1 | B0 IV, B0.5 IV | , | M07, EH08 | 131, 160–180 | |
| B127 | OBe | |||||
| B128 | O9 | |||||
| B129 | B0–B2 | B0 V | 172 | H08, E06 | 166 | |
| B132 | OBe? | B0.5 V | 176 | H08, E06 | 180 | Emission-line star |
| B135 | O7–O9 | |||||
| B136 | B0 | |||||
| B137 | B1 | B1–3 II | EH08 | 130, 146, 177 | Eclipsing binary | |
| B139 | O9 | |||||
| B140 | OBe | |||||
| B141 | Em | B0 V | H08 | Emission-line star | ||
| B142 | O8.5 | O7 IIIn((f)) | 208 | H08, E06 | 131, 173 | |
| B144 | O7–O9 | X-ray source within 5″ | ||||
| B145 | O7–O9 | O7 Vn | 250 | H08, E06 | 130, 175 | |
| B148 | B0 | |||||
| B152 | O7–O9 | |||||
| B154 | B1 | |||||
| B156 | O7–O9 | B1 | S | |||
| B159 | B0 | |||||
| B160 | O7–O9 | Emission object within 5″ | ||||
| B161 | B0 | |||||
| B163 | O7–O9 | |||||
| B165 | OBe? | |||||
| B167 | A0 | |||||
| B169 | O7–O9 | |||||
| B172 | B0–B2 | |||||
| B175 | … | |||||
| B177 | O7–O9 | O9 V | EH08 | 131, 185 | ||
| B179 | B0 | |||||
| B182 | B0 | |||||
| B183 | O7–O9 | Emission object at 3″ | ||||
| B184 | B0–B2 | B0.5 V | EH08 | 144, 187 | Eclipsing binary | |
| B188 | OBe? | |||||
| B190 | OBe | Emission-line star at 2″ | ||||
| B191 | … | Be? | S | |||
| B192 | B0–B2 | B1–3 II | EH08 | 144, 179 | ||
| B193 | B0 | |||||
| 4.5 µm | 8.0 µm | 24 µm | |||||
|---|---|---|---|---|---|---|---|
| No. | Excess | RatioaaRatio is measured excess divided by expected photosphere. | Excess | RatioaaRatio is measured excess divided by expected photosphere. | Excess | RatioaaRatio is measured excess divided by expected photosphere. | K–[24] |
| (Jy) | (Jy) | (Jy) | |||||
| B001 | 34013 | 3.270.53 | … | … | 198098624 | 414365181 | 10.86 |
| B003 | 75 | 0.190.15 | … | … | 92927 | 54764 | … |
| B004 | 125 | 0.140.06 | … | … | 168126 | 46719 | 6.49 |
| B005 | 1377 | 4.400.61 | 65534 | 60.57.3 | 421443 | 2935318 | … |
| B006 | 11013 | 0.860.19 | 61541 | 13.91.8 | 22084112 | 3756387 | 8.44 |
| B007 | 19326 | 0.880.21 | 12215 | 1.60.3 | 163830 | 16218 | … |
| B009 | 239 | 0.320.16 | 6710 | 2.60.5 | 249731 | 74080 | 7.36 |
| B010 | 24629 | 0.960.21 | 49633 | 5.60.8 | 737156 | 62965 | 6.88 |
| B011 | 66 | 0.180.22 | … | … | 208629 | 1342231 | … |
| B013 | 1212 | 0.120.14 | … | … | 114529 | 27533 | … |
| B014 | 16 | 0.10 | 3412 | 0.60.3 | 194228 | 27428 | 6.31 |
| B015 | 15321 | 0.920.21 | 10116 | 1.70.4 | 483646 | 63366 | 6.49 |
| B016 | 388 | 0.820.28 | 19615 | 12.42.1 | 704553 | 3357488 | … |
| B019 | 268 | 0.390.16 | … | … | 253254 | 82490 | 7.30 |
| B021 | 1021 | 0.050.11 | 3611 | 0.50.2 | 108428 | 12613 | 5.18 |
| B022 | 216 | 0.460.17 | 17012 | 10.91.5 | 615958 | 3139349 | … |
| B023 | 777 | 0.900.10 | 76227 | 26.81.5 | 39211204 | 11244481 | 9.80 |
| B024 | 36 | 0.050.11 | 369 | 1.90.6 | 109129 | 42844 | 6.25 |
| B025 | 19 | 0.10 | 1812 | 0.30.2 | 82728 | 9911 | 5.10 |
| B026 | 010 | 0.000.11 | … | … | 99828 | 24025 | 6.31 |
| B028bbDetected at 70 µm. | 13516517 | 26.313.17 | 1001228321 | 561.877.6 | 16322641265 | 691387623 | 10.75 |
| B029 | 22 | 0.10 | 5516 | 0.80.3 | 594746 | 68071 | 7.10 |
| B032 | 16 | 0.020.13 | … | … | 352492 | 1629184 | … |
| B033 | 96 | 0.070.05 | … | … | 158726 | 31211 | 6.07 |
| B034 | 207 | 0.490.24 | … | … | 141332 | 801123 | … |
| B035 | 2113 | 0.190.15 | … | … | 71660 | 14421 | 5.46 |
| B036bbDetected at 70 µm. | 86242 | 7.090.91 | 6958433 | 165.020.3 | 256601592 | 459364839 | 10.95 |
| B037 | 316 | 0.020.11 | … | … | 137429 | 20622 | 6.00 |
| B038 | 32822 | 1.930.31 | 21613 | 3.70.5 | 71829 | 9210 | 4.53 |
| B040 | 99 | 0.110.14 | … | … | 72655 | 20928 | … |
| B042 | 2711 | 0.300.16 | 26918 | 9.01.3 | 734548 | 1963236 | … |
| B043 | 55 | 0.050.05 | 5413 | 1.50.4 | 314232 | 69225 | 6.98 |
| B044 | 1413 | 0.110.12 | … | … | 74765 | 14720 | 5.31 |
| B045 | 89 | 0.100.13 | … | … | 165830 | 45351 | 6.72 |
| B047 | 486 | 0.860.13 | 8112 | 4.40.7 | 360237 | 158590 | … |
| B048 | 28 | 0.10 | 6215 | 0.60.2 | 288736 | 21622 | 6.17 |
| B049 | 73628 | 3.960.55 | 41416 | 6.40.8 | 309244 | 36240 | 5.88 |
| B051 | 113 | 0.470.18 | … | … | 56242 | 56771 | … |
| B052 | 135 | 0.330.16 | … | … | 117424 | 70880 | … |
| B055 | 216 | 0.440.16 | 16415 | 9.91.4 | 12802118 | 5806590 | … |
| B057 | 521 | 0.030.11 | 12315 | 1.80.3 | 783476 | 84987 | 7.48 |
| B059 | 268 | 0.140.05 | 4313 | 0.70.2 | 208730 | 26911 | 5.93 |
| B062 | 448 | 0.650.19 | 11613 | 4.90.8 | 255432 | 81788 | 7.14 |
| B064 | 2112 | 0.200.13 | 912 | 0.30.3 | 130426 | 28931 | 6.02 |
| B065 | 86 | 0.170.15 | … | … | 60135 | 28736 | 5.84 |
| B066 | 64 | 0.090.07 | 10312 | 5.20.7 | 453647 | 186686 | 8.00 |
| B068 | 10724 | 0.500.16 | 12814 | 1.70.3 | 141426 | 14315 | 5.50 |
| B069 | 134 | 0.290.09 | … | … | 80158 | 44439 | 6.20 |
| B070 | 109 | 0.150.17 | 4913 | 2.20.7 | 122730 | 42160 | 6.65 |
| B072 | 123 | 0.270.08 | 8712 | 5.90.9 | 236929 | 132367 | 7.78 |
| B073 | 18 | 0.09 | 4113 | 0.70.3 | 519533 | 68873 | 7.20 |
| B075 | 911 | 0.090.12 | … | … | 1036457 | 2276238 | 8.57 |
| B076 | 106 | 0.170.13 | … | … | 59133 | 22726 | … |
| B077 | 20 | 0.10 | … | … | 109825 | 12413 | 5.33 |
| B079 | 457671 | 36.273.92 | 23326213 | 533.055.8 | 123665436 | 213332220 | 9.35 |
| B080 | 136 | 0.110.05 | 11817 | 3.00.4 | 637936 | 133544 | 7.59 |
| B081 | 26813 | 2.540.37 | 20010 | 5.50.7 | 86529 | 17819 | 4.97 |
| B082 | 1014 | 0.090.14 | 16022 | 4.20.8 | 660869 | 1317162 | 7.08 |
| B083 | 211 | 0.020.12 | … | … | 85035 | 19622 | 5.89 |
| B085 | 15723 | 0.870.21 | 10730 | 1.70.5 | 68528 | 829 | 4.68 |
| B087 | 2618 | 0.150.12 | 6211 | 1.10.3 | 300830 | 41243 | 6.40 |
| B088 | 65 | 0.050.05 | 3511 | 0.90.3 | 140428 | 29011 | 6.05 |
| B089 | 711 | 0.060.11 | 1410 | 0.40.3 | 76332 | 15417 | 5.58 |
| B091 | 514 | 0.040.11 | 2212 | 0.50.3 | 42533 | 709 | 4.88 |
| B092 | 137 | 0.220.14 | … | … | 68550 | 27535 | 6.06 |
| B093 | 15016 | 1.140.26 | … | … | 51919182 | 85711054 | 9.66 |
| B094 | 7530 | 0.260.13 | 16314 | 1.60.3 | 432147 | 32634 | 6.38 |
| B096 | 78 | 0.100.12 | 359 | 1.50.5 | 79326 | 26930 | 5.94 |
| B098 | 3214 | 0.270.14 | 5314 | 1.30.4 | 57623 | 10412 | 4.82 |
| B100 | 16 | 0.030.12 | … | … | 131827 | 62771 | … |
| B101 | 18 | 0.08 | … | … | 71726 | 688 | 5.34 |
| B102 | 127 | 0.120.07 | … | … | 165626 | 38521 | 6.24 |
| B103 | 4725 | 0.200.12 | 7713 | 0.90.2 | 85932 | 799 | 4.78 |
| B104 | 3126 | 0.130.12 | 8214 | 1.00.2 | 64432 | 566 | 4.47 |
| B105bbDetected at 70 µm. | 3533 | 0.110.12 | 2618 | 0.20.2 | 266430 | 17218 | 5.85 |
| B107bbDetected at 70 µm. | 30 | 0.07 | 12618 | 1.30.3 | 195430 | 14916 | 5.43 |
| B108 | 211 | 0.030.18 | … | … | 755153 | 2580280 | 8.48 |
| B109 | 6 | 0.13 | … | … | 146624 | 790117 | … |
| B112 | 15 | 0.11 | 5517 | 1.20.4 | 165428 | 27230 | 6.27 |
| B115 | 376 | 0.450.09 | 6819 | 2.50.7 | 437936 | 132251 | 7.63 |
| B116 | 96 | 0.190.14 | … | … | 63634 | 29536 | … |
| B117 | 10 | 0.10 | … | … | 49734 | 11114 | 5.29 |
| B118 | 249 | 0.310.15 | … | … | 126726 | 38741 | 6.41 |
| B119 | 15630 | 0.560.16 | 14915 | 1.50.3 | 88930 | 698 | 4.38 |
| B122 | 286 | 0.270.06 | … | … | 135724 | 32114 | 6.27 |
| B123 | 1214 | 0.100.12 | … | … | 76125 | 13715 | 5.55 |
| B124 | 10 | 0.11 | … | … | 62134 | 16520 | 5.50 |
| B125 | 711 | 0.080.13 | … | … | 146229 | 35037 | 6.64 |
| B126 | 520 | 0.030.11 | 1713 | 0.30.2 | 65231 | 769 | 4.94 |
| B127 | 26221 | 1.410.25 | 19912 | 3.10.4 | 143327 | 16818 | 5.70 |
| B128 | 116 | 0.090.05 | 6613 | 1.60.3 | 270533 | 53318 | 6.69 |
| B129 | 88 | 0.110.12 | 10616 | 4.00.8 | 246329 | 71075 | 7.06 |
| B132 | 209 | 0.270.15 | 16420 | 6.21.1 | 1281187 | 3669387 | 8.99 |
| B135 | 205 | 0.200.06 | 5612 | 1.70.4 | 299035 | 74227 | 7.07 |
| B136 | 1189 | 2.490.41 | 6511 | 4.10.9 | 57831 | 28935 | 5.30 |
| B137 | 1021 | 0.050.11 | 1914 | 0.30.2 | 74625 | 829 | 4.84 |
| B139 | 73 | 0.150.08 | 3810 | 2.60.7 | 152126 | 85046 | … |
| B140 | 979 | 1.490.28 | 6313 | 2.80.7 | 67262 | 22532 | 5.53 |
| B141 | 62914 | 6.200.98 | 971750 | 276.337.9 | 136366514 | 292693996 | 10.93 |
| B142 | 207 | 0.110.05 | 2813 | 0.50.2 | 298632 | 42114 | 6.35 |
| B144 | 114 | 0.140.06 | 7715 | 3.00.6 | 260635 | 83231 | 7.33 |
| B145 | 104 | 0.160.07 | 16911 | 8.20.6 | 390549 | 154465 | 7.52 |
| B148 | 714 | 0.050.11 | 4115 | 0.90.4 | 92227 | 16518 | 5.50 |
| B152 | 45 | 0.040.05 | … | … | 281329 | 64922 | 7.01 |
| B154 | 377 | 0.850.27 | … | … | 141429 | 702101 | … |
| B156 | 387 | 0.220.05 | 6717 | 1.20.3 | 245632 | 34711 | 6.12 |
| B159 | 110 | 0.010.11 | 239 | 0.70.3 | 129928 | 32435 | 6.27 |
| B160 | 213 | 0.440.09 | 22512 | 14.51.1 | 994162 | 5216249 | 8.42 |
| B161 | 16 | 0.020.12 | … | … | 209035 | 89096 | … |
| B163 | 105 | 0.120.06 | 13211 | 4.70.5 | 563745 | 164572 | 7.97 |
| B165 | 2719 | 0.160.12 | 4414 | 0.70.3 | 134728 | 16618 | 5.49 |
| B167 | 15 | 0.09 | … | … | 107655 | 9411 | 6.13 |
| B169 | 124 | 0.180.07 | … | … | 108626 | 39220 | 6.46 |
| B172 | 377 | 0.810.22 | … | … | 53533 | 25933 | … |
| B175bbDetected at 70 µm. | 226 | 0.510.18 | … | … | 100727 | 50758 | … |
| B177 | 113 | 0.300.10 | … | … | 162941 | 104663 | … |
| B179bbDetected at 70 µm. | 316 | 0.020.11 | … | … | 232129 | 36238 | 6.33 |
| B182 | 1724 | 0.070.11 | 4815 | 0.60.2 | 109024 | 11212 | 5.04 |
| B183 | 368 | 0.280.07 | 23714 | 5.40.4 | 12674169 | 237099 | 8.16 |
| B184 | 112 | 0.010.13 | … | … | 70737 | 16621 | 5.49 |
| B188 | 9 | 0.11 | … | … | 304630 | 78383 | 7.45 |
| B190 | 28046 | 0.650.17 | 30120 | 2.00.3 | 59727 | 303 | 3.39 |
| B191 | 69724 | 3.980.67 | 574439 | 94.412.9 | 135114689 | 167652269 | 10.33 |
| B192 | 517 | 0.030.11 | … | … | 95425 | 13314 | 5.45 |
| B193 | 1312 | 0.120.12 | … | … | 101426 | 21823 | 5.77 |
| Object ID | SpT | T | Mass | FIR/FBol | aa is the distance to the star assuming a blackbody emitter (Eq. 9), uses the modified blackbody emitter with µm (Eq. 10). | aa is the distance to the star assuming a blackbody emitter (Eq. 9), uses the modified blackbody emitter with µm (Eq. 10). | bbThe mass of dust grains of size , calculated from FIR/FBol using Eq. 13. | |
|---|---|---|---|---|---|---|---|---|
| (K) | (M⊕) | () | (au) | ( au) | (mm) | (M⊕) | ||
| B021 | B0 | 135 | 0.17 | 0.42 | 954 | 2.3 | 0.5 | 13 |
| B022 | B0 | 132 | 1.08 | 2.30 | 994 | 2.5 | 0.5 | 80 |
| B023 | O7 | 127 | 8.25 | 3.28 | 2211 | 5.8 | 1.3 | 1689 |
| B029 | B0 | 118 | 1.82 | 1.95 | 1248 | 3.5 | 0.5 | 134 |
| B042 | B0 | 136 | 1.12 | 2.88 | 933 | 2.3 | 0.5 | 82 |
| B043 | O9 | 125 | 0.71 | 0.57 | 1526 | 4.0 | 0.8 | 83 |
| B047 | O7 | 129 | 0.70 | 0.31 | 2144 | 5.5 | 1.3 | 144 |
| B048 | B2 | 128 | 0.58 | 7.94 | 380 | 1.0 | 0.1 | 10 |
| B059 | O9 | 128 | 0.43 | 0.39 | 1470 | 3.8 | 0.8 | 50 |
| B064 | B0 | 115 | 0.46 | 0.42 | 1316 | 3.8 | 0.5 | 34 |
| B066 | O9 | 129 | 0.88 | 0.86 | 1438 | 3.7 | 0.8 | 104 |
| B072 | O8.5 | 136 | 0.36 | 0.39 | 1432 | 3.5 | 0.9 | 49 |
| B073 | B1 | 116 | 1.73 | 5.63 | 705 | 2.0 | 0.2 | 54 |
| B080 | O8.5 | 127 | 1.38 | 0.95 | 1665 | 4.4 | 0.9 | 187 |
| B082 | B1 | 130 | 1.25 | 8.13 | 559 | 1.4 | 0.2 | 39 |
| B087 | B0 | 128 | 0.61 | 1.08 | 1059 | 2.7 | 0.5 | 45 |
| B088 | O7 | 131 | 0.26 | 0.12 | 2095 | 5.3 | 1.3 | 53 |
| B089 | B1 | 126 | 0.17 | 0.90 | 598 | 1.6 | 0.2 | 5 |
| B096 | B0 | 139 | 0.11 | 0.32 | 893 | 2.1 | 0.5 | 8 |
| B098 | B1 | 153 | 0.05 | 0.93 | 407 | 0.9 | 0.2 | 2 |
| B105ccHas a 70 µm detection. | B2 | 118 | 0.80 | 6.69 | 448 | 1.3 | 0.1 | 14 |
| B107ccHas a 70 µm detection. | B1 | 146 | 0.22 | 2.88 | 445 | 1.0 | 0.2 | 7 |
| B126 | B1 | 131 | 0.12 | 0.81 | 552 | 1.4 | 0.2 | 4 |
| B128 | O9 | 130 | 0.51 | 0.52 | 1413 | 3.6 | 0.8 | 59 |
| B136 | B0 | 157 | 0.05 | 0.29 | 707 | 1.5 | 0.5 | 4 |
| B137 | B1 | 131 | 0.14 | 0.92 | 552 | 1.4 | 0.2 | 4 |
| B139 | O9 | 131 | 0.28 | 0.29 | 1410 | 3.6 | 0.8 | 33 |
| B142 | O8.5 | 118 | 0.90 | 0.42 | 1909 | 5.4 | 0.9 | 123 |
| B148 | B0 | 139 | 0.13 | 0.37 | 893 | 2.1 | 0.5 | 9 |
| B159 | B0 | 126 | 0.29 | 0.46 | 1095 | 2.9 | 0.5 | 21 |
| B182 | B0 | 139 | 0.15 | 0.44 | 895 | 2.1 | 0.5 | 11 |
| Object ID | SpT | T12/24 | Mass | FIR/FBol | aa is the distance to the star assuming a blackbody emitter (Eq. 9), uses the modified blackbody emitter with µm (Eq. 10). | aa is the distance to the star assuming a blackbody emitter (Eq. 9), uses the modified blackbody emitter with µm (Eq. 10). | bbThe mass of dust grains of size , calculated from FIR/FBol using Eq. 13. | |
|---|---|---|---|---|---|---|---|---|
| (K) | (M⊕) | () | (AU) | ( au) | (mm) | (M⊕) | ||
| HR 533 | B1 | 126 | 0.20 | 1.06 | 593 | 1.4 | 0.2 | 16 |
| HR 1191 | B1 | 139 | 0.06 | 0.58 | 488 | 1.3 | 0.2 | 6 |
| HR 1763 | B1 | 120 | 5.68 | 23.17 | 653 | 2.0 | 0.2 | 426 |
| HR 1798 | B2 | 124 | 0.07 | 0.83 | 408 | 1.0 | 0.1 | 3 |
| HR 1855 | B0 | 107 | 0.16 | 0.10 | 1522 | 4.6 | 0.5 | 23 |
| HR 1868 ccKnown reflection nebula. | B1 | 124 | 0.48 | 2.38 | 614 | 1.8 | 0.2 | 39 |
| HR 1931 | O9 | 103 | 2.39 | 0.58 | 2278 | 7.1 | 0.8 | 487 |
| HR 2058 | B1 | 108 | 0.18 | 0.39 | 814 | 2.2 | 0.2 | 11 |
| HR 2734 | B0 | 162 | 0.08 | 0.61 | 664 | 1.2 | 0.5 | 27 |
| HR 5993 ccKnown reflection nebula. | B1 | 137 | 0.06 | 0.57 | 506 | 1.4 | 0.2 | 6 |
| HR 6028 ccKnown reflection nebula. | B2 | 121 | 0.10 | 0.92 | 428 | 1.1 | 0.1 | 4 |
| HR 6165 | B0 | 145 | 1.66 | 6.01 | 831 | 1.9 | 0.5 | 422 |
| HR 6601 | B1 | 130 | 0.08 | 0.52 | 558 | 1.3 | 0.2 | 7 |
| HR 6788 ccKnown reflection nebula. | B1 | 115 | 0.08 | 0.27 | 711 | 2.2 | 0.2 | 6 |
| HR 7993 | B0 | 146 | 0.04 | 0.16 | 814 | 1.7 | 0.5 | 11 |
| HR 8047 ccKnown reflection nebula. | B1 | 150 | 0.02 | 0.33 | 423 | 1.0 | 0.2 | 3 |
| HR 8854 ccKnown reflection nebula. | B0 | 121 | 0.77 | 0.95 | 1188 | 3.2 | 0.5 | 137 |