Dusty OB stars in the Small Magellanic Cloud - II: Extragalactic Disks or Examples of the Pleiades Phenomenon?${\dagger}$${\dagger}$affiliation: This work made use of data from Herschel, which is an ESA space observatory with science instruments provided by European-led Principal Investigator consortia and with important participation from NASA.
Abstract
We use mid-infrared Spitzer spectroscopy and far-infrared Herschel photometry for a sample of twenty main sequence O9–B2 stars in the Small Magellanic Cloud (SMC) with strong 24 m excesses to investigate the origin of the mid-IR emission. Either debris disks around the stars or illuminated patches of dense interstellar medium (ISM) can cause such mid-IR emission. In a companion paper, Paper I, we use optical spectroscopy to show that it is unlikely for any of these sources to be classical Be stars or Herbig Ae/Be stars. We focus our analysis on debris disks and cirrus hot spots. The local, prototype objects for these models are the debris disk around Vega and the heated dust cloud surrounding the stars in the Pleiades, also known as a cirrus hot spot. These two cases predict different dust masses, radii, origins, and structures, but the cleanest classification tools are lost by the poor physical resolution at the distance of the SMC. We also consider transition disks, which would have observable properties similar to debris disks. We begin classification by measuring angular extent in the highest resolution mid-IR images available. We find three out of twenty stars to be significantly extended, establishing them as cirrus hot spots. We then fit the IR spectral energy distributions to determine dust temperatures and masses. Analysis yields minimum grain sizes, thermal equilibrium distances, and the resultant dust mass estimates. We find the dust masses in the SMC stars to be larger than for any known debris disks. The difference in inferred properties is driven by the SMC stars being hotter and more luminous than known debris disk hosts and not in any directly observed dust properties, so this evidence against the debris disk hypothesis is circumstantial. Finally, we created a local comparison sample of bright mid-IR OB stars in the Milky Way (MW) by cross-matching the WISE and Hipparcos catalogs. We find that of the thousands of nearby ( kpc) hot stars in the MW that show a mid-IR excess, only a small fraction (few percent) match the high mid-IR luminosities of the SMC stars. All such local stars in the appropriate luminosity range that can be unambiguously classified are young stars with optical emission lines or are spatially resolved by WISE with sizes too large to be plausible debris disk candidates. We conclude that the very strong mid-IR flux excesses are most likely explained as cirrus hot spots, although we cannot rigorously rule out that a small fraction of the sample is made up of debris disks or transition disks. We present suggestive evidence that bow-shock heating around runaway stars may be a contributing mechanism to the interstellar emission. These sources, interpreted as cirrus hot spots, offer a new localised probe of diffuse interstellar dust in a low metallicity environment.
Subject headings:
ISM: clouds — ISM: dust — Local Group — galaxies: ISM — galaxies: individual (SMC) — stars: infrared1. Introduction
The study of dust around main-sequence stars has made great progress with space-based mid-IR observations, primarily through studies with the Infrared Astronomical Satellite (IRAS) all-sky survey (e.g. Aumann et al., 1984; Backman & Paresce, 1993; Gaustad & van Buren, 1993; Sylvester et al., 1996; Mannings & Barlow, 1998; Rhee et al., 2007), the Spitzer Space Telescope (e.g. Rieke et al., 2005; Beichman et al., 2006; Su et al., 2006; Chen et al., 2006; Carpenter et al., 2006; Hillenbrand et al., 2008; Gáspár et al., 2008; Rebull et al., 2008; Trilling et al., 2008; Carpenter et al., 2009; Dahm & Carpenter, 2009; Morales et al., 2009; Moór et al., 2011), and the Herschel Space Observatory (e.g. Eiroa et al., 2010, 2011; Matthews et al., 2010; Sibthorpe et al., 2010; Vandenbussche et al., 2010; Acke et al., 2012; Wyatt et al., 2012; Ertel et al., 2012; Gáspár et al., 2013; Booth et al., 2013; Broekhoven-Fiene et al., 2013; Eiroa et al., 2013). Several types of dusty objects around stars can produce comparable observational signatures, but the improved spatial resolution of Spitzer compared to IRAS and a number of high-resolution tools (e.g. Hubble Space Telescope imaging of reflection nebulae, coronographic imaging, and interferometry in the optical through sub-mm) (e.g. Kalas et al., 2002, 2005, 2007; Stark et al., 2009) have built up large classes of physically distinct sources. Four prominent types of objects are found in surveys of main-sequence and younger stars: (1) debris disks (e.g. Wyatt, 2008), (2) patches of overdense ISM heated by nearby stars (van Buren & McCray, 1988, hereafter called cirrus hot spots), (3) protoplanetary and protostellar disks around pre-main sequence objects and young stars (e.g. Williams & Cieza, 2011), and (4) classical Be stars, which have an excreted gaseous disk powered by free-free emission (e.g. Gehrz et al., 1974; Collins, 1987; Cote & Waters, 1987; Waters et al., 1987; Porter & Rivinius, 2003). The cirrus hot spots are of two types: 1) nearly static arrangements of overdense gas (coined as the Pleiades phenomenon by Kalas et al., 2002) or 2) high velocity interactions where the emission is enhanced in a bow shock (Kalas et al., 2007; Hines et al., 2007; Gáspár et al., 2008; Debes et al., 2009; Martínez-Galarza et al., 2009).
The primary discriminating observations for nearby samples are spatial extent for the first two categories, signs of accretion such as H emission and age estimates since protoplanetary disks have lifetimes of a few Myrs for the third, and the unique spectral energy distribution (SED) shape from free-free radiation and H emission for the fourth. Many claims of IRAS-discovered debris disks have been overturned with higher resolution imaging as instead cirrus hot spots (Kalas et al., 2002; Gáspár et al., 2008; Martínez-Galarza et al., 2009), but the ambiguity for nearby (100 pc) stars with the latest data is minimal. Finally, there will be a small number of objects outside of our four classes, such as proplyds, where the irradiated matter does not surround the star but is seen in projection. Ori, discussed in Section B.2, is one such example. However, these objects should be rare and often identifiable by H emission.
This work seeks to better understand the nature of an intriguing set of dusty objects in the Small Magellanic Cloud (SMC) identified by the Spitzer Survey of the SMC (S3MC; Bolatto et al., 2007). Bolatto et al. (2007) found 193 OB stars in the SMC that show strong mid-IR excesses from the full population of 3800 O9–B3 stars. A subsample of 125 from the 193 dusty OB stars were observed by (Sheets et al., 2013, hereafter Paper I) with optical spectroscopy, and 87 (70%) were established as main-sequence stars. We have obtained both deep far-IR photometry and mid-IR spectra for 11 of these 87 stars, and mid-IR spectra alone for an additional 9. The advantage of this sample is that we can study dusty clouds and disks in a much more metal-poor environment than locally, but the challenge is that some of the best classification tools are impossible at the SMC distance. The observations in Paper I have shown that the majority of this sample and all the sources studied in this work are truly main-sequence stars and ruled out classifications as classical Be (Miroshnichenko & Bjorkman, 2000; Porter & Rivinius, 2003) or Herbig Ae/Be stars (Hillenbrand et al., 1992; Waters & Waelkens, 1998) by the absence of Balmer emission. We are left with debris disks, transition disks, and cirrus hot spots as the most viable explanations.
The SMC dusty OB stars share many observational characteristics of debris disks. The first debris disk detection was in Lyrae (Vega) with IRAS (Aumann et al., 1984). Since then, Piscis (Fomalhaut, Holland et al., 1998), Pictoris (Backman, 1996), and Eridani (Greaves et al., 2005) have joined Vega as debris disk prototypes. The definitive observation necessary to secure a candidate is to resolve the disk in imaging and, with temperature and age information, establish that the reradiating particles are not from the primordial disk but have been replenished through collisions. The first such confirmation was by Smith & Terrile (1984) for Pictoris, and spatially resolved observations of Vega followed (Harvey et al., 1996). Unfortunately, spatially resolved observations at the distance of the SMC are not feasible with current instruments, so we must turn to other, less direct methods to infer the nature of the SMC sample. Even observations with the forthcoming Mid-Infrared Instrument on the James Webb Space Telescope would only provide 07 (21,350 AU radius) resolution at 20 m and be unable to resolve SMC debris disks. Comprehensive Spitzer studies of debris disks have focused on A stars (Rieke et al., 2005; Su et al., 2005) and FGK stars (Chen et al., 2005, 2006; Hillenbrand et al., 2008; Moór et al., 2011) or both (Carpenter et al., 2006, 2009). One recent study does examine more massive stars (3 M M 10 M⊙; Chen et al., 2012) with B8 as the earliest type found hosting a debris disk. The frequency of debris disk detections drops at ages beyond 50 Myr, but appears nearly flat for stellar types A–K at younger ages (Wyatt, 2008).
Transition disks are another source class that may represent some or all of the SMC stars. Transition disks were first discovered by Skrutskie et al. (1990) with IRAS data. Transition disks are thought be a phase between protoplanetary disks and debris disks where the star has photoevaporated the gas throughout the central tens of AU in the disk. The classical T Tauri star TW Hya can be considered a prototype object for transition disks (Calvet et al., 2002). For many of the properties relevant to our study, transition disks will have similar properties to debris disks. They may have vast sizes around massive stars. The key feature for transition disks is understanding how rapidly they are destroyed and what remnants they leave behind. We will discuss the results from numerical simulations in Section 4.3, which inform that understanding.
Alternatively, it is also possible that these SMC stars are surrounded by cirrus hot spots. The reflection nebula in the Pleiades star cluster is the prototypical cirrus hot spot (Arny, 1977; Kalas et al., 2002; Gibson & Nordsieck, 2003a, b). We note that debris disks have also been found around some stars in the Pleiades cluster (Gorlova et al., 2006; Sierchio et al., 2010), so the two phenomena are not mutually exclusive. The observable properties of cirrus hot spots have considerable overlap with debris disks (Backman & Paresce, 1993). The study by Gaustad & van Buren (1993) compiled stars with mid-IR excess in IRAS data and by analyzing 1753 hot stars, found that 302 show extended emission characteristic of cirrus hot spots. Common properties for the cirrus hot spots are halos that extend from 1,000 to 100,000 AU from the star, dust masses of order 1 to 100 M⊕, temperatures of order 100 to 150 K, and luminosities relative to the star of (properties based on one K dwarf, two G dwarfs, and three late-B dwarfs; Kalas et al., 2002). For comparison, debris disks parent bodies commonly extend from 10 to several hundred AU while some cases contain a halo of small grains out to 1,000 AU, dust masses that range from 10-3 to a few Earth masses, cold component temperatures from 50 to 100 K, and luminosities relative to the star of (Backman & Paresce, 1993; Chen et al., 2006; Carpenter et al., 2009; Krivov, 2010). Some debris disks also show a warm component with a temperature of 200K (Morales et al., 2011). The larger mass estimates generally come from submillimeter data, and analysis of the mid-IR range generally implies 10-1 M⊕ for debris disks. The population of dusty OB stars in the SMC is rather rare. Bolatto et al. (2007) find that there are 3800 O9–B3 stars in the SMC, and only 193 show strong mid-IR excesses. 70% of these are normal, main-sequence stars (Paper I), so any explanation must only explain an occurrence fraction of 2–4% in massive stars. The incidence of cirrus hot spots in the MW around massive stars (17%; Gaustad & van Buren, 1993) is more than enough to explain this occurrence rate. How the SMC may be different is still uncertain. Cirrus hot spots in the SMC might be expected to be fainter than the MW ones based on the SMC’s lower dust-to-gas ratio (10 lower; Leroy et al., 2007). However, the Local Bubble is also underdense and still contains many cirrus hot spots (Kalas et al., 2002). The relative number of debris disks and cirrus hot spots, even in the MW, is not well determined for the range of hot stars (O9–B3) present in our S3MC subsample.
In this work, we seek to better characterize the properties of these dusty OB stars and discriminate between the debris disk and cirrus hot spot models with new data and a large, newly collected local sample including information on spatial extent. We start by describing the photometric and spectroscopic data in Section 2. The angular extent of the dust is measured in three out of twenty of the stars. This permits their classification as cirrus hot spots, but the classification of the remaining seventeen is uncertain. Next, we fit simple models with dust emission to the spectral energy distributions in Section 3. We collect literature and catalog data for local sources that may serve as analogs in Section 4. In Section 5, we discuss whether the evidence favors either of the proposed models. The SMC stars stand out in mid-IR color from any published lists of debris disks or cirrus hot spots, but a sample of nearby early-type stars from the Hipparcos and Wide-field Infrared Survey Explorer (WISE) catalogs does match the SMC stars. Finally, we present our conclusions in Section 6. All magnitudes and colors listed are in the Vega system, and we have assumed an SMC distance of 61 kpc throughout (Weldrake et al., 2004). All images are displayed with equatorial North up and East to the left.
2. Observational Data
We present new data and review old data on a subset of stars that Paper I classify as main sequence O9–B2 stars. We selected the sample for mid- and far-IR followup observations by requiring a flux cut of Jy, the sources to be unresolved in the 24m imaging, no H detections in narrow-band imaging to be present, and minimal excess at 8m in the IRAC bands. Figure 16 of Paper I shows the distribution of relative fluxes for all the dusty SMC sources, and the sources we study here fall in the two central bins. Our subsample ought to represent the most compact and coolest dusty OB stars in the SMC. The basic properties of our targets are listed in Table 1, with more details on the columns given in Section 2.5.
2.1. Spitzer Photometry
Photometry is measured with data taken by the Spitzer Space Telescope (Werner et al., 2004a). Bolatto et al. (2007) have described the observations from the Infrared Array Camera (IRAC; Fazio et al., 2004) and the Multiband Imaging Photometer for Spitzer (MIPS; Rieke et al., 2004). We have examined new peak-up images at 16 m taken with the Infrared Spectrograph (IRS Houck et al., 2004) as part of the GO program 50088 (P.I. J. Simon). These images are analyzed for their spatial extent and discussed in Section 2.2. IRAC and MIPS 24 m photometry are taken from Paper I, where the combined catalog for S3MC (Bolatto et al., 2007) and SAGE-SMC (Gordon et al., 2011) observations is used for the best depth. The catalogs were produced with point spread function (PSF) photometry from MOPEX (Makovoz & Marleau, 2005). None of our sources are detected in the MIPS 70 m band to the catalog’s faint flux limit of 35 mJy for unresolved sources.
| ID No. | Spectral | A(V)SMC | MV | amin | Herschel | Resolved | |||
|---|---|---|---|---|---|---|---|---|---|
| (J2000) | (J2000) | Type | (mag) | (mag) | (mm) | Observation? | at 16 m? | ||
| B004 | 11.40574 | 73.21014 | O9 | 0.25 | 4.10 | 0.95 | 0.13 | Y | N |
| B009 | 11.73266 | 73.08136 | B0B2 | 0.07 | 3.87 | 0.43 | 0.06 | Y | N |
| B011 | 11.73879 | 73.30242 | … | 0.06 | 2.95 | 0.43 | 0.06 | Y | N |
| B014 | 11.82917 | 73.11972 | B0B2 | 0.07 | 4.52 | 0.43 | 0.06 | Y | N |
| B021 | 11.92833 | 73.00271 | B0 | 0.22 | 5.00 | 0.52 | 0.07 | N | N |
| B024 | 11.95000 | 73.07528 | B0B2 | 0.06 | 3.56 | 0.43 | 0.06 | Y | N |
| B026 | 11.96667 | 73.35611 | B0B2 | 0.08 | 3.93 | 0.43 | 0.06 | Y | N |
| B029 | 12.04036 | 73.40363 | B0 | 0.17 | 5.04 | 0.52 | 0.07 | Y | Y |
| B034 | 12.12513 | 73.30265 | B0 | 0.09 | 3.14 | 0.52 | 0.07 | N | N |
| B087 | 13.25087 | 72.67440 | B0 | 0.00 | 4.63 | 0.52 | 0.07 | Y | Y |
| B096 | 13.50825 | 72.70609 | B0 | 0.00 | 3.68 | 0.52 | 0.07 | N | N |
| B100 | 13.72685 | 72.53598 | B1 | 0.07 | 3.36 | 0.43 | 0.06 | N | N |
| B102 | 13.76366 | 72.92260 | O9 | 0.09 | 4.43 | 0.95 | 0.13 | N | N |
| B137 | 14.74641 | 72.74281 | B1 | 0.09 | 4.91 | 0.43 | 0.06 | N | N |
| B148 | 15.22989 | 72.13463 | B0 | 0.03 | 4.47 | 0.52 | 0.07 | N | N |
| B154 | 15.67326 | 72.01004 | B1 | 0.14 | 3.38 | 0.43 | 0.06 | Y | N |
| B159 | 15.75023 | 72.46061 | B0 | 0.00 | 4.13 | 0.52 | 0.07 | N | N |
| B182 | 16.22062 | 71.91369 | B0 | 0.00 | 4.98 | 0.52 | 0.07 | Y | N |
| B188 | 17.05033 | 71.97593 | OBe? | 0.01 | 3.97 | 0.95 | 0.13 | Y | Y |
| B193 | 19.19872 | 73.14434 | B0 | 0.29 | 4.53 | 0.52 | 0.07 | N | N |
Note. — The spectral types in column 4 are estimated from optical spectroscopy in Paper I and determine the stellar parameters. For the O9, B0, and B1 stars we consider, the masses are 20.3, 17.5, and 14.2 M⊙, the luminosities are 11.1104, 5.3104, and 3.6104 L⊙, the radii are 8.0, 7.4, and 6.5 R⊙, and the temperatures are 3.7104, 3.2104, and 3.1104 K, respectively. We have made the small corrections due to MW and SMC extinction as described in the text. The V-band absolute magnitudes for O9, B0, and B1 stars in Schmidt-Kaler (1982) are -4.25, -4.0, and -2.07, and the match to the observed values in column 6 provide confidence that the stars are all dwarfs. In column 7, amin is the minimum grain size that can remain stable around the star against radiation pressure. Column 8 lists whether the star was observed with Herschel. Column 9 states if the mid-IR emission was found to be significantly extended in the IRS peak-up image. If so, it is too large to be a debris disk.
The broadband data need color corrections since our SED fits are made to data
evaluated at discrete wavelengths.
We show that the corrections are small and the exact values
adopted are unimportant to our results. Tabulated color corrections exist for power-law functions and
single-temperature blackbodies. There is no simple color correction for us to make over all the
wavelengths our data span, so we make a piecewise correction. We fit the data with high-temperature
blackbodies for the stellar photospheres and modified and straight blackbody functions
for the mid-IR excess (Section 3), which
commonly have temperatures of 100 K and relative IR to bolometric flux ratios of 10-4.
We therefore split into three wavelength ranges for the purpose of color correction:
at 15 m a Rayleigh-Jeans function representing the stellar photosphere is used,
for 15 m and 30 m a 100 K blackbody is used, and finally a
power law function with f is used at 30 m as the Rayleigh-Jeans
regime for the dust, which radiates inefficiently under an assumed emissivity of .
In Section 3, we make fits with both an unmodified blackbody function and with an
emissivity of , so this evaluation for the color correction is a compromise with
differences too small to make an impact on our results. We have taken color corrections from Table 4.4 of the IRAC Instrument
Handbook111http://irsa.ipac.caltech.edu/data/SPITZER/docs/irac/
iracinstrumenthandbook/1 and list them in Table 2. The 24 m color correction is from
the MIPS Instrument Handbook222http://irsa.ipac.caltech.edu/data/SPITZER/docs/mips/
mipsinstrumenthandbook/1. The effect of choosing corrections for
different spectral shapes on the final results is smaller than the statistical uncertainties.
| Band | Effective | Aperture | Color |
|---|---|---|---|
| (m) | Correction | Correction | |
| IRAC 1 | 3.550 | …**These data were fit with PSF photometry instead of aperture photometry. Aperture corrections were made internally in MOPEX, but they are not meaningful to list without a full description of the PSF and thus not listed here. See Bolatto et al. (2007) for details. | 1.0111 |
| IRAC 2 | 4.439 | …**These data were fit with PSF photometry instead of aperture photometry. Aperture corrections were made internally in MOPEX, but they are not meaningful to list without a full description of the PSF and thus not listed here. See Bolatto et al. (2007) for details. | 1.0121 |
| IRAC 3 | 5.732 | …**These data were fit with PSF photometry instead of aperture photometry. Aperture corrections were made internally in MOPEX, but they are not meaningful to list without a full description of the PSF and thus not listed here. See Bolatto et al. (2007) for details. | 1.0115 |
| IRAC 4 | 7.872 | …**These data were fit with PSF photometry instead of aperture photometry. Aperture corrections were made internally in MOPEX, but they are not meaningful to list without a full description of the PSF and thus not listed here. See Bolatto et al. (2007) for details. | 1.0337 |
| MIPS 1 | 23.68 | …**These data were fit with PSF photometry instead of aperture photometry. Aperture corrections were made internally in MOPEX, but they are not meaningful to list without a full description of the PSF and thus not listed here. See Bolatto et al. (2007) for details. | 0.947 |
| PACS 1 | 70.00 | 0.701 | 1.04 |
| PACS 3 | 160.0 | 0.759 | 1.14 |
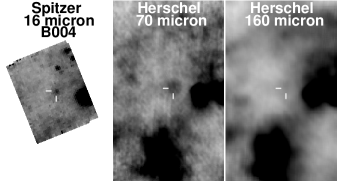
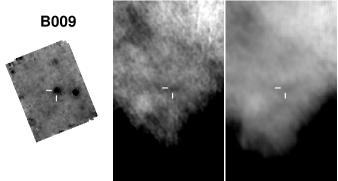
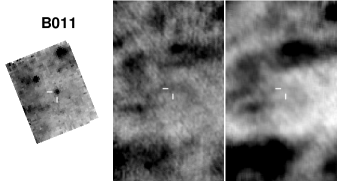
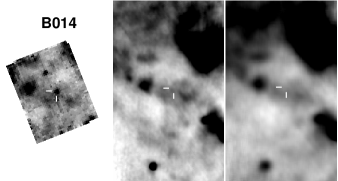
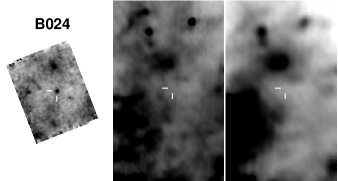
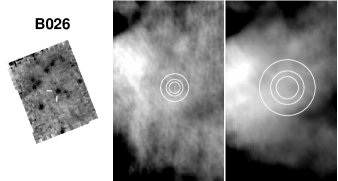
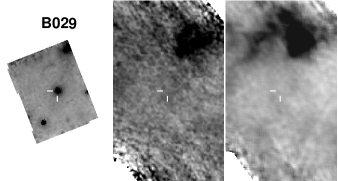
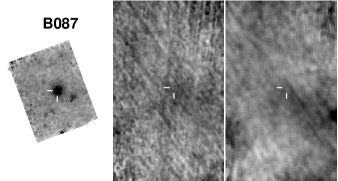
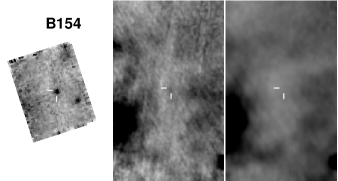
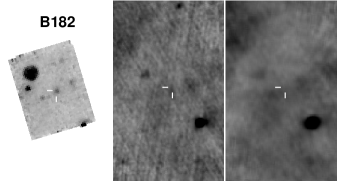
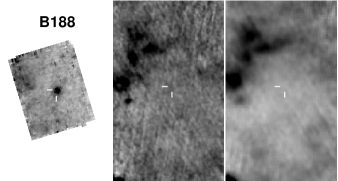
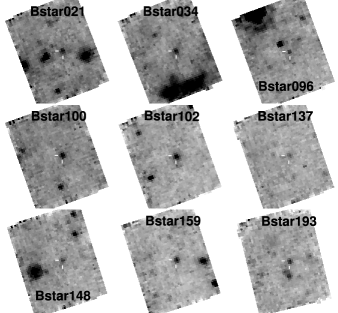
2.2. 16 m Peak-up Images
The 16 m peak-up images were taken since the camera has the best resolution available () at wavelengths where the dust emission dominates. A 6-position dither pattern was cycled for total exposures of 30 s per star. The images are shown in Figures 1 and 2. We have made detections and measurements on the images with SExtractor (Bertin & Arnouts, 1996). We use the Kron aperture () as the metric to determine angular extent. The Kron aperture is a circle with the same first moment as the light profile and a scaling factor. SExtractor uses the factor to enclose 96% of an object’s flux. Kron (1980) notes that the first moment of the light profile is approximately the size of the half-light radius, so our reported radii will be 2.5 half-light radii.
We have fit the appropiate point-response-function (PRF) image in the same manner. The
PRF with the standard pixel scale, dated Feb. 2009, was used333http://irsa.ipac.caltech.edu/data/SPITZER/docs/
irs/calibrationfiles/peakuppsfprf/. We measure for the PRF, which we subtract
in quadrature to determine the intrinsic stellar values (). The determination of
size in the peak-up images is dominated by the photon-noise with a
median error of 5″, which is roughly one pixel when convolved with
the PRF. We find three
stars that are significantly extended () after
correcting for the PRF: B029 with ,
B087 with , and B188 with . These
sources have dust clouds of size 3 pc, which makes them far larger than debris disks. The
size constraints on the remaining sources are not small enough to determine their nature. The extended objects
are flagged by column 9 in Table 1.
2.3. Spitzer Spectroscopy
A subset of 23 stars from the Paper I sample of main sequence OB stars were observed in low-resolution mode with the IRS in guest observer (GO) program 50088. Two stars, B083 and B161, are not analyzed here as they are spatially resolved at the IRS resolution. B161 also has a complicated background from a bright, nearby source. One star, B112, had insufficient signal-to-noise (S/N), so we present the 20 others. The IRS observed all sources in staring mode using just the Long-Low (LL) module, which produces spectra with wavelength coverage from 14 to 35 m. The exposure time was tailored to achieve S/N 5 based on the measured 8 and 24 m fluxes of the sources.
We generated the spectra using optimal extraction (Lebouteiller et al., 2010), which reduces the impact of noise in pixels not exposed to the core of the point-spread function from the source. The starting point was the S18.5 version of the pipeline from the Spitzer Science Center (SSC). We observed all sources in both the first- and second-order LL apertures. For most targets, the image with the source in the other nod position in the same aperture served as the background, but in some cases, complex backgrounds forced us to use images with the source in the other aperture as the background. Images were cleaned of known rogue pixels and pixels flagged by the pipeline as bad using software similar to the IRSclean code available from the SSC. Spectra were extracted from coadded images in each nod position. Where necessary, a polynomial was fit to the background in the spatial direction, at each wavelength, to better isolate the spectral emission from the source. When spectra from the separate nods were combined, sharp features (such as spikes and divots) in one spectrum but not present in the other were ignored. The spectra combined from the two LL orders were calibrated using similarly observed and processed spectra of the standard stars HR 6348 (K0 III) and HD 173511 (K5 III). We tested tapered-aperture algorithms in place of the adopted optimal-extraction one and found no significant differences.
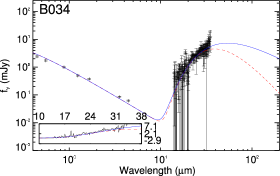
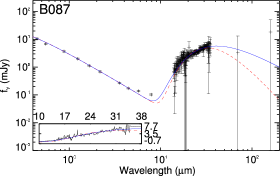
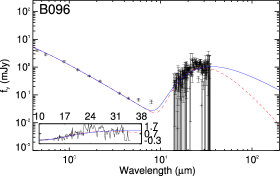
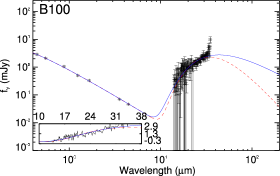
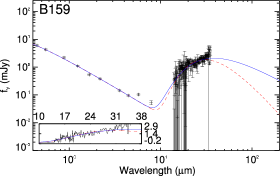
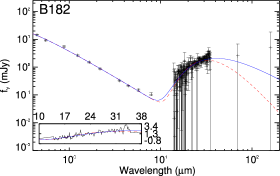
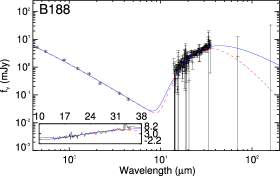
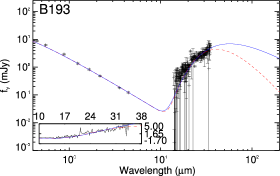
The spectra were taken with the goal of better determining spectral slopes for temperature measurements and not to obtain a S/N sufficient to reveal any detailed spectral structure related to the chemical composition of the dust (e.g. Chen et al., 2006). Dahm & Carpenter (2009) find that B and A stars with debris disks show featureless continua at unlike later-type stars with prominent silicate absorption at 10 m and 20 m, making it unlikely that these SMC stars would possess strong spectral features even with deeper data. IRS spectra for cirrus hot spots are not available in large numbers, but we can guide our expectations from the spectra of reflection nebulae (Werner et al., 2004b; Sellgren et al., 2007). Boersma et al. (2010) attempt to identify the PAH emission features in reflection nebulae and other sources from 15–20 m and find that the strongest features are at 16.4, 17.4, and 18.9 m. The features show large variation of strength with position. There is not a conclusive chemical identification of the carriers for these features, and they are much weaker than the better known PAH features from 5–15 m. They are weak enough that we should not detect them in our individual IRS spectra, but some of the stronger regions of emission might barely be detectable in a stack. We searched our data with fits to various templates for (PAH) features, emission lines, and specific grain spectra with the PAHFIT software (Smith et al., 2007) and found no significant features in any spectra, nor in an optimally weighted stack of all the spectra. Table 3 presents a brief observing log, and the LL spectra appear as insets in Figure 3.
| ID | Start | Exposure | fν**Values are averages over 20 m–30 m. | S/N**Values are averages over 20 m–30 m. |
|---|---|---|---|---|
| Date (UTC) | Time (s) | (mJy) | pixel-1 | |
| B004 | 2008-12-07 | 609.5 | 2.44 | 5.0 |
| B009 | 2008-12-08 | 243.8 | 3.63 | 4.2 |
| B011 | 2008-12-08 | 365.7 | 2.15 | 4.2 |
| B014 | 2008-12-08 | 487.6 | 4.10 | 6.0 |
| B021 | 2008-12-07 | 1462.8 | 1.16 | 2.9 |
| B024 | 2008-12-07 | 1219.0 | 1.12 | 2.9 |
| B026 | 2008-12-07 | 1097.1 | 1.09 | 3.4 |
| B029 | 2008-12-08 | 121.9 | 7.09 | 6.6 |
| B034 | 2008-12-07 | 731.4 | 2.87 | 2.4 |
| B087 | 2008-12-08 | 243.8 | 4.25 | 5.8 |
| B096 | 2008-12-03 | 2438.0 | 1.04 | 2.3 |
| B100 | 2008-12-07 | 853.3 | 1.59 | 4.1 |
| B102 | 2008-12-07 | 487.6 | 2.18 | 4.8 |
| B137 | 2008-12-02 | 2560.0 | 0.87 | 3.0 |
| B148 | 2008-12-06 | 1584.7 | 1.00 | 2.9 |
| B154 | 2008-12-07 | 609.5 | 1.27 | 1.4 |
| B159 | 2008-12-07 | 731.4 | 1.58 | 5.3 |
| B182 | 2008-12-06 | 1097.1 | 1.67 | 3.3 |
| B188 | 2008-12-08 | 243.8 | 3.75 | 4.3 |
| B193 | 2008-12-06 | 1584.7 | 2.23 | 3.8 |
2.4. Herschel Photometry
We use observations taken with the European Space Agency’s (ESA) Herschel Space Observatory (Pilbratt et al., 2010) and its Photometer Array Camera and Spectrometer (PACS) instrument (Poglitsch et al., 2010). The observations were taken during program cycle OT1 (P.I. J. Simon) with 9 hours on 11 targets in the 70 m and 160 m bands as mini scan maps under median scan speed with four 4′ scan legs and 2″ cross-scan steps. Integration times were chosen so as to be able to detect the emission at 5 significance at 70 m if half of the mid-IR excess were coming from cold (55K) dust.
The data were reduced to level 1 with the Herschel Interactive Processing Environment (HIPE) v.8.0 developer build 3459 (Ott, 2010) using the PACS calibration tree 32. Apart from the standard reduction steps, we applied ‘ level deglitching’ to remove outliers in the time series data (‘time-ordered’ option) by -clipping (25 threshold) the flux values which contribute to each pixel. Based on the level 1 data, we have generated final level 2 maps using Scanamorphos version 16 (Roussel, 2012) with the ‘minimap’ keyword. We used a final map pixel scale of 1″ at 70 m and 160 m.
The color corrections were taken from Poglitsch et al. (2010), and the aperture corrections for
radii of 6″ and 12″ in the 70 m and 160 m bands are gathered
from the PACS Observer’s Manual444herschel.esac.esa.int/Docs/PACS/pdf/pacs_om.pdf and
listed in Table 2. During the reductions, the
plate scales were resampled to 1″ pixel-1 from the native
32 and 64 scales of the blue and red channels. The pipeline calculates the
photon shot noise and detector noise, but because the data is resampled, the
noise map is correlated. Flux measurements must consider this as a correlation correction term that
scales up the total variance over an aperture in the noise map.
We follow the formalism from the WISE
Supplement555http://wise2.ipac.caltech.edu/docs/release/allsky/expsup/
sec2_3f.html to estimate the correlation corrections for this resampled data.
Under the assumption of a Gaussian point-spread function and
Herschel parameters, this correction evaluates to 69.6 and 278.5 for the
blue and red bands. We use background subtraction annuli of radii from 9″ to 15″ and
18″ to 30″ for the blue and red bands, respectively. We measure source flux in
apertures of 6″ and 12″ for the 70 m and 160 m bands.
Since the fields are not entirely uncrowded, we carefully consider the background measured in the annulus. We found all 5 significant point sources in the image other than our target after smoothing the images with the point spread functions, and if close we masked the overlap of the sky annulus and the contaminating sources. By adjusting the precise values of the sky annulus size, we found only small changes consistent with the errors. We only detect one source with meaningful significance, but the upper limits for the others still add useful constraints to the dust temperature. The only significant detection is at 3.4 in the 70 m band for source B004. The 11 SMC sources were chosen to be outside of obvious star clusters and outside the halos from luminous neighbors based on the MIPS 70 m data. We make estimates of the confusion noise from each image for this reason.
The confusion noise is found in the images themselves by identifying all point sources, laying down randomly placed, non-overlapping apertures that did not intersect the point sources out to their background annuli, and finding the excess variance above the Poisson uncertainies. This error estimate corrects for faint, unresolved point sources in the background and extended dust emission. Most of the 160 m data go deep enough to have significant confusion noise, but only one of the 70 m images with a long exposure is affected by confusion. We list the corrected photometric measurements in Table 4 with the error budget broken into two components. The first component follows from the values in the uncertainty maps under the apertures and sky annuli, and the second is from confusion. The total error follows by combining them in quadrature.
| Object | Start | Exposure | 70 m | 160 m | ||||
|---|---|---|---|---|---|---|---|---|
| Date (UTC) | Time (s) | Flux | Flux | |||||
| (mJy) | (mJy) | |||||||
| B004 | 2011-07-23 | 2200 | 24.8 | 7.4 | 0 | 17 | 24 | 58 |
| B009 | 2011-07-23 | 1080 | 10.1 | 9.1 | 0 | 17 | 34 | 0 |
| B011 | 2011-07-23 | 1528 | 7.5 | 8.3 | 0 | 33 | 28 | 33 |
| B014 | 2011-07-23 | 1752 | 7.7 | 8.5 | 0 | 78 | 30 | 84 |
| B024 | 2011-07-23 | 5560 | 15.9 | 4.9 | 7.7 | 0**The formal flux measured is a large negative value due to the contamination from several bright, nearby sources in the sky annulus. By using larger sky annuli, we do not find a significant detection. Therefore, we have set this flux measurement to zero to avoid biasing the derived properties. | 16 | 35 |
| B026 | 2011-07-23 | 6680 | 1.3 | 4.3 | 0 | 22 | 13 | 91 |
| B029 | 2011-02-25 | 184 | 2.9 | 20.7 | 0 | 4 | 72 | 0 |
| B087 | 2011-07-23 | 856 | 3.7 | 11.3 | 0 | 21 | 37 | 0 |
| B154 | 2011-07-23 | 1006 | 4.3 | 6.2 | 0 | 41 | 19 | 0 |
| B182 | 2011-07-23 | 5336 | 2.9 | 4.9 | 0 | 6 | 15 | 0 |
| B188 | 2011-07-23 | 856 | 2.7 | 11.5 | 0 | 25 | 37 | 0 |
Note. — The flux measurements are listed with two error estimates. The first contains the read noise and shot noise uncertainties from the circular aperture and the sky annulus. The second describes the confusion noise, if a significant value is measured from the image. The values are added in quadrature to make a total error estimate.
Based on brighter point sources in the images, we determine that there is an astrometric offset to the images that correlates with the scan angle. The PACS Observer’s Manual states that 2″ absolute astrometry errors can be expected, but we find offsets of 41 and 07 along the long and short scan axes, respectively. We measure aperture photometry using the corrected astrometry.
2.5. Ancillary Data
Paper I has already presented optical through near-IR photometry for these stars. The original sources are the OGLE II survey (Udalski et al., 1998), the Magellanic Clouds Photometric Survey (Zaritsky et al., 2002), and 2MASS (Skrutskie et al., 2006). We have also taken the stellar temperature subtype as determined from optical spectra in Paper I. One star, B011, was not classified in Paper I because of insufficient S/N. Based on the average type of the whole sample, we have assigned it a B1 type in the following computations. This is compatible with the photometrically derived stellar temperature. We have also given B188, a star potentially with weak emission lines, an O9 type. We based the stellar properties off the spectral types in column 4 of Table 1. The masses, luminosities, radii, and temperatures are interpolations from the the table for zero-age main sequence stars in Schmidt-Kaler (1982). We have corrected the optical and near-IR data for the A MW extinction near the SMC (Schlegel et al., 1998) with the reddening curve of Cardelli et al. (1989). We measured the remaining reddening from the B and V bands, and further corrected the data with the SMC reddening curve of Bouchet et al. (1985). The stars were selected to be on the main-sequence by their luminosities, but there may be some contamination by giants. There are external spectral classifications for three stars. Evans & Howarth (2008) classify B021 as B1–2II and B137 as B1–3II, although they flag both as uncertain. Hunter et al. (2008) classify B100 as B0.5V. However, we give the dust-corrected, absolute V-band magnitudes in column 6 of Table 1, and they are all consistent with being dwarfs.
3. SED Fitting for Different Models
We now extract physical quantities by fitting the spectral energy distributions (SEDs). The functional forms for the various fits are justified below. The most likely candidate models are debris or transition disks, where the dust has a circumstellar origin, and cirrus hot spots, where the dust has an interstellar origin. Classical Be and Herbig Ae/Be models have already been excluded by the optical spectra in Paper I. The cirrus hot spot models can be further subdivided into two types. The vast cloud of glowing dust around the Pleiades is the prototype for relatively static hot spots. Cases of stars moving at high velocities and compressing ISM material into a bow shock are also well known. We follow the calculations developed by Artymowicz & Clampin (1997) to model such a situation. The primary difference between the interacting and static hot spots is that small dust grains, which would normally be blown out from the system by radiative forces, can be retained and emit at higher temperatures in interacting systems. In low velocity cases, the two hot spot models converge. The models for debris disks and static hot spots have already been discussed in Paper I. For the ease of the reader, we have summarized their justification and discussion in Appendix A. The properties derived from debris disk and static cirrus hot spot models are given in Table 5. The tabulated parameters are not exactly the same as those given in Paper I because we have used the additional data presented in Section 2 to determine them, but the properties are generally in agreement.
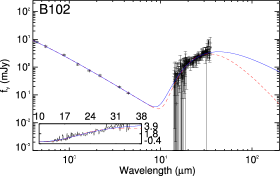
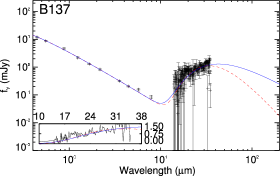
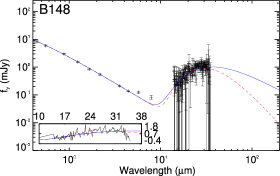
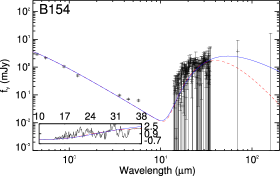
The forms we use to fit the SEDs are blackbody (BB) and modified blackbody (MBB) functions. Both functions fit the IRS data equally well, and the MBB function, appropriate for hot spot models, naturally delivers lower dust temperatures. Both models fail for some stars to fit the IRAC data well, which drives the reduced marginally above its expected value for statistical errors alone ( with a standard deviation of for N degrees of freedom). These poor fits are likely caused by the simple assumptions in our models, but could also be caused by a small underestimate of our uncertainties. Specifically to the cirrus hot spot models, stochastic heating of small grains may be causing some of the near-IR excess we see in the 5.8 and 8.0 m bands, but we have not included it in our modeling. Stochastic heating has been observed in reflection nebulae from 1–20 m (Sellgren, 1984; Sylvester et al., 1997). Strong PAH features may be present in the IRAC bands as well. The one Herschel detection at 70 m is also in excess of our fits.
| Debris Disk Model | Static Cirrus Hot Spot Model | |||||||||||||||||
|---|---|---|---|---|---|---|---|---|---|---|---|---|---|---|---|---|---|---|
| ID No. | Tdust | Ldisk/L∗ | RBB | Mmin | Tdust | Ldisk/L∗ | RMBB | Mdust | ||||||||||
| (K) | (10-4) | (102 AU) | (M⊕) | (K) | (10-4) | (105 AU) | (M⊕) | |||||||||||
| B004 | 100.2 | 0.8 | 4.6 | 0.3 | 27.0 | 1.4 | 654 | 121 | 5.1 | 75.7 | 0.5 | 3.5 | 0.2 | 2.0 | 0.1 | 10.3 | 0.6 | 5.1 |
| B009 | 94.8 | 0.9 | 22.7 | 1.6 | 37.7 | 2.9 | 2893 | 641 | 9.0 | 72.2 | 0.5 | 16.9 | 1.2 | 1.3 | 0.1 | 21.6 | 1.4 | 9.3 |
| B011 | 99.1 | 0.8 | 14.2 | 0.9 | 12.4 | 0.8 | 196 | 39 | 6.1 | 75.7 | 0.5 | 10.4 | 0.6 | 1.1 | 0.1 | 10.0 | 0.6 | 6.4 |
| B014 | 113.1 | 0.8 | 22.1 | 1.1 | 16.5 | 1.0 | 541 | 103 | 11.7 | 84.6 | 0.5 | 16.8 | 0.8 | 0.8 | 0.1 | 8.2 | 0.3 | 13.0 |
| B021 | 157.2 | 1.6 | 4.2 | 0.2 | 7.7 | 0.4 | 27 | 5 | 6.7 | 105.2 | 0.7 | 3.5 | 0.2 | 0.5 | 0.1 | 0.6 | 0.03 | 6.7 |
| B024 | 180.2 | 3.1 | 7.1 | 0.7 | 3.6 | 0.2 | 8 | 2 | 7.7 | 119.8 | 1.5 | 5.8 | 0.6 | 0.3 | 0.1 | 0.3 | 0.04 | 7.4 |
| B026 | 87.5 | 0.9 | 6.5 | 0.5 | 43.8 | 3.4 | 1120 | 248 | 20.3 | 68.1 | 0.5 | 4.7 | 0.3 | 1.5 | 0.1 | 8.5 | 0.6 | 19.9 |
| B029 | 121.7 | 0.6 | 24.7 | 0.8 | 33.7 | 2.6 | 3021 | 646 | 5.4 | 89.6 | 0.3 | 19.9 | 0.7 | 0.8 | 0.1 | 10.2 | 0.3 | 5.0 |
| B034 | 93.9 | 1.2 | 13.0 | 1.4 | 8.1 | 0.3 | 91 | 17 | 7.3 | 74.0 | 0.8 | 8.7 | 0.9 | 1.5 | 0.1 | 14.1 | 1.4 | 7.5 |
| B087 | 124.1 | 0.9 | 14.2 | 0.7 | 9.4 | 0.4 | 134 | 23 | 3.6 | 89.0 | 0.5 | 11.4 | 0.5 | 0.8 | 0.1 | 6.0 | 0.2 | 4.1 |
| B096 | 140.7 | 1.7 | 3.0 | 0.2 | 5.1 | 0.2 | 8 | 1 | 7.0 | 99.5 | 0.9 | 2.5 | 0.2 | 0.6 | 0.1 | 0.6 | 0.08 | 6.4 |
| B100 | 116.3 | 1.0 | 9.4 | 0.6 | 11.5 | 0.7 | 112 | 22 | 5.2 | 84.1 | 0.6 | 7.4 | 0.4 | 0.8 | 0.1 | 3.8 | 0.2 | 6.2 |
| B102 | 118.0 | 1.0 | 3.9 | 0.2 | 25.7 | 1.6 | 513 | 101 | 4.1 | 85.3 | 0.6 | 3.2 | 0.2 | 1.4 | 0.1 | 4.6 | 0.2 | 4.3 |
| B137 | 118.2 | 1.1 | 4.5 | 0.3 | 10.7 | 0.6 | 46 | 8 | 8.2 | 85.2 | 0.6 | 3.7 | 0.2 | 0.8 | 0.1 | 1.7 | 0.08 | 7.9 |
| B148 | 138.3 | 1.5 | 2.8 | 0.2 | 9.4 | 0.5 | 27 | 5 | 5.1 | 97.4 | 0.8 | 2.4 | 0.1 | 0.6 | 0.1 | 0.7 | 0.03 | 4.9 |
| B154 | 93.2 | 1.0 | 6.5 | 0.5 | 26.3 | 2.3 | 406 | 97 | 13.4 | 73.2 | 0.6 | 4.8 | 0.4 | 1.2 | 0.1 | 5.6 | 0.4 | 12.5 |
| B159 | 132.4 | 1.1 | 5.6 | 0.3 | 16.9 | 1.0 | 172 | 33 | 6.5 | 94.3 | 0.6 | 4.6 | 0.2 | 0.7 | 0.1 | 1.7 | 0.08 | 6.8 |
| B182 | 125.2 | 1.2 | 5.2 | 0.3 | 11.4 | 0.5 | 72 | 13 | 4.7 | 90.3 | 0.6 | 4.2 | 0.2 | 0.8 | 0.1 | 2.0 | 0.08 | 4.7 |
| B188 | 115.6 | 0.7 | 6.4 | 0.3 | 33.6 | 2.2 | 1414 | 281 | 3.9 | 85.5 | 0.4 | 5.1 | 0.2 | 1.4 | 0.1 | 7.3 | 0.2 | 4.2 |
| B193 | 89.3 | 0.7 | 11.5 | 0.7 | 67.6 | 5.7 | 5640 | 1283 | 15.3 | 70.7 | 0.4 | 8.0 | 0.5 | 1.7 | 0.1 | 17.2 | 0.9 | 14.4 |
Note. — Columns 2-6 are inferred properties from blackbody function fits to the dust SED. The equilibrium radius of column 4 is from Equation A1. The dust mass estimate of column 5 comes from Equation A3. Column 6 lists the reduced for the fit. Columns 7-11 list the inferred properties from modified blackbody function fits to the dust SED. The equilibrium radius of column 9 is from Equation A6. The dust mass estimate of column 11 comes from Equation A5.
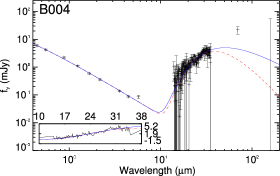
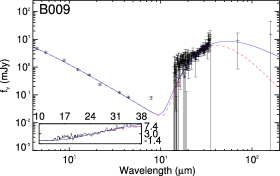
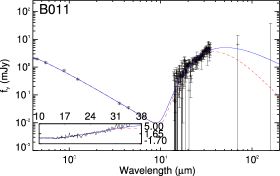
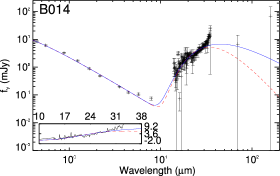
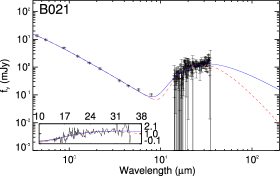
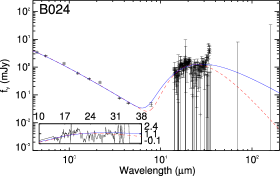
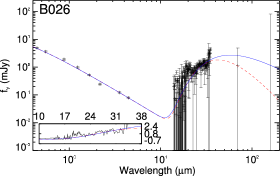
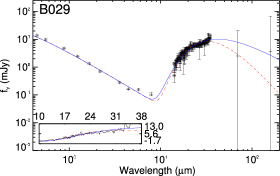
Figure 3 shows the data for all the stars overlaid by curves of the best-fitting models. We have also plotted a zoomed-in inset with the IRS spectra. The absolute flux calibration from the IRS spectra is consistent with the 24 m MIPS photometry in each case. From the mid-IR data alone, the spectra look similar to many debris disks (e.g. Chen et al., 2006; Dahm & Carpenter, 2009). Such comparisons must recognize that the literature debris disks are hosted by lower mass stars. It is clear from Equations A1, A2, and A3 that the derived debris disk properties are sensitive to both the mid-IR observables and the host star properties. The early B stars we study have approximately 2.5 the effective stellar temperature, 35–1800 the luminosity, and only 5 greater stellar mass compared to an A0V star. Under the same set of dust signatures, these changes drive the thermal equilibrium distance and minimum grain sizes up, along with the minimum dust mass.
3.1. Interacting Hot Spot Model
We develop some toy models for interacting cirrus hot spots to determine whether plausible values of velocity relative to the ISM clouds can match the SEDs. This scenario deviates from the previous two by permitting a continuous range of temperatures for differently sized dust grains. We follow the ideas originally developed by Artymowicz & Clampin (1997) and applied to data for Bootis stars in Kamp & Paunzen (2002); Gáspár et al. (2008); Martínez-Galarza et al. (2009). When a star is moving through a dust cloud, there is a scattering surface with a paraboloidal shape for any grain size beyond which the grains reside. The closest point on that surface that a grain of size may approach the star, the radius of avoidance, is given by:
| (1) |
for a star of mass M, a gravitational constant G, and a relative velocity of vrel. is the ratio of the radiative force to the gravitational force that we have given in Equation A2. However, for these small grains the average radiation pressure efficiency, , cannot be approximated as a constant, as it can when applied to debris disk models. We have numerically estimated its value by using the grain properties for astrophysical silicates in Draine & Lee (1984) and integrating the coefficients over wavelength and weighted with a 32,000 K BB function, representing the central star, to derive the average radiation pressure efficiency as a function of grain size. We have used a mass and luminosity appropriate for a B0 star. The dust is assumed to be at constant density in a sphere around the star, and grains of different sizes are evacuated from differently sized paraboloidals within the cloud. Each particle is given a temperature to maintain radiative equilibrium. The model solely uses silicates. We numerically integrate through the volume and over particle size, and we weight this by a MRN grain size distribution (Mathis et al., 1977). The free parameters are the outer sphere radius, the relative velocity between the cloud and star, and the bulk density. We have set the outer radius to 106 AU, although this is an order of magnitude larger than usually used when modeling interacting hot spots around cooler stars. With much smaller clouds and modest velocities, all the dust in the MRN grain size range is ejected by the radiation force. Clouds much larger than this would be well-resolved in our IRS peak-up images. In Figure 4 we show toy model spectra for several interaction velocities.

Not surprisingly, larger velocities result in hotter and more luminous emission. The toy models shown are too steep when compared to the data for B004, but slightly hotter and better matching distributions can be made by either adopting higher velocities or moving in the outer radius so that the contribution of the coolest grains is clipped. Interacting hot spots are a viable model for the dusty OB SMC stars.
4. Local Comparison Samples
4.1. Debris Disks
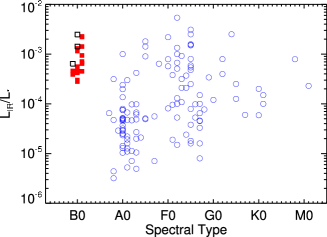
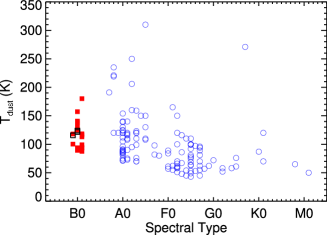
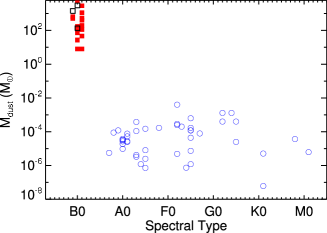
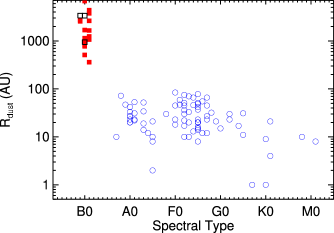
We have compiled the parameters from several local debris-disk studies (Beichman et al., 2006; Chen et al., 2006; Su et al., 2006; Hillenbrand et al., 2008; Rebull et al., 2008; Trilling et al., 2008; Moór et al., 2011) in order to compare their properties to the SMC candidates. Figures 5–6 show the ratio of IR to stellar luminosity and the blackbody dust temperature as a function of spectral type for the local and SMC samples. The properties inferred indirectly from the data, the minimum dust mass and the dust equilibrium radius in the blackbody model, are shown in Figures 7–8. In the MW, there are no strong trends of debris disk properties over a factor of 5 in stellar mass and a factor of 700 in luminosity.
Until recently, no studies have found debris disks around stars more massive than 3 M⊙. Chen et al. (2012) have searched for debris disks around stars at these higher masses. They analyzed 57 stars with M 3 M⊙ in the Scorpius-Centaurus association and found only four stars with significant mid-IR excesses. Three are Be stars and only one (HIP 81972) is a debris disk candidate. HIP 81972 is a known binary, and the infrared emission may be coming from the lower mass companion. The remaining 53 stars have 24m flux that is not in excess of the photospheric emission. The same study covered slightly less massive stars, and found them to host debris disks more frequently. They compile 24m measurements for A+B stars from 2.7 M M 1.8 M⊙ in the same association. After removing the objects classified as protoplanetary (based on 16m excesses or emission lines), they find that 72/293 (25%) host debris disks. Similar work covered F+G stars (1.7 M M 0.8 M⊙) to find a 47/165 (28%) debris disk fraction (Chen et al., 2011). Debris disks around massive stars are evidently much rarer than those around A, F, and G stars.
HIP 23767 (B5V) is another possible debris disk host (Kloppenborg et al., 2010), although the dust disk is much hotter (550K) than usual for debris disks, and the star is a binary system with an F type companion which may alternatively be hosting the dust.
4.2. ISM Hot Spots
A direct comparison to cirrus hot spots is more difficult as the modeling in previous papers is more diverse and comparable data, including IRS spectra, have not been taken. However, the temperatures have overlap with Gaustad & van Buren (1993) and the dust masses are comparable (as shown in Paper I). We conclude that the SED properties of present samples alone do not allow a clean classification of our SMC stars, but that nearby cirrus hot spots suffice as analogs.
4.3. Protoplanetary Disks
We consider the properties of protoplanetary disks and whether our dusty OB stars may host such disks or their remnants. The working demarcation of Ldisk/L for debris disks and Ldisk/L for primordial disks (Williams & Cieza, 2011) suggests that most of our sources are not protoplanetary disks. Four of our twenty sources have large enough fractional luminosities to perhaps be protoplanetary disks. The short stellar lifetimes for the massive stars in our sample are approximately the same as the lifetimes of protoplanetary disks. The compilation of protoplanetary disk mass as a function of stellar mass in Figure 5 of Williams & Cieza (2011) shows that such disks exist with an average mass of Mdisk/M up through B star masses, but do not seem to exist around O stars (Mann & Williams, 2009). These masses are more than sufficient to supply, as remnants, the dust masses we measure. Since our source selection has chosen stars without H emission, this intepretation would require a transitional phase where the protoplanetary disks are being disrupted and accretion has stopped. Is it plausible that we are observing such a phase? A conclusive model would have to consider the sensitivity of our H observations and the rate at which H emission fades in a disrupting disk. The timescale for disk dissipation after primordial accretion stops has been estimated as 0.5 Myr (Skrutskie et al., 1990; Wolk & Walter, 1996; Cieza et al., 2007) and is found to be similarly rapid in simulations (Alexander et al., 2006a, b).
Protoplanetary disks are believed to be destroyed by photoevaporation on an approximate timescale of 1 Myr (Hollenbach et al., 1994). The literature is rich with numerical simulations that have reinforced the original proposal for photoevaporative destruction (e.g. Yorke & Welz, 1996; Richling & Yorke, 1997; Yorke & Sonnhalter, 2002). The observations and models have been summarized in Cesaroni et al. (2007), where one particular system, IRAS 20126+4104, has been shown to have properties very well matched to the gas-rich phases of protoplanetary disk growth. Notably, the disks may extend from 1,000–10,000 AU, such as in the simulations of Yorke & Sonnhalter (2002). However, OB stars can drive such powerful photoevaporative winds that the ultimate fate of the material necessary to build up debris disks is uncertain. Balog et al. (2006, 2007, 2008) have given demonstrations of proplyds where even the dust in the neighboring stellar disks is removed. In some simulations of massive stars (Krumholz et al., 2009), an optically thick disk persists which resists photoevaporation.
Transition disks have been studied with IRS spectra (Espaillat et al., 2012), but no samples have OB stars. Cieza et al. (2012) present Spitzer photometry on forty-one stars including seven B and A stars. None are so hot as our O9–B3 sample. We have examined all these stars in the WISE catalog, and the only BA stars displaying the extreme colors of our SMC stars are the stars numbered in Cieza et al. (2012) as 7 and 36 (A5 and B9). Cieza et al. (2012) classify these two as a photoevaporating disk and a main sequence debris disk, respectively. In WISE, source 7 is unresolved. However, source 36 is clearly resolved to a large size and is asymmetric. Assuming source 36 to be in the Taurus molecular cloud, the radius of the source in the WISE filter at 22 m is 5,000 AU. Cieza et al. (2012) discuss that source 36 may be a background star and not actually in the Taurus molecular cloud, so the size may be larger.
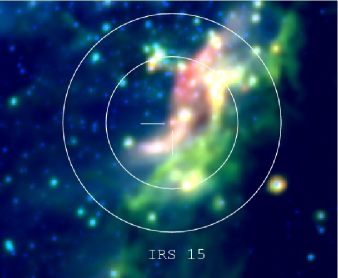
Chini et al. (2006) have found a source around a B0.5V star, IRS 15, in the Omega Nebula (M17) at a distance of 2.2 kpc (Chini et al., 1980) which they interpret as a transition disk. The star lacks H emission and has a mid-IR disk extending up to 10,000 AU. Can this be an analog to our dusty SMC sources? If so, does it imply a circumstellar origin for the dust? The answer to both questions is “no”. First, the dust is much hotter than in the dusty SMC sources with a color temperature of 220 K. IRS 15 shows significant excess flux in the L band (3.5 m). Second, while the inner regions analyzed by Chini et al. (2006) may have a circumstellar origin, as they claim, the star is also interacting with its dusty surroundings. We present a three color image of the source in Figure 9 drawn from 2MASS and WISE data. Starting at 16″ to the south of the star and extending to the southeast, a a curved feature resembling a bow shock can be seen in near-IR wavelengths. The feature is not centered on the star, as one would expect for a bow shock in a spherical cloud, but also extends up in a second tail to the northwest. The star embedded in IRS 15 is the most plausible candidate, based on position and color, for heating this dust. At the physical resolution for the SMC, this dusty emission with an interstellar origin will contribute and possibly dominate the flux measurement.
4.4. Comparison to All Nearby, Dusty OB Stars
As a complement to comparing with catalogs of specific source types, we now build an all sky catalog with a better match in selection criteria to the SMC sources. This approach has several advantages over the use of literature samples. First, even the classification of these literature samples is somewhat contentious. For instance, 31 of the 34 stars in the list of debris-disk candidates by Backman & Paresce (1993) are also listed as cirrus hot spots by Gaustad & van Buren (1993). Second, the SMC stars have much larger absolute dust luminosities than the published local samples. Third, searches for debris disks tend to target stars later than A0. This is partly due to the small number of hot stars showing mid-IR excess in the local volume most easily surveyed. However, it is possible that the dusty OB stars in the SMC are without analogs or underrepresented in the MW. If they do exist, the most recent all-sky mid-IR catalog of WISE (Wright et al., 2010), with its higher resolution and deeper flux limits than IRAS, may measure the extent of the larger cirrus hot spots and permit classification. The four WISE bands are centered at 3.4 m, 4.6 m, 12 m, and 22 m. The spatial full-width-half-maxima are 61, 64, 65, and 120, respectively. We will refer to the bands as W1, W2, W3, and W4.
We have assembled a local comparison sample from the Hipparcos catalog (Perryman et al., 1997) with parallaxes taken from the latest reduction by van Leeuwen (2007). A simple cut was made on the spectral type as listed in the original Hipparcos catalog such that only O and B stars were selected. Stars with measurements of negative parallaxes were rejected as well, leaving 10,676 stars. Next, a 1″ positional match to the WISE catalog was made with the additional requirement that the fluxes were detected in the W3 and W4 bands at a 3 level or higher. Our primary interest is in W4 at 22 m for its proximity to the MIPS 24 m band. The S/N cut left 8171 stars, which predominantly lie in the MW disk. In the more restrictive O9–B3 range, there are 1750 stars with mid-IR detections. A comparable study by McDonald et al. (2012) matched catalogs including Hipparcos and WISE, but focused on infrared excesses from giant stars rather than massive stars on the main sequence.
WISE has a resolution of 12″ in the W4 band, and the catalog lists a source as extended when the PSF model cannot fit the source in any band with a reduced 3. We estimate that a source size equal to the nominal resolution will cause and will trigger the extended flag for that band in the WISE catalog, although there is some variation with S/N and with PSF variation across the camera field.
The WISE catalog has already been cross-matched to 2MASS photometry (Skrutskie et al., 2006), and we use the Ks fluxes to verify the mid-IR excess in addition to the color. Figure 10 shows this color-color plot for all 8171 stars.
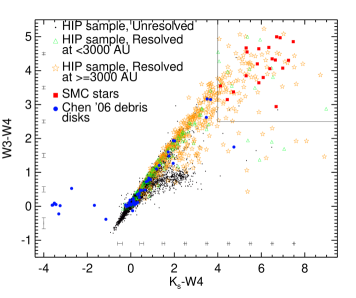
We break the local sample into three subsets: the stars unresolved in W4, the stars that are resolved but with a parallax-based resolution limit below 3,000 AU, and resolved stars with a resolution limit above 3,000 AU. The cut at 3,000 AU is considered as a conservative size above which debris disks are not observed to exist and is justifed in Section 5. In fact, debris disks are commonly an order of magnitude smaller (although, in cooler stars; Booth et al., 2013), and the Solar System’s asteroid and Kuiper belts have sizes of 3 and 40 AU, respectively. The largest debris disks known are Pictoris at 550 AU (Backman, 1996), Lyrae at 815 AU (Su et al., 2005), and 51 Ophiuchi at 1200 AU (Stark et al., 2009). The first two works are based on resolved mid-IR images, and the size of 51 Ophiuchi is based on a model to explain the temperature inferred from the mid-IR spectra. The largest sizes measure the halos of debris disks rather than the site of the parent bodies. The sizes of these sources in lower S/N images, such as in WISE, are substantially smaller. We caution that some transition disks, if they exist, may be large enough to violate this distinction. The numerical simulations of protoplanetary disks around massive stars (Yorke & Sonnhalter, 2002, Figure 9) create shortlived disks of size 10,000 AU. Our choice of the 3,000 AU cut should straddle the sizes of debris disks and the cirrus hot spots. Kalas et al. (2002) measured stars with coronographic imaging and excluded the central 4″ for distances of 100–350 pc to find reflection nebulae measured to sizes of 1–2′. These values translate to 1000 AU as the smallest measureable size in the coronographic sample and cirrus hot spot sizes of 20,000 AU.
To identify the closest analogs of the dusty SMC OB stars, we select the 108 stars in Figure 10 with and and list them by their three subsets in Tables 6, 7, and 8. These color cuts were chosen to contain all the dusty SMC OB stars included in our study. Note that the resolution sizes listed are lower limits to the actual sizes because the surface brightness profiles may extend well beyond a resolution element and such direct measurements from the WISE images are beyond the scope of this study.
| Hip | Spectral | Resolution | |||||||
|---|---|---|---|---|---|---|---|---|---|
| (deg,J2000) | (deg,J2000) | Type | (mag) | (mag) | (mas) | (mas) | (AU) | ||
| 23428 | 75.530807 | -71.336976 | B | 9.98 | 4.35 | 1.31 | 1.35 | 1.5 | 9000 |
| 26062 | 83.378164 | 24.628811 | B8 | 4.54 | 2.85 | 8.78 | 0.61 | 1.0 | 1400 |
| 77542 | 237.490620 | -3.921211 | B9 | 4.97 | 2.96 | 8.61 | 0.60 | 1.3 | 1400 |
| 77716 | 237.999523 | 32.948423 | B2 | 4.84 | 4.38 | 0.10 | 1.64 | 1.1 | 7300 |
| 88496 | 271.062608 | -24.391030 | B2Vne | 6.75 | 2.84 | 1.87 | 1.51 | 1.1 | 6400 |
Note. — Column 4 is the spectral type as taken from Hipparcos. Columns 5 and 6 list the colors taken from WISE and 2MASS with W3 and W4 effective wavelengths at 12 and 22 m. Column 7 lists the parallax from Hipparcos and column 8 lists the error. Column 9 lists the reduced that the W4 data is compatible with the PSF from the WISE catalog. Values above 3 are considered to indicate extended emission. Finally, column 10 lists the physical size for the 12″ W4 resolution. This is the minimum size for extended sources.
| HIP | Spectral | Resolution | |||||||
|---|---|---|---|---|---|---|---|---|---|
| (deg,J2000) | (deg,J2000) | Type | (mag) | (mag) | (mas) | (mas) | (AU) | ||
| 13330 | 42.886541 | 67.815045 | B9V | 6.53 | 3.81 | 4.37 | 0.91 | 80.2 | 2700 |
| 17465 | 56.142444 | 32.162809 | B5V | 5.94 | 4.91 | 6.58 | 4.09 | 121.9 | 1800 |
| 19720 | 63.394043 | 10.212458 | B8Vn | 5.47 | 4.05 | 7.56 | 0.81 | 90.4 | 1600 |
| 24052 | 77.532108 | 53.709788 | B9 | 4.64 | 3.55 | 4.94 | 0.72 | 74.5 | 2400 |
| 26551 | 84.690112 | -2.599693 | B0 | 4.01 | 4.55 | 6.38 | 0.90 | 294.1 | 1900 |
| 26939 | 85.752393 | -2.312602 | B5V | 5.36 | 5.00 | 5.90 | 1.29 | 219.3 | 2000 |
| 28711 | 90.958817 | 30.169222 | O9V | 5.71 | 3.50 | 9.18 | 2.85 | 10.0 | 1300 |
| 31042 | 97.707556 | -9.654110 | B8 | 6.48 | 4.08 | 4.75 | 1.79 | 48.4 | 2500 |
| 36369 | 112.294862 | 20.911802 | O6 | 10.56 | 4.21 | 5.60 | 3.75 | 56.7 | 2100 |
| 47078 | 143.916789 | -50.223235 | B5 | 4.13 | 3.57 | 4.32 | 1.74 | 3.5 | 2800 |
| 56379 | 173.356003 | -70.194789 | B9Vne | 8.98 | 2.87 | 10.32 | 0.43 | 1191.0 | 1200 |
| 62913 | 193.406739 | -60.357061 | B3Ib: | 4.05 | 4.27 | 6.03 | 3.09 | 127.7 | 2000 |
| 83509 | 256.005176 | -51.083654 | B2V | 4.12 | 3.59 | 0.54 | 6.18 | 37.2 | 1900 |
| 110119 | 334.604354 | 63.220020 | B8 | 4.46 | 3.97 | 11.05 | 7.21 | 72.7 | 1100 |
Note. — Column 4 is the spectral type as taken from Hipparcos. Columns 5 and 6 list the colors taken from WISE and 2MASS with W3 and W4 effective wavelengths at 12 and 22 m. Column 7 lists the parallax from Hipparcos and column 8 lists the error. Column 9 lists the reduced that the W4 data is compatible with the PSF from the WISE catalog. Values above 3 are considered to indicate extended emission. Finally, column 10 lists the physical size for the 12″ W4 resolution. This is the minimum size for extended sources.
5. Discussion
With the data and frameworks discussed, we now analyze the evidence for accepting or rejecting particular models. First, we examine the SED shapes. Second, we review the size distributions of debris disks and static hot spots and present a size cut which reliably separates the two populations. Third, we compare the derived properties to those inferred for debris disks with similar data. Fourth, we search the literature and utilize the size cut to classify nearby sources that serves as analog to the dusty OB SMC stars. Fifth, we address the frequency of the near-IR excess pattern in SMC OB stars as compared to the frequencies and lifetimes of the models. Finally, we review bow shock models and their gas signature.
We examine whether the generic properties of the SEDs can select between the debris disk and cirrus hot spot models. Cirrus hot-spot models with clouds of constant density that span a range of temperatures (Kalas et al., 2002) can produce SEDs that rise in flux density through 100 m. The dust temperatures in cirrus hot spots are controlled by the central star’s mass and luminosity, by the distance at which the dust particles reside, and the size distribution of grains. The radiative force on small grains around OB stars is large enough to eventually remove the grains from orbit. We have presented static models (Table 5) for small ISM grains at scales of 100,000 AU that have the observed dust temperatures. The larger scale environment may be important enough at these distances that the steady-state blowout solution need not apply. A second type of cirrus hot spot can occur when the star has a large velocity relative to the ISM, and the ISM emission is enhanced. This permits small grains to stay at a fixed distance from the star and reach hotter temperatures than the static model. We have shown how such interaction hot spot models can also explain the dusty SMC stars’ SEDs. Additionally, there are debris disks (e.g. Hillenbrand et al., 2008) where the SEDs continue to rise beyond 70 m. A sample of A-star debris disks observed with Herschel for the DEBRIS and DUNES surveys finds dust SEDs that generally peak around 70 m (Gáspár et al., 2013; Booth et al., 2013; Eiroa et al., 2013). Most of our data are consistent with a downturn in the SED before 70 m. However, our Herschel error bars are too large to strongly rule out a longer wavelength SED peak. Both the uncertainties in our data and the large range of permissible dust temperatures in the debris disk and cirrus hot spot models nullify the SED shape as a classification tool between these source types.
We have no local examples of debris disks around O9–B2 stars, so we do not know exactly what their properties would be. As discussed in Section 4.3, protoplanetary disks around massive stars may be destroyed so violently such that the planetesimals that seed debris disk growth are not formed or retained. We also note that the timescale for the sublimation of icy grains (Jura et al., 1998) is much shorter than the collisional timescale in massive stars out to several thousand AU (as can be derived using the equations and constants in Chen et al., 2006), which encompasses the radii where debris disk parent bodies could possibly reside and which may inhibit the growth of debris disks around OB stars. One set of models for collisional cascades (e.g. Kenyon & Bromley, 2002, 2004, 2008, 2010) starts with a disk of icy planetesimals from 30–125 AU for 1–3 M⊙ stars. In these simulations, bright rings manifest where the planetesimals are grinding into dust which move outward with time. We know of no collisional cascade simulations for the masses of stars we study here, so we extrapolate relations that have been developed for stars and disks in lower mass ranges. We stress that such extrapolations are highly uncertain, and we only use them to form a conservative classification rule for the maximum extent of debris disks. Equation 6 of Kenyon & Bromley (2010) is: 666We note that there is a typographical error in their Equation 6 where the sign preceeding 3/2 in the exponent to should be positive rather than negative.
| (2) |
where is a growth time, is a scaling for the mass initially in the disk, is a term for the influence of gas drag on the dynamical friction, is a radius along the disk, and is the power law exponent for the initial disk mass. This equation is valid for a fixed central star mass. Adding the star’s mass as an additional variable and assuming that the disk surface density is proportional to the stellar mass introduces the dependence that . Kenyon & Bromley (2008) present a version of this in their Equation 41. Kenyon & Bromley (2010) estimate 0.1–0.2 and or 1.5. We use here. To provide a normalization to the scaling, we use the result from Kenyon & Bromley (2004) that a solar mass star forms a ring at 30 AU in 10–20 Myr. A similar value can be obtained from the time to form the first Pluto-sized object (Equation 28 in Kenyon & Bromley, 2008). At this fixed time, which is approximately the main sequence lifetime for our massive stars of MM⊙, the ring will be at a larger radius. Similar scaling laws can be found in Löhne et al. (2008). However, a distinction must be made between the original site of planetesimal grinding and the sites where small grains primarily emit. When a collision fragments a large particle into dust grains, the smaller grains will suddenly react to the radiation pressure. This effect pushes particles originally on circular orbits into highly eccentric and even unbound orbits. The smaller particles will be, on average, ejected onto more eccentric orbits, attain cooler temperatures at larger distances, and cause color gradients. These effects have been modeled for Vega by Müller et al. (2010) with a ring of source material from 80–120 AU. From their baseline model in Figure 6, the FWHM for the surface brightness profiles is broadened to 150, 200, and 230 AU for the MIPS 24m, 70m, and 160m bands. The halo of emitting grains may plausibly extent out from the collisional region by a factor of a few, and we would thus expect the maximum extent of debris disks around OB stars to be measureable to AU. As a conservative cut, we consider sources with mid-IR extent beyond 3,000 AU, in Section 4.4, to exclude a debris disk classification.
We scrutinize the derived dust properties against those in the literature for cooler stars in Figures 5–8. The dust temperatures of the SMC OB stars are consistent with the extrapolation from known debris disks, and the relative IR luminosities are within the upper envelope, but above an extrapolation, of the debris disk samples. The offset in relative IR luminosity is likely a selection effect for the SMC stars. The dust masses and radii, however, are several orders of magnitude larger for the dusty OB stars than for any local counterparts. We do not see trends in dust mass or radius for the most massive literature stars that would anticipate the larger values in our SMC stars. The debris disk hypothesis for the SMC stars cannot be strongly rejected from the literature samples of disks around cooler stars, but neither are the data strongly supportive of such a model.
Next, we classify the local sources showing mid-IR excesses introduced in Section 4.4. The catalog match between Hipparcos and WISE produces 8171 OB stars with mid-IR detections and 1750 stars in the range O9–B3. Based on the previous timescale calculations and the large parallax errors in many stars, we consider the nature of the WISE sources with sizes less than 3,000 AU to be uncertain and a possible mix of cirrus hot spots, debris disks, and protoplanetary disks. When the reported parallaxes are below a 1 significance, we quote the resolvable sizes at the 1 limit. The extended objects resolved to 3,000 AU are considered to be reliably classified cirrus hot spots. For consistency with the local sample, we have also computed synthetic photometry to the best-fitting stellar and dust models for our SMC stars as described in Section 3. The WISE W3 and W4 bands are near the fourth IRAC and first MIPS bands, so the color correction from our actual Spitzer measurements is small. It is clear from Figure 10 that the SMC stars have extreme colors in both and , and only the tail of the local distribution matches them. The reddest star in the cirrus hot spot sample of Gaustad & van Buren (1993) has , while the vast majority lie at . The debris-disk samples of Chen et al. (2006) and Carpenter et al. (2009) also do not match the SMC colors and all lie at . The debris-disk stars fail to match the dusty OB star colors both because the OB stars have, on average, higher fractional IR luminosities and because the hotter photospheres emit less of their fractional luminosity in Ks and W3. For example, Pictoris has and , and its SED, in Figure 1 of Chen et al. (2007), can be directly compared to our dusty OB stars in Figure 3.
We classify the 108 reddest local stars in WISE from Tables 6, 7, and 8 in the Appendix B. To summarize, none of the 59 stars in the range O9–B3 are likely to host debris disks. We find that many of the local sources contain emission lines, and all the others have sizes characteristic of cirrus hot spots. Transition disks complicate this conclusion, and until more is known about them in the environment of massive stars, we cannot exclude them as being present in our sample of local analogs. The known transition disks around hot stars are either too small or two hot in their dust emission to match the SMC observations, but the small sample sizes for such transition disks preclude a firm conclusion. We find only one source with color that may plausibly be a debris disk host by its angular size. That source is a B8 star (HIP 26062), and so not a good analog to our SMC sample. Of course, the stars with cirrus hot spots may also contain debris disks, but their mid-IR fluxes are likely dominated by the hot spots. If O9–B3 stars do host observable debris disks, they may lie at .
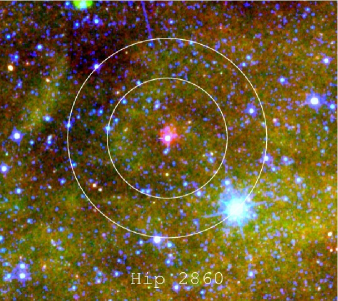
The fraction of hot stars in our color cut (1%, 108 of 10,676 stars) is well below the 3% mid-IR excess fraction (Bolatto et al., 2007) that is found in the SMC sample. At first glance, this appears as a surprising result. Is the fraction of hot stars with a mid-IR excess intrinsically larger in the SMC than the MW? Such a result could indicate that PAHs are deficient in the SMC. However, the physical scales probed in the two catalogs are vastly different. Consider the 6″ FWHM resolution of our 24 m data, which for the SMC measures a physical radius of 183,000 AU. We have measured photometry from the WISE images for several hot stars with matched physical apertures, and we find that the colors are commonly redder in for large apertures. One randomly chosen representative is HIP 2860 (B2V, mas), which has no indication in the literature of hosting a mid-IR excess. We show a three-color image for HIP 2860 using WISE W2, W3, and W4 data in Figure 11 with aperture photometry out to a radius of . The images have not been matched in resolution in Figure 11, but the resolution mismatch is unimportant for the large-aperture photometry that we discuss. The WISE catalog reports that the spatial profile of the star is consistent with the PSF and has a color from the PSF-photometry. However, the SMC-matched aperture has a color, and the star is clearly extended in the reddest channel in Figure 11. This star was not considered an analog to our SMC stars by the color cut of Figure 10, but it becomes one with the physically matched aperture photometry. A full analysis of the WISE images with matched apertures would reveal many more cirrus hot spot analogs. Our intent is only to find debris-disk analogs, and the color cuts of Figure 10 will suffice to find them since debris disks will be unresolved or barely resolved in WISE for the stars under study. To conclude our question, the color corrections for extended sources would reveal many more local, dusty OB stars, and the frequency by which OB stars appear dusty in the SMC is unlikely to be enhanced over the frequency in the MW.
Paper I has posited bow shocks around runaway stars as an additional mechanism that may be causing the mid-IR emission. Normally, such stars would have strong optical emission lines, and Paper I presents 17 stars with clear H emission and 7 additional candidates for weak emission from the 125 stars with spectra taken. The subsample we analyze here is instead drawn from the 88 main-sequence stars without emission lines. However, Paper I finds two runaway star candidates without emission lines from the large radial velocity offsets between the photospheric lines and local HI in the literature. Even for the classic examples of bow shock stars, the presence of H emission is mixed. Velorum does not show H in emission (Alekseeva et al., 1996). Ophiuchi shows H in emission (Touhami et al., 2010) and is classified as a Be star. The Mira-type star R Hydrae does show higher order Balmer emission (Merrill, 1915) and presumably H emission, but spectra have not been published covering H. Kobulnicky et al. (2012) have recently discovered a bow shock around a B1.5V star, and the stellar spectrum is without H emission. Balmer emission lines cannot be reliably used to determine the presence or absence of bow shocks around runaway stars.
Since our search of the WISE catalog has revealed a fair number of analog stars with distorted, extended morphologies, it is plausible that some of our SMC stars are manifesting bow shock features in the mid-IR caused by their large velocities relative to the local ISM. Higher resolution optical spectroscopy could resolve this interpretation with precise radial velocities. Higher resolution imaging might also find conclusive morphological features.
6. Summary & Conclusions
We have studied the properties of dusty OB stars in the SMC with new mid-IR and far-IR data. Our main goal is to determine the nature of the mid-IR excesses. The two most probable hypotheses are that they are debris disks or cirrus hot spots. The cirrus hot spots may be either due to nearly static ISM overdensities, like in the Pleiades, or from regions compressed in bow shocks around runaway stars. Classical and Herbig Be stars are excluded by the lack of H emission presented in Paper I. Transition disks, a cousin class to debris disks, cannot be rigorously rejected but are lacking in compelling analogs. The largest nearby transition disk has hotter dust than the sources in the SMC and also is dominated by emission from an interaction with the ISM. Without information on the angular extent of the dust in the SMC OB stars, the relevant properties can only be derived in model-dependent ways.
Of the twenty stars analyzed with new IRS peak-up images at 16 m (), three are significantly extended. This places the dust at scales of 105 AU from the central stars and precludes them being debris disks. The angular-resolution data for the remaining seventeen stars are inconclusive. We have measured and fit the spectral energy distributions of eleven main-sequence OB stars with extant Spitzer photometry, new Spitzer IRS spectroscopy, and limits from Herschel photometry. A further nine are analyzed with Spitzer imaging and spectroscopy but no Herschel photometry. The mid-IR spectra are featureless. We infer temperatures and dust masses for these cases. The dust temperatures do not constrain the mechanism for the mid-IR excess flux, but the large dust masses required by the modeling assumptions suggest that the sources are not debris disks. The evidence is only circumstantial because nearby debris disks around stars as massive as the SMC OB stars have not been studied. Such massive disks may exist, but they would require an abrupt jump in dust mass compared to debris disks around A stars and later stellar types. The larger dust masses are compatible with transition disks.
The best discriminant, resolving the mid-IR region sizes, remains impossible for these distant stars should any host debris or transition disks. Instead, we make a search of nearby Hipparcos stars that can be resolved at meaningful sizes by the all-sky WISE survey. We note that the implied colors of our SMC stars are unusually red in the WISE system (12 m and 22 m). We find that only a small number of hot main sequence stars in the MW show such strong mid-IR excess (1% for ), and that nearly all these detections are explained as cirrus hot spots, bow shocks, and protoplanetary disks around young stars based on their mid-IR sizes and morphologies. We find only one instance of a plausible debris disk system in this color range, but it has a cooler central star (B8) than our SMC sample. From this comparison, the SMC stars under study are most likely to not host debris disks. We cannot rule out that transition disks around hot stars may have sizes large enough to be present in our MW sample and represent some of our SMC stars, but the current examples are either too small or too hot in their dust emission. By concluding that cirrus hot spots make for the best model, these dusty OB stars may be useful as a bright target catalog for studying the diffuse interstellar dust of the SMC.
Appendix A Modeling of debris disks and static cirrus hot spots
A.1. Debris Disk Model
The mid-IR SEDs of debris disks can be fit with a blackbody (BB) function at a single temperature. The radiative force from the central star, as we will discuss, blows out small dust grains in debris disks. When the grain sizes are all larger than the observed wavelengths, the grains are efficient at both absorbing and emitting and a BB function is appropriate. We have derived the dust temperatures in Column 2 of Table 5 from such fits.
The thermal equilibrium distance for a single temperature blackbody is given by:
| (A1) |
where is the stellar photosphere temperature, is the dust temperature, and is the stellar radius. Debris-disk sizes, when resolved, are at most a factor of 3 larger than the blackbody distance estimate (Smith & Wyatt, 2010).
A simple balance between the forces of gravity and radiation from the central star create the ratio,
| (A2) |
which forms a stability criterion for a grain with radius (Burns et al., 1979; Artymowicz, 1988). We set the radiation coupling coefficient, , to unity since the geometric limit (2a/1) applies for the hot spectra and large grains. The units of are m, L∗ is in , M∗ is in , and is in g cm-3. For sizes below the minimum grain size, the radiation force will overwhelm the gravitational force and eject the small grains. Nominally, this condition is for which we evaluate as given in Column 7 of Table 1, although grains can still be ejected with when on elliptical orbits (Burns et al., 1979).
A minimum mass estimator commonly used for debris disks can be made by assuming that the mid-IR emission comes from a ring or shell of grains of size at the thermal equilibrium distance (Artymowicz, 1988; Jura et al., 1995). With as the smallest dust grain size in cm, the grain distance from the star in cm, the flux of the dust relative to the star, the dust density in g cm-3, and the dust mass in g:
| (A3) |
We use g cm-3 (Draine & Lee, 1984). To estimate the dust’s infrared luminosity, we numerically integrate the BB function from 0.7-100 m. We note that this equation is valid for a thin shell of dust with spherical particles and may not strictly apply for younger, extended debris disks. A slightly better approximation can be made considering the full grain size distribution above such as in Chen et al. (2005). While the grain size distribution in the ISM follows a power law with exponent (Mathis et al., 1977), the value for debris disks is slightly steeper at to (O’Brien & Greenberg, 2003; Wyatt et al., 2011; Gáspár et al., 2012). The upper limit to the grain size may be considered as infinity, or more usually set to 1 mm. The minimum grain size is already so large in OB stars (0.5 mm) that this averaging makes little difference. The average grain size (and mass estimate) for the two upper limits considered will be 1.59 or 1.30 larger, assuming . We present mass estimates based solely on , but we note that the actual values may be larger. This mass estimate is given in Column 5 of Table 1.
A.2. Static Hot Spot Model
The MRN model (Mathis et al., 1977) for the ISM has a power law form for the dust grain number density as a function of size with a exponent and a grain size range of 0.005–0.25 m. These small grains, when in the presence of a hot star, will efficiently absorb radiation but inefficiently radiate it. This leads to a MBB form in the SED. We use an emissivity index of and the dust mass absorption coefficient evaluated as:
| (A4) |
where is in m and is in cm2 g-1. This value was originally proposed by Hildebrand (1983) and is used as a standard value in the Herschel Gould Belt Survey (André et al., 2010; Arzoumanian et al., 2011; Sadavoy et al., 2012). Values with higher and lower normalizations by a factor of two are used in some other works (Wyatt, 2008; Decin et al., 2011), and the value will depend on the grain size, composition, and wavelength range.
We compute a dust mass as simply estimated from:
| (A5) |
where is the observed flux density, is the dust absorption coefficient, is the blackbody function, and is the distance to the SMC. will be in units of g if and are given in the same units, D is in cm, and is in cm2 g-1. The equation is from Hildebrand (1983), and is valid under several assumptions. The dust must be isothermal, and the dust grains must be small relative to the observed wavelengths and in the Rayleigh-Jeans regime. For the small grains present in the ISM, these assumptions are valid. This mass estimate is listed in column 10 of Table 5, and implicitly assumes a modified blackbody function due to our chosen form of the dust opacity.
Once the temperature is derived, the distance for the grains can be found by (Backman & Paresce, 1993; Akeson et al., 2009):
| (A6) |
where L∗ is the stellar luminosity in units of L⊙, in AU, is the critical wavelength and scales with the size of the grain particles in m, and Tdust is the dust temperature in K. We assume m, although this value is very unconstrained, for the size estimate in column 9 of Table 5. We have evaluated the coefficient in Equation A6 from the Equation 2 in Backman & Paresce (1993)777We note that there is a typographical error where the summation term in the denominator should have an exponent of -(4+q) instead of -(4+p) in Equation 2 of Backman & Paresce (1993). for the and case of an efficient absorber and inefficient emitting material. This equation is valid for small grains such that they will efficiently absorb the photons from the central star but will inefficiently radiate at the mid-IR wavelengths where they are measured.
Appendix B Discussion of particular mid-IR excess stars in WISE
B.1. Stars with unresolved mid-IR photometry
Only five stars meet the color cuts stated above and are unresolved in the W4 band.
- HIP 23428
-
is the well studied luminous blue variable R71 in the Large Magellanic Cloud (Boyer et al., 2010). It has a parallax detection below 1 significance and is not truly a “local” analog.
- HIP 26062
-
has a well determined parallax and is a debris disk candidate.
- HIP 77542
-
(HD 141569) is an extensively studied Herbig Ae/Be star with a circumstellar disk (e.g. Sylvester et al., 1996).
- HIP 77716
- HIP 88496
-
is an emission-line star.
None of these are likely to be analogs to our SMC sample because they are either types that Paper I excluded through optical spectroscopy, or are cooler than the 09–B3 stars in our SMC sample.
B.2. Stars with resolved mid-IR photometry and uncertain classification
Fourteen MW stars are resolved by WISE, but at sizes that do not cleanly distinguish their nature.
- HIP 13330
- HIP 17465
-
has several classifications in the literature, including as a debris disk, but Rebull et al. (2007) have shown that spherical shells of extended IR emission stem from ISM interaction. All four WISE images also show a clear bow shock.
- HIP 19720
- HIP 24052
-
shows asymmetric emission with hints of a bow shock in the WISE W3 and W4 images. It is likely to be a cirrus hot spot.
- HIP 26551
-
( Ori) is near, but offset from, a large patch of dust (van Loon & Oliveira, 2003). The gas shows strong optical emission lines and is likely a protoplanetary disk around a binary M1 star and a brown dwarf (Hodapp et al., 2009). The disk is being photoevaporated by the more massive, nearby binary (HIP 26551) but is otherwise unrelated.
- HIP 26939
- HIP 28711
-
has little information in the literature, but appears to be far too faint for its spectral class to lie at its trigonometric parallax distance (Tsvetkov et al., 2008). However, its infrared excess does not come from a debris disk. The WISE catalog lists the W4 detection as being extended, and we find it to be extended to 6400 AU FWHM assuming the trigonometric parallax distance. It also lies near a large H ii region and is another example of a cirrus hot spot.
- HIP 31042
- HIP 47078
-
is a double star with the mid-IR emission extending over the optical image of both stars.
- HIP 36369
-
is a planetary nebula (NGC 2392).
- HIP 56379
-
is a Herbig Be star with a protoplanetary disk (Goto et al., 2012).
- HIP 62913
-
is blended with the strong signal from nearby V* DU Cru (M2Iab) and may not truly have a mid-IR excess.
- HIP 83509
-
has been identified as a runaway star by Mdzinarishvili & Chargeishvili (2005). It has an uncertain parallax, but the extent of the W4 emission is 71,000 AU. Beyond the main emission surrounding the star, there is a possible bow-shock to the north-east.
- HIP 110119
-
is a runaway star (Tetzlaff et al., 2011). It is in a double system with HD 211880. Both are classified as WISE sources, but they blend in the W4 band with HD 211880 being dominant.
Of the three main-sequence stars here within 09–B3 and that may be analogs to our sample, one is likely to be a cirrus hot spot, the second a protoplanetary disk, and the third a bow-shock.
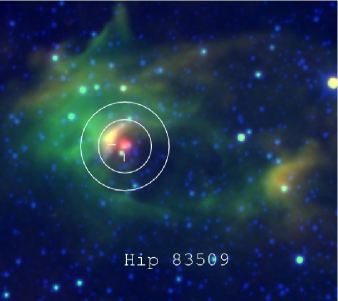
B.3. Stars with cirrus hot spots
Eighty-nine MW stars are resolved by WISE with sizes larger than 3,000 AU. Fifty-three of these are or may be within 09–B3. We have visually assessed their morphology from the WISE imaging and searched the literature for classifications. Many can be classified as one of the follwoing: obvious bow shocks, somewhat asymmetrical shapes around the stars (possible bow shocks), blends with other sources, or regular and round. Five (HIP 52628, HIP 56833, HIP 82936, HIP 100193, and HIP 100628) do not appear as bright sources in the W4 imaging, despite the significant values listed in the WISE all-sky survey catalog, and may be spurious detections. None are likely to be debris disks based on their large W4 sizes, and most can be identified as ISM interactions by their morphology. We show one example of a bow shock (HIP 83509) in Figure 12. The star has already been selected by our color cut from the WISE PSF-photometry, and including the nearby bow shock, as the SMC-matching aperture would, will drive the color redder. HIP 83509 is known to illuminate a reflection nebula (Herbst, 1975).
| HIP | Spectral | Resolution | |||||||
|---|---|---|---|---|---|---|---|---|---|
| (deg,J2000) | (deg,J2000) | Type | (mag) | (mag) | (mas) | (mas) | (AU) | ||
| 876 | 2.693195 | 58.769517 | B7V | 4.22 | 3.58 | 1.69 | 0.89 | 39.8 | 7100 |
| 2464 | 7.822530 | 71.122005 | B8 | 4.67 | 3.62 | 0.51 | 0.83 | 28.9 | 14000 |
| 7175 | 23.124723 | 67.961186 | B9 | 4.99 | 3.08 | 3.82 | 0.71 | 24.5 | 3100 |
| 11891 | 38.335785 | 61.521715 | O5e | 5.73 | 4.43 | 2.46 | 0.92 | 178.2 | 4900 |
| 13487 | 43.418713 | 64.451985 | B8 | 4.37 | 3.38 | 1.77 | 1.13 | 75.9 | 6800 |
| 15853 | 51.059112 | 61.538570 | B2III-IV | 6.02 | 4.47 | 3.09 | 1.06 | 193.9 | 3900 |
| 15941 | 51.317762 | 60.483711 | B2III | 5.11 | 4.21 | 1.57 | 1.14 | 120.7 | 7600 |
| 18701 | 60.097009 | 56.901598 | B0.5V | 5.20 | 3.52 | 0.20 | 1.21 | 62.7 | 9900 |
| 21779 | 70.184969 | 52.616737 | B3 | 5.18 | 3.70 | 0.77 | 1.21 | 24.7 | 9900 |
| 22237 | 71.768536 | -67.114753 | B1.5Ia: | 4.99 | 3.34 | 0.03 | 1.67 | 4.5 | 7200 |
| 25439 | 81.603582 | 39.646548 | B8 | 4.61 | 3.37 | 2.01 | 0.86 | 45.7 | 6000 |
| 26000 | 83.237848 | -4.566481 | B2Vvar | 5.53 | 4.46 | 0.66 | 0.73 | 78.9 | 16000 |
| 26237 | 83.846517 | -4.838358 | B2III… | 5.27 | 3.25 | 3.69 | 1.20 | 53.6 | 3300 |
| 26683 | 85.056416 | -1.462568 | B3Vn | 5.03 | 4.00 | 3.19 | 0.80 | 92.2 | 3800 |
| 26742 | 85.234877 | -1.507181 | B2IV | 4.94 | 3.72 | 3.03 | 0.55 | 28.6 | 4000 |
| 27040 | 86.021469 | 30.933819 | B3II | 4.58 | 3.96 | 0.55 | 1.18 | 90.2 | 10000 |
| 29115 | 92.098171 | -6.548652 | B3 | 6.30 | 4.54 | 1.30 | 1.13 | 122.8 | 9200 |
| 29120 | 92.109496 | -5.339577 | B1V | 5.46 | 4.20 | 0.70 | 0.81 | 76.1 | 15000 |
| 29127 | 92.133420 | 13.966932 | B1V | 5.13 | 4.34 | 2.31 | 2.96 | 42.1 | 4100 |
| 29147 | 92.232588 | 15.705052 | O7 | 4.05 | 3.34 | 1.03 | 1.04 | 18.7 | 12000 |
| 29216 | 92.414890 | 20.487626 | O6 | 5.01 | 5.07 | 3.28 | 0.71 | 112.5 | 3700 |
| 29310 | 92.697331 | 13.659469 | B1III | 4.27 | 3.90 | 1.49 | 0.51 | 135.4 | 8100 |
| 29587 | 93.525801 | 20.169705 | B1:V:nn | 5.38 | 3.89 | 0.78 | 0.91 | 42.8 | 13000 |
| 33432 | 104.283044 | -10.279858 | B7V | 7.52 | 4.44 | 0.79 | 1.06 | 27.5 | 11000 |
| 33457 | 104.338423 | -11.117642 | B3V | 4.06 | 3.14 | 1.39 | 1.60 | 3.9 | 7500 |
| 33735 | 105.119203 | -8.866022 | B6V | 6.96 | 3.53 | 3.82 | 1.23 | 90.3 | 3100 |
| 33953 | 105.677561 | -11.453210 | B3n | 4.83 | 3.70 | 2.41 | 1.09 | 27.9 | 5000 |
| 33987 | 105.782381 | -11.199171 | B5III | 4.40 | 3.44 | 3.52 | 1.10 | 21.7 | 3400 |
| 34116 | 106.106381 | -10.454372 | B0IV:e | 5.07 | 3.14 | 3.92 | 0.99 | 21.8 | 3100 |
| 34178 | 106.319780 | -12.326247 | B1II/III | 7.61 | 3.61 | 1.74 | 0.91 | 63.7 | 6900 |
| 35375 | 109.617448 | -17.189929 | B3II | 4.13 | 3.70 | 0.98 | 1.35 | 49.6 | 8900 |
| 39732 | 121.821833 | -29.078109 | B… | 5.44 | 4.05 | 2.38 | 2.02 | 5.8 | 5000 |
| 40016 | 122.585682 | -49.237347 | B3IV | 4.36 | 3.50 | 1.86 | 0.28 | 71.8 | 6500 |
| 40024 | 122.613515 | -49.164144 | B6V | 4.07 | 3.37 | 1.71 | 0.57 | 28.0 | 7000 |
| 42363 | 129.564128 | -39.417647 | B2/B3II | 4.18 | 3.36 | 0.14 | 0.73 | 47.9 | 16000 |
| 43955 | 134.281472 | -43.256186 | B3V | 4.17 | 3.65 | 2.98 | 0.63 | 64.7 | 4000 |
| 48868 | 149.503763 | -52.893065 | B9III/IV | 4.38 | 2.61 | 1.33 | 0.48 | 32.8 | 9000 |
| 50272 | 153.969193 | -57.375025 | B1Ia | 5.17 | 4.45 | 0.88 | 0.57 | 91.5 | 14000 |
| 50843 | 155.724336 | -59.624550 | B2evar | 5.89 | 2.78 | 1.69 | 0.82 | 101.8 | 7100 |
| 51063 | 156.500793 | -57.826934 | B1.5III | 6.72 | 4.52 | 2.14 | 0.96 | 167.6 | 5600 |
| 52628 | 161.433835 | -59.407818 | O5e | 4.50 | 4.73 | 1.22 | 0.45 | 8.1 | 9800 |
| 56021 | 172.225758 | -62.652734 | O6 | 5.28 | 5.00 | 1.81 | 0.76 | 127.5 | 6600 |
| 56134 | 172.601286 | -63.817226 | O9.5V: | 6.58 | 3.91 | 0.81 | 0.72 | 36.8 | 15000 |
| 56833 | 174.763656 | -63.429739 | O6 | 4.97 | 4.37 | 0.51 | 0.59 | 9.5 | 20000 |
| 65307 | 200.765817 | -63.061773 | O9.5V: | 5.24 | 3.91 | 0.01 | 1.21 | 18.9 | 9900 |
| 68564 | 210.545313 | -61.957903 | B8/B9II/III | 4.43 | 3.95 | 2.51 | 1.06 | 18.9 | 4800 |
| 68985 | 211.854676 | -61.354608 | B8/B9V | 8.72 | 3.88 | 3.30 | 1.66 | 107.5 | 3600 |
| 69582 | 213.640362 | -61.798978 | B5/B6V | 4.83 | 2.80 | 2.11 | 1.82 | 94.6 | 5700 |
| 75079 | 230.135491 | -59.543772 | B1III | 4.62 | 3.36 | 1.28 | 0.60 | 62.5 | 9400 |
| 76881 | 235.488359 | -56.612306 | B8/B9III | 5.59 | 4.15 | 2.69 | 1.68 | 35.1 | 4500 |
| 77452 | 237.199434 | -54.395655 | B2/B3Vnne | 6.26 | 4.11 | 2.62 | 0.86 | 60.5 | 4600 |
| 78034 | 239.007071 | -66.152566 | Be | 11.73 | 4.42 | 0.94 | 2.30 | 11.4 | 5200 |
| 79936 | 244.730729 | -50.391866 | B9V | 6.21 | 4.31 | 2.88 | 1.31 | 19.0 | 4200 |
| 81308 | 249.097980 | -45.397421 | B9IV | 4.06 | 4.93 | 1.17 | 1.34 | 46.7 | 9000 |
| 81711 | 250.349725 | -46.385713 | B9IV | 4.24 | 3.02 | 2.37 | 0.95 | 33.2 | 5100 |
| 82286 | 252.208104 | -39.771304 | B1Ib | 5.72 | 3.83 | 1.74 | 1.86 | 28.9 | 6500 |
| 82936 | 254.227790 | -40.512342 | O7 | 4.47 | 4.12 | 2.53 | 1.08 | 55.9 | 4700 |
| 85322 | 261.540553 | -34.557386 | B4II | 5.54 | 3.80 | 0.21 | 1.26 | 17.6 | 9500 |
| 85985 | 263.602138 | -32.504438 | B1:V:nn | 5.61 | 4.13 | 0.92 | 1.26 | 22.7 | 9500 |
| 88581 | 271.293962 | -24.398570 | O8 | 5.39 | 4.21 | 0.15 | 0.63 | 42.8 | 19000 |
| 88943 | 272.323748 | -23.988395 | B6III: | 4.24 | 3.61 | 2.18 | 0.67 | 76.0 | 5500 |
| 89647 | 274.416584 | -19.672176 | B1/B2III | 4.28 | 3.09 | 2.80 | 1.11 | 18.4 | 4300 |
| 89750 | 274.734115 | -13.808632 | B3Ib | 7.51 | 4.10 | 2.34 | 2.24 | 61.2 | 5100 |
| 89933 | 275.251235 | -17.151709 | B2/B3Ib/II | 4.83 | 4.52 | 1.53 | 1.10 | 60.0 | 7800 |
| 90225 | 276.139576 | -13.653548 | B3n+B0 | 7.91 | 4.20 | 0.18 | 1.85 | 49.0 | 6500 |
| 90707 | 277.603649 | 1.223237 | B7V | 4.67 | 2.51 | 3.82 | 1.52 | 65.6 | 3100 |
| 98418 | 299.954595 | 35.309314 | O7 | 7.03 | 5.09 | 1.89 | 0.98 | 143.8 | 6300 |
| 100193 | 304.840469 | 40.887906 | B2+… | 4.18 | 3.78 | 1.59 | 0.74 | 30.7 | 7500 |
| 100628 | 306.065481 | 42.300383 | B3n | 4.71 | 2.89 | 0.45 | 1.11 | 11.3 | 11000 |
| 102167 | 310.528596 | 43.184366 | O9p… | 6.13 | 5.24 | 1.38 | 0.90 | 241.5 | 8700 |
| 102219 | 310.671204 | 36.380868 | B0.5Ib | 5.29 | 4.57 | 1.06 | 0.68 | 126.3 | 11000 |
| 102274 | 310.840022 | 63.209122 | B5 | 6.84 | 4.50 | 0.67 | 0.51 | 97.0 | 18000 |
| 102410 | 311.294174 | 51.210552 | B0.5IV | 5.77 | 3.74 | 0.74 | 0.82 | 65.7 | 15000 |
| 102449 | 311.397001 | 46.350576 | O9V | 4.75 | 3.32 | 0.77 | 0.86 | 18.5 | 14000 |
| 103061 | 313.221695 | 42.607743 | B0V | 4.52 | 3.63 | 1.67 | 0.70 | 25.9 | 7200 |
| 103428 | 314.319092 | 48.295773 | B8Ib | 4.51 | 2.87 | 1.63 | 0.64 | 33.9 | 7400 |
| 105113 | 319.389464 | 60.100448 | B0V | 6.28 | 3.91 | 2.03 | 0.71 | 83.2 | 5900 |
| 106079 | 322.311852 | 44.338126 | B2V:nne: | 4.03 | 2.53 | 2.12 | 0.48 | 44.6 | 5700 |
| 106712 | 324.237729 | 68.185363 | B3V | 4.34 | 3.81 | 1.01 | 0.51 | 80.1 | 12000 |
| 106843 | 324.609513 | 56.973738 | B0V | 4.07 | 3.75 | 1.60 | 0.41 | 91.3 | 7500 |
| 106956 | 324.935149 | 58.245559 | B5 | 4.53 | 3.87 | 2.13 | 1.21 | 37.8 | 5600 |
| 107123 | 325.493871 | 58.500058 | B3 | 4.03 | 3.54 | 1.60 | 0.72 | 24.2 | 7500 |
| 110125 | 334.615847 | 63.222899 | B0.5V | 4.13 | 3.51 | 0.94 | 1.64 | 29.4 | 7300 |
| 110937 | 337.162696 | 58.845777 | B8 | 5.48 | 4.25 | 1.67 | 0.64 | 157.2 | 7200 |
| 111785 | 339.632630 | 55.834830 | B1:IV:nnpe | 5.84 | 3.37 | 1.76 | 0.84 | 58.1 | 6800 |
| 112887 | 342.912154 | 51.845116 | B | 11.84 | 4.53 | 0.72 | 3.49 | 3.4 | 3400 |
| 113224 | 343.940806 | 57.601924 | B0.5:IV: | 5.29 | 4.22 | 0.31 | 1.01 | 29.0 | 12000 |
| 113301 | 344.177296 | 62.624876 | B1V | 7.09 | 4.26 | 1.59 | 0.89 | 63.6 | 7500 |
| 113538 | 344.928631 | 62.777310 | B1.5Vn | 7.21 | 4.23 | 1.58 | 1.53 | 78.9 | 7600 |
Note. — Column 4 is the spectral type as taken from Hipparcos. Columns 5 and 6 list the colors taken from WISE and 2MASS with W3 and W4 effective wavelengths at 12 and 22 m. Column 7 lists the parallax from Hipparcos and column 8 lists the error. Column 9 lists the reduced that the W4 data is compatible with the PSF from the WISE catalog. Values above 3 are considered to indicate extended emission. Finally, column 10 lists the physical size for the 12″ W4 resolution. This is the minimum size for extended sources.
References
- Acke et al. (2012) Acke, B., Min, M., Dominik, C., et al. 2012, A&A, 540, A125
- Akeson et al. (2009) Akeson, R. L., Ciardi, D. R., Millan-Gabet, R., et al. 2009, ApJ, 691, 1896
- Alekseeva et al. (1996) Alekseeva, G. A., Arkharov, A. A., Galkin, V. D., et al. 1996, Baltic Astronomy, 5, 603
- Alexander et al. (2006a) Alexander, R. D., Clarke, C. J., & Pringle, J. E. 2006a, MNRAS, 369, 216
- Alexander et al. (2006b) —. 2006b, MNRAS, 369, 229
- André et al. (2010) André, P., Men’shchikov, A., Bontemps, S., et al. 2010, A&A, 518, L102
- Arny (1977) Arny, T. 1977, ApJ, 217, 83
- Artymowicz (1988) Artymowicz, P. 1988, ApJ, 335, L79
- Artymowicz & Clampin (1997) Artymowicz, P., & Clampin, M. 1997, ApJ, 490, 863
- Arzoumanian et al. (2011) Arzoumanian, D., André, P., Didelon, P., Könyves, V., et al. 2011, A&A, 529, L6
- Aumann et al. (1984) Aumann, H. H., Beichman, C. A., Gillett, F. C., et al. 1984, ApJ, 278, L23
- Backman (1996) Backman, D. E. 1996, in Bulletin of the American Astronomical Society, Vol. 28, AAS/Division for Planetary Sciences Meeting Abstracts #28, 1056
- Backman & Paresce (1993) Backman, D. E., & Paresce, F. 1993, in Protostars and Planets III, ed. E. H. Levy & J. I. Lunine, 1253–1304
- Balog et al. (2007) Balog, Z., Muzerolle, J., Rieke, G. H., et al. 2007, ApJ, 660, 1532
- Balog et al. (2008) Balog, Z., Rieke, G. H., Muzerolle, J., et al. 2008, ApJ, 688, 408
- Balog et al. (2006) Balog, Z., Rieke, G. H., Su, K. Y. L., et al. 2006, ApJ, 650, L83
- Beichman et al. (2006) Beichman, C. A., Bryden, G., Stapelfeldt, K. R., et al. 2006, ApJ, 652, 1674
- Bertin & Arnouts (1996) Bertin, E., & Arnouts, S. 1996, A&AS, 117, 393
- Boersma et al. (2010) Boersma, C., Bauschlicher, C. W., Allamandola, L. J., et al. 2010, A&A, 511, A32
- Bolatto et al. (2007) Bolatto, A. D., Simon, J. D., Stanimirović, S., et al. 2007, ApJ, 655, 212
- Booth et al. (2013) Booth, M., Kennedy, G., Sibthorpe, B., et al. 2013, MNRAS, 428, 1263
- Bouchet et al. (1985) Bouchet, P., Lequeux, J., Maurice, E., Prevot, L., & Prevot-Burnichon, M. L. 1985, A&A, 149, 330
- Boyer et al. (2010) Boyer, M. L., Sargent, B., van Loon, J. T., et al. 2010, A&A, 518, L142
- Broekhoven-Fiene et al. (2013) Broekhoven-Fiene, H., Matthews, B. C., Kennedy, G. M., et al. 2013, ApJ, 762, 52
- Burns et al. (1979) Burns, J. A., Lamy, P. L., & Soter, S. 1979, Icarus, 40, 1
- Calvet et al. (2002) Calvet, N., D’Alessio, P., Hartmann, L., et al. 2002, ApJ, 568, 1008
- Cardelli et al. (1989) Cardelli, J. A., Clayton, G. C., & Mathis, J. S. 1989, ApJ, 345, 245
- Carpenter et al. (2006) Carpenter, J. M., Mamajek, E. E., Hillenbrand, L. A., & Meyer, M. R. 2006, ApJ, 651, L49
- Carpenter et al. (2009) —. 2009, ApJ, 705, 1646
- Cesaroni et al. (2007) Cesaroni, R., Galli, D., Lodato, G., Walmsley, C. M., & Zhang, Q. 2007, Protostars and Planets V, 197
- Chen et al. (2005) Chen, C. H., Jura, M., Gordon, K. D., & Blaylock, M. 2005, ApJ, 623, 493
- Chen et al. (2007) Chen, C. H., Li, A., Bohac, C., et al. 2007, ApJ, 666, 466
- Chen et al. (2011) Chen, C. H., Mamajek, E. E., Bitner, M. A., et al. 2011, ApJ, 738, 122
- Chen et al. (2012) Chen, C. H., Pecaut, M., Mamajek, E. E., et al. 2012, ApJ, 756, 133
- Chen et al. (2006) Chen, C. H., Sargent, B. A., Bohac, C., et al. 2006, ApJS, 166, 351
- Chini et al. (1980) Chini, R., Elsaesser, H., & Neckel, T. 1980, A&A, 91, 186
- Chini et al. (2006) Chini, R., Hoffmeister, V. H., Nielbock, M., et al. 2006, ApJ, 645, L61
- Cieza et al. (2007) Cieza, L., Padgett, D. L., Stapelfeldt, K. R., et al. 2007, ApJ, 667, 308
- Cieza et al. (2012) Cieza, L. A., Schreiber, M. R., Romero, G. A., et al. 2012, ApJ, 750, 157
- Collins (1987) Collins, II, G. W. 1987, in IAU Colloq. 92: Physics of Be Stars, ed. A. Slettebak & T. P. Snow, 3–19
- Cote & Waters (1987) Cote, J., & Waters, L. B. F. M. 1987, A&A, 176, 93
- Dahm & Carpenter (2009) Dahm, S. E., & Carpenter, J. M. 2009, AJ, 137, 4024
- Debes et al. (2009) Debes, J. H., Weinberger, A. J., & Kuchner, M. J. 2009, ApJ, 702, 318
- Decin et al. (2011) Decin, L., Royer, P., Cox, N. L. J., et al. 2011, A&A, 534, A1
- Draine & Lee (1984) Draine, B. T., & Lee, H. M. 1984, ApJ, 285, 89
- Eiroa et al. (2010) Eiroa, C., Fedele, D., Maldonado, J., et al. 2010, A&A, 518, L131
- Eiroa et al. (2011) Eiroa, C., Marshall, J. P., Mora, A., et al. 2011, A&A, 536, L4
- Eiroa et al. (2013) —. 2013, ArXiv e-prints
- Ertel et al. (2012) Ertel, S., Wolf, S., Marshall, J. P., et al. 2012, A&A, 541, A148
- Espaillat et al. (2012) Espaillat, C., Ingleby, L., Hernández, J., et al. 2012, ApJ, 747, 103
- Evans & Howarth (2008) Evans, C. J., & Howarth, I. D. 2008, MNRAS, 386, 826
- Fazio et al. (2004) Fazio, G. G., Hora, J. L., Allen, L. E., et al. 2004, ApJS, 154, 10
- Gáspár et al. (2012) Gáspár, A., Psaltis, D., Rieke, G. H., & Özel, F. 2012, ApJ, 754, 74
- Gáspár et al. (2013) Gáspár, A., Rieke, G. H., & Balog, Z. 2013, ApJ, 768, 25
- Gáspár et al. (2008) Gáspár, A., Su, K. Y. L., Rieke, G. H., et al. 2008, ApJ, 672, 974
- Gaustad & van Buren (1993) Gaustad, J. E., & van Buren, D. 1993, PASP, 105, 1127
- Gehrz et al. (1974) Gehrz, R. D., Hackwell, J. A., & Jones, T. W. 1974, ApJ, 191, 675
- Gibson & Nordsieck (2003a) Gibson, S. J., & Nordsieck, K. H. 2003a, ApJ, 589, 347
- Gibson & Nordsieck (2003b) —. 2003b, ApJ, 589, 362
- Gordon et al. (2011) Gordon, K. D., Meixner, M., Meade, M. R., et al. 2011, AJ, 142, 102
- Gorlova et al. (2006) Gorlova, N., Rieke, G. H., Muzerolle, J., et al. 2006, ApJ, 649, 1028
- Goto et al. (2012) Goto, M., van der Plas, G., van den Ancker, M., et al. 2012, A&A, 539, A81
- Greaves et al. (2005) Greaves, J. S., Holland, W. S., Wyatt, M. C., et al. 2005, ApJ, 619, L187
- Harvey et al. (1996) Harvey, P. M., Smith, B. J., Difrancesco, J., Colome, C., & Low, F. J. 1996, ApJ, 471, 973
- Herbst (1975) Herbst, W. 1975, AJ, 80, 212
- Hildebrand (1983) Hildebrand, R. H. 1983, QJRAS, 24, 267
- Hillenbrand et al. (2008) Hillenbrand, L. A., Carpenter, J. M., Kim, J. S., et al. 2008, ApJ, 677, 630
- Hillenbrand et al. (1992) Hillenbrand, L. A., Strom, S. E., Vrba, F. J., & Keene, J. 1992, ApJ, 397, 613
- Hines et al. (2007) Hines, D. C., Schneider, G., Hollenbach, D., et al. 2007, ApJ, 671, L165
- Hodapp et al. (2009) Hodapp, K. W., Iserlohe, C., Stecklum, B., & Krabbe, A. 2009, ApJ, 701, L100
- Holland et al. (1998) Holland, W. S., Greaves, J. S., Zuckerman, B., et al. 1998, Nature, 392, 788
- Hollenbach et al. (1994) Hollenbach, D., Johnstone, D., Lizano, S., & Shu, F. 1994, ApJ, 428, 654
- Houck et al. (2004) Houck, J. R., Roellig, T. L., Van Cleve, J., et al. 2004, in Society of Photo-Optical Instrumentation Engineers (SPIE) Conference Series, Vol. 5487, Society of Photo-Optical Instrumentation Engineers (SPIE) Conference Series, ed. J. C. Mather, 62–76
- Hunter et al. (2008) Hunter, I., Lennon, D. J., Dufton, P. L., et al. 2008, A&A, 479, 541
- Jura et al. (1995) Jura, M., Ghez, A. M., White, R. J., et al. 1995, ApJ, 445, 451
- Jura et al. (1998) Jura, M., Malkan, M., White, R., et al. 1998, ApJ, 505, 897
- Kalas et al. (2007) Kalas, P., Fitzgerald, M. P., & Graham, J. R. 2007, ApJ, 661, L85
- Kalas et al. (2002) Kalas, P., Graham, J. R., Beckwith, S. V. W., Jewitt, D. C., & Lloyd, J. P. 2002, ApJ, 567, 999
- Kalas et al. (2005) Kalas, P., Graham, J. R., & Clampin, M. 2005, Nature, 435, 1067
- Kamp & Paunzen (2002) Kamp, I., & Paunzen, E. 2002, MNRAS, 335, L45
- Kenyon & Bromley (2002) Kenyon, S. J., & Bromley, B. C. 2002, AJ, 123, 1757
- Kenyon & Bromley (2004) —. 2004, AJ, 127, 513
- Kenyon & Bromley (2008) —. 2008, ApJS, 179, 451
- Kenyon & Bromley (2010) —. 2010, ApJS, 188, 242
- Kloppenborg et al. (2010) Kloppenborg, B., Stencel, R., Monnier, J. D., et al. 2010, Nature, 464, 870
- Kobulnicky et al. (2012) Kobulnicky, H. A., Lundquist, M. J., Bhattacharjee, A., & Kerton, C. R. 2012, AJ, 143, 71
- Krivov (2010) Krivov, A. V. 2010, Research in Astronomy and Astrophysics, 10, 383
- Kron (1980) Kron, R. G. 1980, ApJS, 43, 305
- Krumholz et al. (2009) Krumholz, M. R., Klein, R. I., McKee, C. F., Offner, S. S. R., & Cunningham, A. J. 2009, Science, 323, 754
- Lebouteiller et al. (2010) Lebouteiller, V., Bernard-Salas, J., Sloan, G. C., & Barry, D. J. 2010, PASP, 122, 231
- Leroy et al. (2007) Leroy, A., Bolatto, A., Stanimirović, S., et al. 2007, ApJ, 658, 1027
- Löhne et al. (2008) Löhne, T., Krivov, A. V., & Rodmann, J. 2008, ApJ, 673, 1123
- Magakian (2003) Magakian, T. Y. 2003, A&A, 399, 141
- Makovoz & Marleau (2005) Makovoz, D., & Marleau, F. R. 2005, PASP, 117, 1113
- Mann & Williams (2009) Mann, R. K., & Williams, J. P. 2009, ApJ, 694, L36
- Mannings & Barlow (1998) Mannings, V., & Barlow, M. J. 1998, ApJ, 497, 330
- Martínez-Galarza et al. (2009) Martínez-Galarza, J. R., Kamp, I., Su, K. Y. L., et al. 2009, ApJ, 694, 165
- Mathis et al. (1977) Mathis, J. S., Rumpl, W., & Nordsieck, K. H. 1977, ApJ, 217, 425
- Matthews et al. (2010) Matthews, B. C., Sibthorpe, B., Kennedy, G., et al. 2010, A&A, 518, L135
- McDonald et al. (2012) McDonald, I., Zijlstra, A. A., & Boyer, M. L. 2012, MNRAS, 427, 343
- Mdzinarishvili & Chargeishvili (2005) Mdzinarishvili, T. G., & Chargeishvili, K. B. 2005, A&A, 431, L1
- Merrill (1915) Merrill, P. W. 1915, ApJ, 41, 247
- Miroshnichenko & Bjorkman (2000) Miroshnichenko, A. S., & Bjorkman, K. S. 2000, in Astronomical Society of the Pacific Conference Series, Vol. 214, IAU Colloq. 175: The Be Phenomenon in Early-Type Stars, ed. M. A. Smith, H. F. Henrichs, & J. Fabregat, 484
- Moór et al. (2011) Moór, A., Pascucci, I., Kóspál, Á., et al. 2011, ApJS, 193, 4
- Morales et al. (2011) Morales, F. Y., Rieke, G. H., Werner, M. W., et al. 2011, ApJ, 730, L29
- Morales et al. (2009) Morales, F. Y., Werner, M. W., Bryden, G., et al. 2009, ApJ, 699, 1067
- Müller et al. (2010) Müller, S., Löhne, T., & Krivov, A. V. 2010, ApJ, 708, 1728
- O’Brien & Greenberg (2003) O’Brien, D. P., & Greenberg, R. 2003, Icarus, 164, 334
- Ott (2010) Ott, S. 2010, in Astronomical Society of the Pacific Conference Series, Vol. 434, Astronomical Data Analysis Software and Systems XIX, ed. Y. Mizumoto, K.-I. Morita, & M. Ohishi, 139
- Oudmaijer et al. (1992) Oudmaijer, R. D., van der Veen, W. E. C. J., Waters, L. B. F. M., et al. 1992, A&AS, 96, 625
- Perryman et al. (1997) Perryman, M. A. C., Lindegren, L., Kovalevsky, J., et al. 1997, A&A, 323, L49
- Pilbratt et al. (2010) Pilbratt, G. L., Riedinger, J. R., Passvogel, T., et al. 2010, A&A, 518, L1
- Poglitsch et al. (2010) Poglitsch, A., Waelkens, C., Geis, N., et al. 2010, A&A, 518, L2
- Pontoppidan et al. (2010) Pontoppidan, K. M., Salyk, C., Blake, G. A., et al. 2010, ApJ, 720, 887
- Porter & Rivinius (2003) Porter, J. M., & Rivinius, T. 2003, PASP, 115, 1153
- Rebull et al. (2007) Rebull, L. M., Stapelfeldt, K. R., Evans, II, N. J., et al. 2007, ApJS, 171, 447
- Rebull et al. (2008) Rebull, L. M., Stapelfeldt, K. R., Werner, M. W., et al. 2008, ApJ, 681, 1484
- Rhee et al. (2007) Rhee, J. H., Song, I., Zuckerman, B., & McElwain, M. 2007, ApJ, 660, 1556
- Richling & Yorke (1997) Richling, S., & Yorke, H. W. 1997, A&A, 327, 317
- Rieke et al. (2005) Rieke, G. H., Su, K. Y. L., Stansberry, J. A., et al. 2005, ApJ, 620, 1010
- Rieke et al. (2004) Rieke, G. H., Young, E. T., Engelbracht, C. W., et al. 2004, ApJS, 154, 25
- Roussel (2012) Roussel, H. 2012, ApJ
- Sadavoy et al. (2012) Sadavoy, S. I., di Francesco, J., André, P., et al. 2012, A&A, 540, A10
- Schlegel et al. (1998) Schlegel, D. J., Finkbeiner, D. P., & Davis, M. 1998, ApJ, 500, 525
- Schmidt-Kaler (1982) Schmidt-Kaler, T. 1982, Mitteilungen der Astronomischen Gesellschaft Hamburg, 57, 9
- Sellgren (1984) Sellgren, K. 1984, ApJ, 277, 623
- Sellgren et al. (2007) Sellgren, K., Uchida, K. I., & Werner, M. W. 2007, ApJ, 659, 1338
- Sheets et al. (2013) Sheets, H. A., Bolatto, A. D., Sandstrom, K., et al. 2013, in prep.
- Sibthorpe et al. (2010) Sibthorpe, B., Vandenbussche, B., Greaves, J. S., et al. 2010, A&A, 518, L130
- Sierchio et al. (2010) Sierchio, J. M., Rieke, G. H., Su, K. Y. L., et al. 2010, ApJ, 712, 1421
- Skrutskie et al. (2006) Skrutskie, M. F., Cutri, R. M., Stiening, R., et al. 2006, AJ, 131, 1163
- Skrutskie et al. (1990) Skrutskie, M. F., Dutkevitch, D., Strom, S. E., et al. 1990, AJ, 99, 1187
- Smith & Terrile (1984) Smith, B. A., & Terrile, R. J. 1984, Science, 226, 1421
- Smith et al. (2007) Smith, J. D. T., Draine, B. T., Dale, D. A., et al. 2007, ApJ, 656, 770
- Smith & Wyatt (2010) Smith, R., & Wyatt, M. C. 2010, A&A, 515, A95
- Stark et al. (2009) Stark, C. C., Kuchner, M. J., Traub, W. A., et al. 2009, ApJ, 703, 1188
- Stone (1996) Stone, R. P. S. 1996, ApJS, 107, 423
- Su et al. (2005) Su, K. Y. L., Rieke, G. H., Misselt, K. A., et al. 2005, ApJ, 628, 487
- Su et al. (2006) Su, K. Y. L., Rieke, G. H., Stansberry, J. A., et al. 2006, ApJ, 653, 675
- Sylvester et al. (1997) Sylvester, R. J., Skinner, C. J., & Barlow, M. J. 1997, MNRAS, 289, 831
- Sylvester et al. (1996) Sylvester, R. J., Skinner, C. J., Barlow, M. J., & Mannings, V. 1996, MNRAS, 279, 915
- Tetzlaff et al. (2011) Tetzlaff, N., Neuhäuser, R., & Hohle, M. M. 2011, MNRAS, 410, 190
- Touhami et al. (2010) Touhami, Y., Richardson, N. D., Gies, D. R., et al. 2010, PASP, 122, 379
- Trilling et al. (2008) Trilling, D. E., Bryden, G., Beichman, C. A., et al. 2008, ApJ, 674, 1086
- Tsvetkov et al. (2008) Tsvetkov, A. S., Popov, A. V., & Smirnov, A. A. 2008, Astronomy Letters, 34, 17
- Udalski et al. (1998) Udalski, A., Szymański, M., Kubiak, M., et al. 1998, Acta Astronomica, 48, 147
- van Buren & McCray (1988) van Buren, D., & McCray, R. 1988, ApJ, 329, L93
- van den Ancker et al. (1998) van den Ancker, M. E., de Winter, D., & Tjin A Djie, H. R. E. 1998, A&A, 330, 145
- van Leeuwen (2007) van Leeuwen, F. 2007, A&A, 474, 653
- van Loon & Oliveira (2003) van Loon, J. T., & Oliveira, J. M. 2003, A&A, 405, L33
- Van Winckel (1997) Van Winckel, H. 1997, A&A, 319, 561
- Vandenbussche et al. (2010) Vandenbussche, B., Sibthorpe, B., Acke, B., et al. 2010, A&A, 518, L133
- Waters et al. (1987) Waters, L. B. F. M., Cote, J., & Lamers, H. J. G. L. M. 1987, A&A, 185, 206
- Waters & Waelkens (1998) Waters, L. B. F. M., & Waelkens, C. 1998, ARA&A, 36, 233
- Weaver & Babcock (2004) Weaver, W. B., & Babcock, A. 2004, PASP, 116, 1035
- Weldrake et al. (2004) Weldrake, D. T. F., Sackett, P. D., Bridges, T. J., & Freeman, K. C. 2004, AJ, 128, 736
- Werner et al. (2004a) Werner, M. W., Roellig, T. L., Low, F. J., et al. 2004a, ApJS, 154, 1
- Werner et al. (2004b) Werner, M. W., Uchida, K. I., Sellgren, K., et al. 2004b, ApJS, 154, 309
- Williams & Cieza (2011) Williams, J. P., & Cieza, L. A. 2011, ARA&A, 49, 67
- Wolk & Walter (1996) Wolk, S. J., & Walter, F. M. 1996, AJ, 111, 2066
- Wright et al. (2010) Wright, E. L., Eisenhardt, P. R. M., Mainzer, A. K., et al. 2010, AJ, 140, 1868
- Wyatt (2008) Wyatt, M. C. 2008, ARA&A, 46, 339
- Wyatt et al. (2011) Wyatt, M. C., Clarke, C. J., & Booth, M. 2011, Celestial Mechanics and Dynamical Astronomy, 111, 1
- Wyatt et al. (2012) Wyatt, M. C., Kennedy, G., Sibthorpe, B., et al. 2012, MNRAS, 424, 1206
- Yorke & Sonnhalter (2002) Yorke, H. W., & Sonnhalter, C. 2002, ApJ, 569, 846
- Yorke & Welz (1996) Yorke, H. W., & Welz, A. 1996, A&A, 315, 555
- Zaritsky et al. (2002) Zaritsky, D., Harris, J., Thompson, I. B., Grebel, E. K., & Massey, P. 2002, AJ, 123, 855