A search for Cii-158m line emission in HCM 6A, a Lyman- emitter at
Abstract
We report a Plateau de Bure interferometer search for Cii-158m emission from HCM 6A, a lensed Lyman- emitter (LAE) at . Our non-detections of Cii-158m line emission and 1.2 mm radio continuum emission yield limits of L L⊙ on the Cii-158m line luminosity and S mJy on the 1.2 mm flux density. The local conversion factor between LCII and star formation rate (SFR) yields an SFR M⊙ yr-1, times lower than that inferred from the ultraviolet (UV) continuum, suggesting that the local factor may not be applicable in high- LAEs. The non-detection of 1.2 mm continuum emission yields a total SFR M⊙ yr-1; any obscured star formation is thus within a factor of two of the visible star formation. Our best-fit model to the rest-frame UV/optical spectral energy distribution of HCM 6A yields a stellar mass of M⊙ and an SFR of M⊙ yr-1, with negligible dust obscuration. We fortuitously detect CO J emission from a galaxy in the foreground cluster Abell 370, obtaining a CO line luminosity of L K km s-1 pc2, and a molecular gas mass of M M⊙, for a CO-to-H2 conversion factor of 4.6 M⊙ (K km s-1 pc2)-1.
1 Introduction
A large population of Lyman- emitters (LAEs) have recently been detected at , towards the end of the epoch of reionization (e.g. Hu et al. 2002a; Taniguchi et al. 2005; Kashikawa et al. 2011). LAEs appear to be normal star-forming galaxies, with star-formation rates (SFRs) of M⊙ yr-1. Their space density is sufficiently high that low-luminosity LAEs may be the primary source of the UV photon background required for reionization (Kashikawa et al. 2011). Detailed studies of the high- LAE population are hence of much interest.
At high redshifts, , and for massive galaxies and quasars, radio CO lines have proved good tracers of the gas associated with star formation (e.g. Walter et al. 2003; Wang et al. 2010, 2011). Unfortunately, deep CO searches in LAEs at similar redshifts () have so far only yielded non-detections (Wagg et al. 2009; Wagg & Kanekar 2012).
The Cii-158m transition is one of the brightest lines in the spectrum of any galaxy, often carrying % of the total galaxy luminosity (e.g. Crawford et al. 1985; Stacey et al. 1991). It is the primary coolant of the diffuse interstellar medium at temperatures K (e.g. Wolfire et al. 1995) and thus an excellent tracer of cold neutral gas, the fuel for star formation. While Cii-158m emission has long been known to arise from photo-dissociation regions (e.g. Crawford et al. 1985), the Cii-158m emission from extended diffuse gas in normal galaxies has been recently shown to be comparable to that from dense star-forming regions (Pierini et al. 2001). Cii-158m emission studies may thus also provide information on the kinematics and dynamical masses of high- galaxies, besides the spatial distribution of star-forming gas.
The Cii-158m transition thus provides a useful tracer of physical conditions in star-forming galaxies (e.g. Carilli & Walter 2013). While Cii-158m emission has been found in a number of star-forming galaxies at (Stacey et al. 2010), most high- () searches have targeted massive objects with a high far-infrared (FIR) luminosity, L L⊙ (e.g. Maiolino et al. 2005, 2009; Wagg et al. 2010; De Breuck et al. 2011). Recently, the first searches for Cii-158m emission in LAEs were reported by Walter et al. (2012). In this Letter, we report results from a deep search for Cii-158m emission in a lensed LAE at .
2 HCM 6A: A lensed LAE at
HCM 6A was identified by Hu et al. (2002a) as an LAE at in the field of the galaxy cluster Abell 370. A lensing model for Abell 370 yields a magnification of at the LAE location (Kneib et al. 1993). Hu et al. (2002a) obtained an SFR of M⊙ yr-1 (see Hu et al. 2002b) from the rest-frame UV continuum, a value typical of the LAE population (e.g. Taniguchi et al. 2005; Cowie et al. 2011). However, a far higher SFR, M⊙ yr-1, was inferred by Chary et al. (2005) from the excess emission detected in the Spitzer 4.5 m image of the field, suggesting significant dust extinction of the UV continuum. A high SFR, M⊙ yr-1, was also obtained by Schaerer & Pelló (2005), from modelling the spectral energy distribution (SED). Conversely, Boone et al. (2007) used a 1.2 mm MAMBO-2 image to obtain a strong constraint on the far-infrared (FIR) luminosity, and thence on the SFR, M⊙ yr-1. The high magnification factor and the possible high SFR makes HCM 6A an excellent target for a search for Cii-158m emission from a high- LAE.
3 Observations, data analysis and results
We searched for redshifted Cii-158m line emission from HCM 6A using five telescopes of the Plateau de Bure Interferometer (PdBI) on August 18 and 21, 2009, with the array in the compact 5Dq configuration. The observations used a bandwidth of 1 GHz, centred at the redshifted Cii-158m line frequency of 251.395 GHz, with two orthogonal polarizations and 256 channels. The velocity coverage was km s-1, with a velocity resolution of km s-1. This coverage is sufficient to cover errors in the Ly emission redshift due to Ly absorption in the IGM, as well as scenarios where the Ly emission arises from outflowing gas (typical velocities of a few hundred km s-1 for small galaxies like LAEs).
The complex antenna gains were calibrated on the nearby quasars 0235+164 and 0336019, the antenna bandpass shapes measured on 3C454.3, and the flux density scale derived from observations of MWC349. The total observing time was 18 hours, in two full-synthesis tracks, with an on-source integration time of 10.5 hours. System temperatures were lower than 200 K during most of the run.
The data were analysed using standard calibration procedures in the GILDAS111http://www.iram.fr/IRAMFR/GILDAS package, followed by imaging in the AIPS package. Line-free channels were averaged together to produce a “channel-0” dataset for the purpose of continuum imaging; our final continuum map has an angular resolution of and a root-mean-square (RMS) noise of 0.16 mJy/Bm. No radio continuum emission was detected in the field.
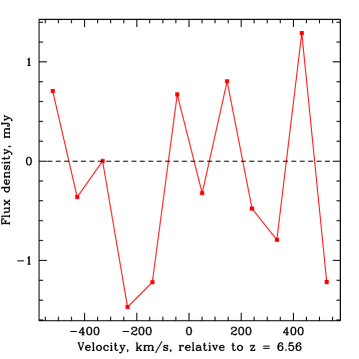
The final image cube was made using “natural” weighting, to maximize the sensitivity, after Hanning-smoothing the visibility data, and resampling to a velocity resolution of 100 km s-1. No line emission was detected at the location of HCM 6A in the cube, but a strong emission feature was detected south-west of HCM 6A. This was identified as redshifted CO J=3-2 emission from a galaxy in the foreground cluster, at (see below). The spectrum obtained at the location of HCM 6A in the CLEAN’ed image cube is shown in the left panel of Fig. 1, after smoothing to, and resampling at, a resolution of km s-1. It has an RMS noise of 0.6 mJy per 100 km s-1 channel (measured in the image plane).
The optical image of HCM 6A is elongated along a position angle of 110∘, with a length of (Hu et al. 2002a). The extended structure is covered by two of our synthesized beams; our limits on the total Cii-158m luminosity and the 1.2 mm continuum flux density are hence worse by a factor of than the limits from a single beam. The non-detections of Cii-158m line emission and 1.2 mm radio continuum emission from HCM 6A then yield the upper limits L L⊙ on the Cii-158m line luminosity (assuming a line FWHM of 100 km s-1, typical for small galaxies) and mJy, after correcting the former for the magnification factor of 4.5.222We use a Lambda-CDM model with km s-1 Mpc-1, and (Spergel et al. 2007).
We also revisited the Spitzer photometry of HCM 6A (Chary et al. 2005). Since those results, which used data from Spitzer program 64 with an integration time of 2400s, the field has been observed four times in programs 137 and 60034. We have re-analyzed all these data, clearly detecting HCM 6A in each epoch. The total exposure time corresponds to more than 10 hrs of imaging.
We obtained the post-Basic Calibrated Data mosaics of the HCM 6A field for each program from the Spitzer Heritage Archive. The astrometric alignment of each mosaic was assessed through bright sources. Of the three programs, the astrometric alignment of program 60034 appears to be times worse than the others, with a median offset of relative to the location of the same sources in the Sloan Digital Sky Survey images. Given the high signal-to-noise ratio of the source in each of the mosaics, we simply ignore the frames with worse astrometry rather than applying an astrometric correction to those frames.
The m and m photometry of HCM 6A was carried out both in the mosaics from the individual Spitzer observations, as well as from a super-mosaic of all the data with good astrometry. The super-mosaic was constructed using swarp, via an integration-time-weighted median combination of the mosaics with good astrometry.
Due to the contamination of the flux density of HCM 6A by the bright extended spiral galaxy 5 to the south-west, we used galfit to model the spatial profile of the spiral and subtract it out. HCM 6A’s flux density in the different mosaics spans the range Jy at m, and Jy at m, with systematics from the subtraction of the spiral dominating the errors. The statistical uncertainty on the flux density values is Jy.
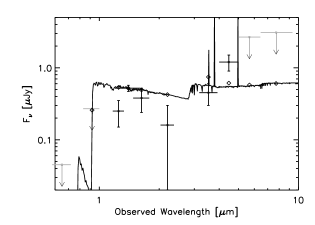
We used a modified version of the Bruzual & Charlot (2003) (BC03) population synthesis models to fit the complete SED of HCM 6A over the rest-frame UV to optical wavelength range, using our Spitzer measurements, the recent m detection (Cowie et al. 2011), and the data of Hu et al. (2002a). Our modification of the BC03 model involved the inclusion of nebular line emission, particularly the energetically important Ly, [OII], H, [Oiii], H and [Nii] lines. The relative line ratios correspond to those observed in nearby H emitters, which have been argued to be local analogs of high- star-forming galaxies (Shim & Chary 2013). The absolute line strengths were calibrated with respect to the FUV continuum at 1500Å derived from the BC03 models. Since nebular line emission is correlated with Lyman-continuum emission and not FUV continuum emission, this is potentially an inaccurate assumption. We added these emission lines to the BC03 templates for stellar photospheric emission and then fit the multi-wavelength photometry, taking the IGM absorption into account. The high signal-to-noise of the photometry in Cowie et al. (2011) drives the best-fit model, shown in Fig. 3; this does a poor job of reproducing the Spitzer photometry. While the excess emission in the 4.5m band suggests H contamination (Chary et al. 2005), the Spitzer photometry is affected by systematics due to source confusion with the foreground spiral. Our best-fit SED model yields a stellar mass of M⊙ and an SFR of M⊙ yr-1 for HCM 6A, with negligible dust obscuration.
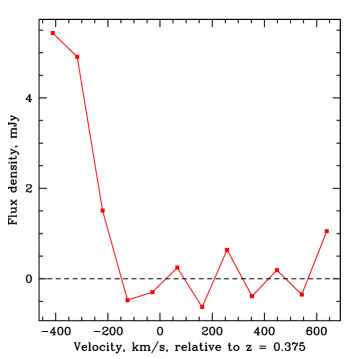
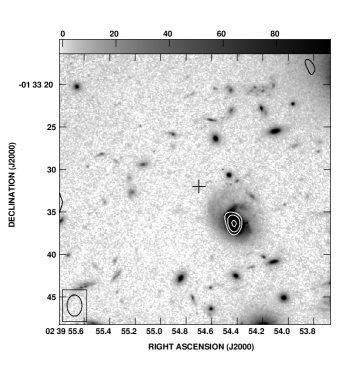
The CO J=3-2 spectrum obtained towards the galaxy in Abell 370 is shown in the right panel of Fig. 1, again at a resolution of km s-1, but with the velocity scale relative to the redshifted CO J=3-2 line frequency at . Fig. 2 shows an overlay of the integrated emission (in contours) on an optical image from the Advanced Camera for Surveys (ACS) onboard the Hubble Space Telescope (HST) in the F814W band (Richard et al. 2010). The emission feature clearly arises from the bright cluster galaxy to the southwest of HCM 6A. Unfortunately, the feature is right at the edge of our observing band, with part of the emission outside the band. We hence obtain a lower limit to the line flux of Jy km s-1, after “CLEAN”ing the cube. Assuming that the CO J=3-2 line is thermalized, this implies a CO line luminosity of L K km s-1 pc2.
4 Discussion
It has been suggested that the Cii-158m line luminosity might be used to estimate the SFR in star-forming galaxies (e.g. Stacey et al. 1991; Boselli et al. 2002; de Looze et al. 2011), unbiased by dust extinction. de Looze et al. (2011) found a good correlation between the Cii-158m line luminosity and the SFR (determined from a combination of the far-UV continuum and the 24 m continuum magnitudes) for 24 nearby star-forming galaxies, with Log[SFR] , The relation, which has a dispersion of dex, is expected to be applicable to star-forming galaxies with SFR M⊙ yr.
Our non-detection of Cii-158m emission in HCM 6A gives L L⊙. This is a significantly tighter constraint than obtained by Walter et al. (2012) in two LAEs at , mostly due to the large magnification factor in HCM 6A. Using the relation of de Looze et al. (2011), this implies an upper limit of M⊙ yr-1 to the total SFR (both obscured and unobscured). However, the lower limit to the SFR from the UV continuum is M⊙ yr-1, a factor of higher than the above upper limit. Further, the discrepancy between the predicted and observed SFRs would be exacerbated if dust extinction is indeed significant in the LAE (Chary et al. 2005; Schaerer & Pelló 2005). Our results thus suggest that the local relation between Cii-158m line luminosity and SFR may not be applicable to high- LAEs (although we note that the dispersion in the local relation is a factor of ).
Our upper limit to the 1.2 mm radio continuum flux density of HCM 6A ( mJy) is slightly tighter than that of Boone et al. (2007) ( mJy). Since the observing frequency of 1.2 mm corresponds to a rest frequency of m at , we will use the conversion factor of Calzetti et al. (2010) (valid for star-forming and starburst galaxies) to convert from the m luminosity to an SFR. We obtain a upper limit of M⊙ yr-1 on the SFR, after including the lensing factor of 4.5. This is within a factor of 3 of the SFR derived from the UV continuum (Hu et al. 2002a), indicating that any obscured star formation in HCM 6A is at most two times larger than the visible star formation. Using the same assumptions as Boone et al. (2007) yields a SFR upper limit of M⊙ yr-1, and does not significantly change the above result.
Our best-fit SED model yields an SFR of M⊙ yr-1, consistent with the SFR estimates from the UV continuum and the upper limit to the 1.2 mm continuum flux density. Chary et al. (2005) inferred a far higher SFR ( M⊙ yr-1) from the excess 4.5 m emission, assuming this to arise from H contamination. However, the SFR derived from the H line flux critically depends on the age of the stellar population. If HCM 6A is indeed similar in physical properties to the H emitters reported in Shim et al. (2011), and the local H emitters of Shim & Chary (2013), the photometry is dominated by a population of massive O stars which excite H emission due to their strong ionizing photon field. In such a situation, the same H line flux corresponds to a lower SFR than that obtained from the standard calibration (Kennicutt 1998). Thus, depending on the age of the stellar population, the same H line flux could correspond to a SFR in the range M⊙/yr.
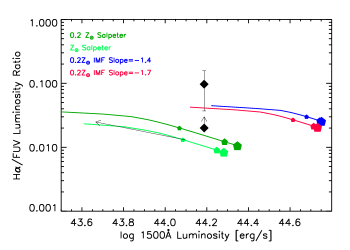
The ratio of a galaxy’s luminosity in the H and FUV bands is a sensitive tracer of the properties of the stellar population, including its metallicity, initial mass function (IMF) and age, and the extent of dust obscuration (e.g. Kennicutt 1998; Shim et al. 2011). We note that the SFR estimates from the UV continuum and the H line are only valid for a Salpeter IMF and a 100-Myr-old continuously star-forming stellar population. At low ages ( Myr), there are more Lyman-continuum and UV photons produced per unit baryon in stars; a lower SFR can thus yield a higher H/UV flux ratio. Comparing the observed ratio in high- LAEs with predictions from population synthesis models thus provides insights on early stellar populations. We have investigated this via a simulation in Starburst99 (Leitherer et al. 1999), using constant star-formation models (SFR M⊙ yr-1) with a range of metallicities () and IMFs. In HCM 6A, the measured H/FUV ratio is , including systematic errors in the H luminosity; this is consistent with values expected from low-metallicity young stellar populations with a top-heavy IMF (see Fig. 4). However, the intrinsic ratio could be lower than this if dust preferentially obscures the FUV continuum. Combining our upper limit on the 1.2 mm flux density with the FUV photometry yields a lower limit of on the H/FUV ratio, and thus an allowed range of , marginally consistent with values expected from standard stellar populations and IMFs at low metallicity. Note that increasing the SFR would cause the four curves to shift towards the right. While a young ( Myr) starburst can explain the observed ratio, such an age is unlikely due to the low probability of detecting such a young starburst at a time when the Universe is Gyr old.
For the galaxy detected in CO J=3-2 emission, assuming a CO-to-H2 conversion factor allows us to infer its molecular gas mass. The galaxy has been classified as a spiral by Mellier et al. (1988), based on its optical colours. We hence use the Milky Way conversion factor M⊙ (K km s-1 pc-2)-1 (Solomon & Barrett 1991) to obtain M M⊙. This assumes that the CO J=3-2 transition is thermalized. However, Dannerbauer et al. (2009) find that large spiral galaxies at have sub-thermal CO J=3-2 line emission, similar to the situation in the Galaxy (e.g. Fixsen et al. 1999). Our estimate thus provides a lower limit to the molecular gas mass because (1) the CO J=3-2 emission may be sub-thermal, and (2) part of the CO emission lies outside our observing band. Finally, we do not spatially resolve the CO emission, indicating that it arises from a region smaller than kpc kpc.
The galaxy (BO 39) is located kpc from the cluster centre, well within the cluster virial radius ( Mpc); it has a velocity of km s-1 relative to (Mellier et al. 1988). The detection of CO emission from a galaxy close to the centre of a large cluster allows a test of whether ram pressure stripping can denude a galaxy of its molecular gas, as is believed to occur for the atomic gas (e.g. Gunn & Gott 1972; Chung et al. 2007). We note that the CO line emission peaks at , while the galaxy redshift is (Mellier et al. 1988). Follow-up mapping CO J=1-0 studies will be of much interest.
5 Summary
We report strong constraints on the Cii-158m line luminosity and the 1.2 mm radio continuum flux density of the LAE, HCM 6A, from a PdBI imaging study. The Cii-158m non-detection suggests that the local conversion factor from Cii-158m line luminosity to SFR may not be applicable in high- galaxies. Our upper limit to the SFR from the 1.2 mm continuum non-detection indicates that the LAE does not have significant obscured star formation. Our best-fit model to the SED of HCM 6A yields a stellar mass of M⊙ and an SFR of M⊙ yr-1, with negligible dust obscuration. This is consistent with the SFR estimates from the UV continuum and the 1.2 mm radio continuum. We detect CO J=3-2 emission from a spiral galaxy in the foreground cluster Abell 370, and obtain the lower limit M M⊙ on its molecular gas mass.
Acknowledgments
NK, JW and CC are grateful for support from the Max-Planck Society and the Alexander von Humboldt Foundation. NK acknowledges support from the Department of Science and Technology through a Ramanujan Fellowship. The National Radio Astronomy Observatory is a facility of the National Science Foundation operated under cooperative agreement by Associated Universities, Inc.
References
- Boone et al. (2007) Boone, F., Schaerer, D., Pelló, R., Combes, F., & Egami, E. 2007, A&A, 475, 513
- Boselli et al. (2002) Boselli, A., Gavazzi, G., Lequeux, J., & Pierini, D. 2002, A&A, 385, 454
- Bruzual & Charlot (2003) Bruzual, G. & Charlot, S. 2003, MNRAS, 344, 1000
- Calzetti et al. (2010) Calzetti, D., Wu, S.-Y., Hong, S., Kennicutt, R. C., Lee, J. C., Dale, D. A., Engelbracht, C. W., van Zee, L., Draine, B. T., Hao, C.-N., Gordon, K. D., Moustakas, J., Murphy, E. J., Regan, M., Begum, A., Block, M., Dalcanton, J., Funes, J., Gil de Paz, A., Johnson, B., Sakai, S., Skillman, E., Walter, F., Weisz, D., Williams, B., & Wu, Y. 2010, ApJ, 714, 1256
- Carilli & Walter (2013) Carilli, C. L. & Walter, F. 2013, ARA&A (in press), arXiv:1301:0371
- Chary et al. (2005) Chary, R.-R., Stern, D., & Eisenhardt, P. 2005, ApJ, 635, L5
- Chung et al. (2007) Chung, A., van Gorkom, J. H., Kenney, J. D. P., & Vollmer, B. 2007, ApJ, 659, L115
- Cowie et al. (2011) Cowie, L. L., Hu, E. M., & Songaila, A. 2011, ApJ, 735, L38
- Crawford et al. (1985) Crawford, M. K., Genzel, R., Townes, C. H., & Watson, D. M. 1985, ApJ, 291, 755
- Dannerbauer et al. (2009) Dannerbauer, H., Daddi, E., Riechers, D. A., Walter, F., Carilli, C. L., Dickinson, M., Elbaz, D., & Morrison, G. E. 2009, ApJ, 698, L178
- De Breuck et al. (2011) De Breuck, C., Maiolino, R., Caselli, P., Coppin, K., Hailey-Dunsheath, S., & Nagao, T. 2011, A&A, 530, L8
- de Looze et al. (2011) de Looze, I., Baes, M., Bendo, G. J., Cortese, L., & Fritz, J. 2011, MNRAS, 416, 2712
- Fixsen et al. (1999) Fixsen, D. J., Bennett, C. L., & Mather, J. C. 1999, ApJ, 526, 207
- Gunn & Gott (1972) Gunn, J. E. & Gott, III, J. R. 1972, ApJ, 176, 1
- Hu et al. (2002a) Hu, E. M., Cowie, L. L., McMahon, R. G., Capak, P., Iwamuro, F., Kneib, J.-P., Maihara, T., & Motohara, K. 2002a, ApJ, 568, L75
- Hu et al. (2002b) Hu, E. M., Cowie, L. L., McMahon, R. G., Capak, P., Iwamuro, F., Kneib, J.-P., Maihara, T., & Motohara, K. 2002b, ApJ, 576, L99
- Kashikawa et al. (2011) Kashikawa, N., Shimasaku, K., Matsuda, Y., Egami, E., Jiang, L., Nagao, T., Ouchi, M., Malkan, M. A., Hattori, T., Ota, K., Taniguchi, Y., Okamura, S., Ly, C., Iye, M., Furusawa, H., Shioya, Y., Shibuya, T., Ishizaki, Y., & Toshikawa, J. 2011, ApJ, 734, 119
- Kennicutt (1998) Kennicutt, Jr., R. C. 1998, ApJ, 498, 541
- Kneib et al. (1993) Kneib, J. P., Mellier, Y., Fort, B., & Mathez, G. 1993, A&A, 273, 367
- Leitherer et al. (1999) Leitherer, C., Schaerer, D., Goldader, J. D., González Delgado, R. M., Robert, C., Kune, D. F., de Mello, D. F., Devost, D., & Heckman, T. M. 1999, ApJS, 123, 3
- Maiolino et al. (2009) Maiolino, R., Caselli, P., Nagao, T., Walmsley, M., De Breuck, C., & Meneghetti, M. 2009, A&A, 500, L1
- Maiolino et al. (2005) Maiolino, R., Cox, P., Caselli, P., Beelen, A., Bertoldi, F., Carilli, C. L., Kaufman, M. J., Menten, K. M., Nagao, T., Omont, A., Weiß, A., Walmsley, C. M., & Walter, F. 2005, A&A, 440, L51
- Mellier et al. (1988) Mellier, Y., Soucail, G., Fort, B., & Mathez, G. 1988, A&A, 199, 13
- Pierini et al. (2001) Pierini, D., Lequeux, J., Boselli, A., Leech, K. J., & Völk, H. J. 2001, A&A, 373, 827
- Richard et al. (2010) Richard, J., Kneib, J.-P., Limousin, M., Edge, A., & Jullo, E. 2010, MNRAS, 402, L44
- Schaerer & Pelló (2005) Schaerer, D. & Pelló, R. 2005, MNRAS, 362, 1054
- Shim & Chary (2013) Shim, H. & Chary, R.-R. 2013, ApJ, 765, 26
- Shim et al. (2011) Shim, H., Chary, R.-R., Dickinson, M., Lin, L., Spinrad, H., Stern, D., & Yan, C.-H. 2011, ApJ, 738, 69
- Solomon & Barrett (1991) Solomon, P. M. & Barrett, J. W. 1991, in IAU Symposium, Vol. 146, Dynamics of Galaxies and Their Molecular Cloud Distributions, ed. F. Combes & F. Casoli, 235
- Spergel et al. (2007) Spergel, D. N. et al. 2007, ApJS, 170, 377
- Stacey et al. (1991) Stacey, G. J., Geis, N., Genzel, R., Lugten, J. B., Poglitsch, A., Sternberg, A., & Townes, C. H. 1991, ApJ, 373, 423
- Stacey et al. (2010) Stacey, G. J., Hailey-Dunsheath, S., Ferkinhoff, C., Nikola, T., Parshley, S. C., Benford, D. J., Staguhn, J. G., & Fiolet, N. 2010, ApJ, 724, 957
- Taniguchi et al. (2005) Taniguchi, Y. et al. 2005, PASJ, 57, 165
- Wagg et al. (2010) Wagg, J., Carilli, C. L., Wilner, D. J., Cox, P., De Breuck, C., Menten, K., Riechers, D. A., & Walter, F. 2010, A&A, 519, L1
- Wagg & Kanekar (2012) Wagg, J. & Kanekar, N. 2012, ApJ, 751, L24
- Wagg et al. (2009) Wagg, J., Kanekar, N., & Carilli, C. L. 2009, ApJ, 697, L33
- Walter et al. (2012) Walter, F., Decarli, R., Carilli, C., Riechers, D., Bertoldi, F., Weiß, A., Cox, P., Neri, R., Maiolino, R., Ouchi, M., Egami, E., & Nakanishi, K. 2012, ApJ, 752, 93
- Walter et al. (2003) Walter, F. et al. 2003, Nature, 424, 406
- Wang et al. (2010) Wang, R., Carilli, C. L., Neri, R., Riechers, D. A., Wagg, J., Walter, F., Bertoldi, F., Menten, K. M., Omont, A., Cox, P., & Fan, X. 2010, ApJ, 714, 699
- Wang et al. (2011) Wang, R., Wagg, J., Carilli, C. L., Walter, F., Riechers, D. A., Willott, C., Bertoldi, F., Omont, A., Beelen, A., Cox, P., Strauss, M. A., Bergeron, J., Forveille, T., Menten, K. M., & Fan, X. 2011, ApJ, 739, L34
- Wolfire et al. (1995) Wolfire, M. G., Hollenbach, D., McKee, C. F., Tielens, A. G. G. M., & Bakes, E. L. O. 1995, ApJ, 443, 152