Observation of charm mixing at CDF
Abstract:
We report on the observation of – oscillations by measuring the time-dependent ratio of yields for the rare decay to the favored decay at the Collider Detector at Fermilab (CDF). Using 9.6 fb-1 of integrated luminosity of = 1.96 TeV collisions recorded in the full CDF Run II, the signals of and decays are reconstructed in -tagged events, with proper decay times between 0.75 and 10 mean lifetimes. We measure the mixing parameters , , and . Our results are consistent with standard model expectations and similar results from proton-proton collisions and exclude the no-mixing hypothesis with a significance equivalent to 6.1 standard deviations.
1 Introduction
Neutral mesons can oscillate into their antiparticles because they are produced in flavor eigenstates which are different from eigenstates with defined mass and lifetime. This quantum-mechanical oscillation is referred as mixing and can be characterized by the parameters and , where is the mass difference, is the decay width difference, and is the mean decay width of the mass eigenstates. The process is well established for , , and mesons [1] and its study provides important information about electroweak interactions and the Cabibbo-Kobayashi-Maskawa (CKM) matrix, as well as the virtual particles that are exchanged in the mixing process itself. Evidence of – mixing was reported in recent years by the experiments Belle [2], Babar [3, 4] and CDF [5] and it was observed only in 2012 by LHCb [6]. Even if standard model (SM) calculations of the – mixing rate are affected by significant theoretical uncertainties, this process is expected to be much slower (i.e. , ) than the and oscillations. However NP particles could enhance the mixing rate, thus providing indirect evidence for physics beyond the SM [7, 8]. Then, it is of great interest to establish conclusively – mixing in a specific decay channel and improve the precision of the measurement of the mixing parameters.
1.1 Charm mixing in the channel
Charm mixing can be searched by measuring the time dependence of the rate of the rare decay (including its charge-conjugate). This decay can arise from the oscillation of a state to a state, followed by a Cabibbo-favored (CF) decay, or from a doubly-Cabibbo suppressed (DCS) decay. Under the assumption that CP is conserved and the mixing parameters are small (, ), the ratio of to decay rates can be approximated by [1]
| (1) |
where is the proper decay time expressed in units of mean lifetime.
is the DCS decay rate
relative to the CF rate, while the parameters and are linear combinations of and
according to the relations
and
,
where is the strong interaction phase difference between the
DCS and CF amplitudes. In the absence of mixing, and .
The experimental method to identify the flavor of the charmed meson at production
exploits the strong-interaction decays
, .
The relative charges of the soft (low-momentum) tagging pion from decay and
the pion from decay determine whether the
decay chain is right-sign (RS, like charge) or wrong-sign (WS, opposite charge).
RS processes include mainly CF decays, while
DCS and mixing decays contribute to WS processes.
2 Analysis
Our measurement uses the full data set corresponding to an integrated luminosity of fb-1 recorded by the CDF II detector at the Tevatron in collisions at TeV. We reconstruct the WS , and the RS decay chains and measure the time dependence of their rates ratio. The components of the CDF II detector most relevant for this analysis are the multi-wire drift chamber (COT) and the silicon microstrip vertex detector located inside a solenoid, which provides a 1.4 T magnetic field [9].
2.1 Data selection
The events for this analysis are selected online by a trigger system [10] which identifies pairs of oppositely charged particle tracks from a decay vertex detached by at least 200 m from the beamline. In the off-line analysis, the tracks satisfying the trigger requirements are considered with both and interpretations in order to reconstruct candidates. Minimal requirements on the momenta and impact parameters of the tracks and the displacement of the reconstructed decay vertex are imposed. A low-momentum tagging pion track is combined with the candidate to form a candidate. To reduce the contribution of mesons produced from -hadron decays, candidate are required to have an impact parameter m. RS decays incorrectly reconstructed as WS decays, because the kaon and pion assignments are mistakenly interchanged, represent a large background to the WS signal. Two selection cuts have been applied to reduce this background. WS candidates with RS invariant mass reconstructed within 20 MeV/ of the known mass are removed. This cut retains 78% of the WS signal, and rejects 96.5% of the RS decays with incorrect mass assignment. A second cut exploits the K/ separation based on the measurements of the ionization energy loss in the COT [10]. The combination of these two cuts greatly reduces the mis-assigned RS background improving the WS signal over background ratio by a factor .
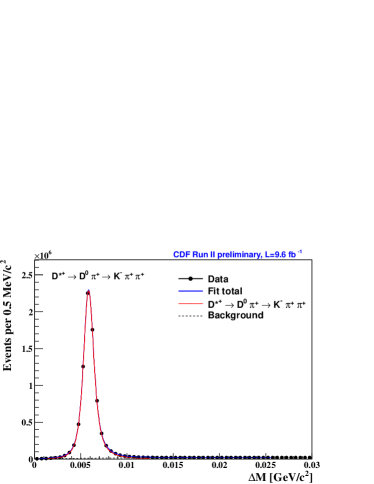
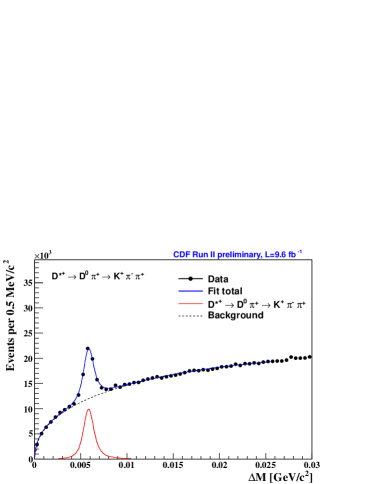
2.2 Signal extraction
The reconstructed RS and WS condidates are classified into 20 intervals of proper decay time which is determined (normalized to the mean lifetime 410.1 fs) as , where GeV/ is the known mass [1], is the transverse decay length, and its transverse momentum. candidates in each time bin are further divided into 60 bins of mass difference , with equal size 0.5 MeV/c2. For each of the resulting 1200 WS and 1200 RS bins, the signal yield is determined by fitting the corresponding binned distribution of the K invariant mass . The signal shape is modeled by the sum of two Gaussian functions with a low-mass tail, and the combinatoric background by an exponential function. A Gaussian term is included in the WS fit to model the residual background from misidentified RS decays, with shape determined from the data. The signal for each time bin is determined from a fit of the signal yield versus . The signal shape is modeled by a double-Gaussian and an asymmetric tail function, the background shape by the product of a power-law and an exponential function. The amplitudes of the signal and background and the background shape parameters are determined independently for all and fits, while the signal shape is fixed to the RS time-integrated shape. The fit procedure for the time-integrated distributions is shown in Fig. 1. The fitted RS and WS signal yields are about and , respectively.
2.3 WS/RS yield ratio
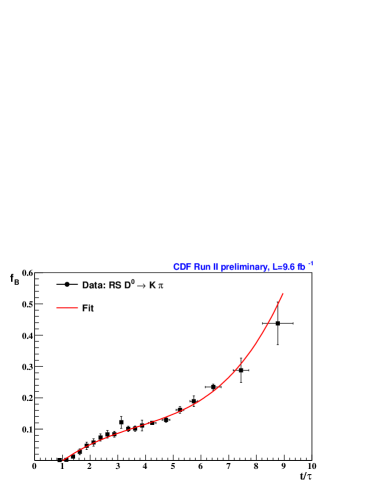
The measured ratio of WS to RS signal yields in the 20 time intervarls is shown in Fig. 2.
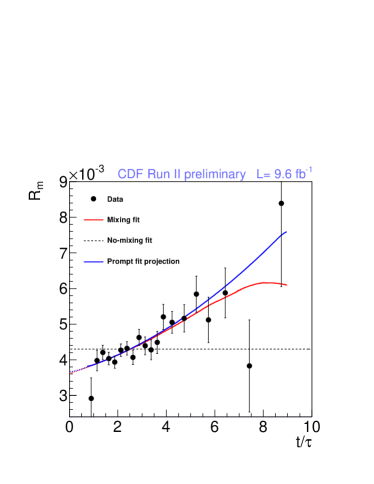
Since the measured yields include the contribution of mesons produced from -hadron decays, the time dependence of is different from that of the WS/RS ratio of prompt decays (Eq. 1). The expected value of in a given time bin can be factorized as the product of by a correction factor due to the non-prompt production
| (2) |
where is the fraction of non-prompt RS decays and
is the WS/RS ratio of non-prompt decays with measured decay time .
For non-prompt decays, the measured decay time is the sum of the decay times of the beauty particle parent and the daughter.
The function is calculated by weighting with the decay-time distributions of non-prompt decays
obtained from a full detector simulation.
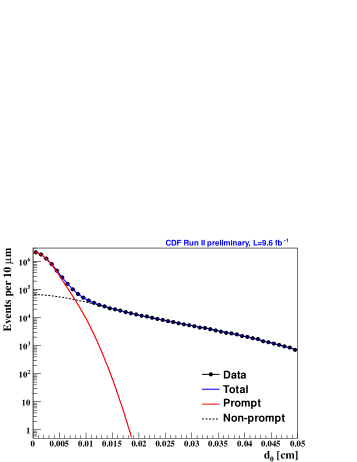
The function is determined from data
by fitting the distributions of RS decays in each time bin.
These are characterized by a peak at small due to the prompt component, and a broad distribution
extending to large due to the non-prompt component, as shown in Fig. 3.
Both the prompt and non-prompt components are modeled with the sum of two Gaussians.
The time dependence of in the region m
is parametrized by a 4-degree polynomial (Fig. 3).
The mixing parameters , , and are found by minimizing the function
| (3) |
where is the uncertainty on
and and are Gaussian constraints to the parameters describing and , respectively.
We investigated extensively
systematic uncertainties due to a
number of possible sources including:
detector charged track asymmetries,
uncertainties in the signal shapes used to fit and distributions
and in the shape of non-prompt component used to fit the distributions,
background due to and partially reconstructed charm decays,
sensitivity of on the simulated decay time distributions of non-prompt .
All these effects were found to be small compared to the mixing parameter errors derived from the fit.
2.4 Result
The fitted values of the mixing parameters are reported in Table 1. The function and the prompt component as determined by the fit are shown in Fig. 2. They differ at large due to the effect of non-prompt production. A fit assuming no-mixing, i.e. , is also shown and is clearly incompatible with the data.
| Fit type | /ndf | Parameter | Fitted values | Correlation coefficient | |||
|---|---|---|---|---|---|---|---|
| Mixing | 16.91/17 | 1 | -0.967 | 0.900 | |||
| 1 | -0.975 | ||||||
| 1 | |||||||
| No-mixing | 58.75/19 |
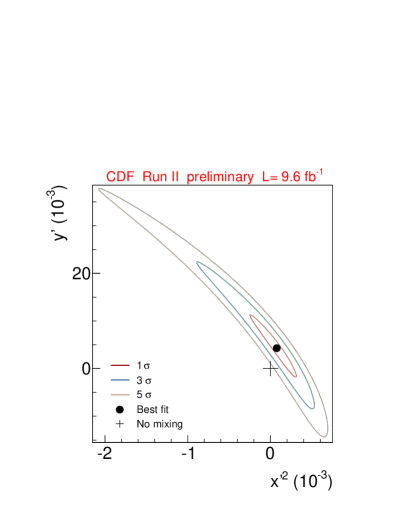
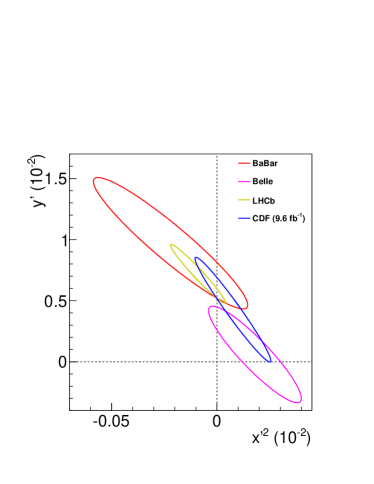
By calculating the Bayesian probability contours in the - parameter space (Fig. 4), we exclude the no-mixing hypothesis at the level of 6.1 Gaussian standard deviations. Our results are consistent with SM calculations [7] and measurements from other experiments, as shown by comparing the 1 - contours in Fig. 4, and have similar precision to the recent LHCb observation [6].
3 Conclusion
We observe – mixing with a significance equivalent to 6.1, by measuring the decay-time-dependence of the ratio of yields for the suppressed to the favored decays using the full CDF data set. We measure the mixing parameters to be , , and . Our results are consistent with SM predictions and similar measurements from other experiments and substantially improve global knowledge of the charm mixing parameters.
References
- [1] J. Beringer et al. (Particle Data Group), Phys. Rev. D 86, 010001 (2012)
- [2] M. Starič et al. (Belle Collaboration), Phys. Rev. Lett. 98, 211803 (2007)
- [3] B. Aubert et al. (B A B AR Collaboration), Phys. Rev. Lett. 98, 211802 (2007)
- [4] J.P. Lees et al. (B A B AR Collaboration), Phys. Rev. D 87, 012004 (2013)
- [5] T. Aaltonen et al. (CDF Collaboration), Phys. Rev. Lett. 100, 121802 (2008)
- [6] LHCb Collaboration, R. Aaij et al. (LHCb Collaboration), Phys. Rev. Lett. 110, 101802 (2013)
- [7] C. A. Chavez, R. F. Cowan, and W. S. Lockman, Int. J. Mod. Phys. A 27, 1230019 (2012)
- [8] E. Golowich, J. Hewett, S. Pakvasa, and A. A. Petrov, Phys. Rev. D 76, 095009 (2007)
- [9] D. Acosta et al. (CDF Collaboration), Phys. Rev. D 71, 032001 (2005)
- [10] A. Abulencia et al. (CDF Collaboration), Phys. Rev. D 74, 031109(R) (2006)