tRNA signatures reveal polyphyletic origins of streamlined SAR11 genomes among the alphaproteobacteria
1. Program in Quantitative and Systems Biology, 5200 North Lake Road, University of California, Merced, Merced, CA 95343
2. Current Address: Department of Biological Sciences, Northern Illinois University, DeKalb, IL 60115
* Corresponding Author: David H. Ardell, (209) 228-2953, dardell@ucmerced.edu.
Abstract
Phylogenomic analyses are subject to bias from convergence in macromolecular compositions and noise from horizontal gene transfer (HGT). Accordingly, compositional convergence leads to contradictory results on the phylogeny of taxa such as the ecologically dominant SAR11 group of Alphaproteobacteria, which have extremely streamlined, A+T-biased genomes. While careful modeling can reduce bias artifacts caused by convergence, the most consistent and robust phylogenetic signal in genomes may lie distributed among encoded functional features that govern macromolecular interactions. Here we develop a novel phyloclassification method based on signatures derived from bioinformatically defined tRNA Class-Informative Features (CIFs). tRNA CIFs are enriched for features that underlie tRNA-protein interactions. Using a simple tRNA-CIF-based phyloclassifier, we obtained results consistent with bias-corrected whole proteome phylogenomic studies, rejecting monophyly of SAR11 and affiliating most strains with Rhizobiales with strong statistical support. Yet, as expected by their elevated genomic A+T contents, SAR11 and Rickettsiales tRNA genes are also similarly and distinctly A+T-rich within Alphaproteobacteria. Using conventional supermatrix methods on total tRNA sequence data, we could recover the artifactual result of a monophyletic SAR11 grouping with Rickettsiales. Thus tRNA CIF-based phyloclassification is more robust to base content convergence than supermatrix phylogenomics with whole tRNA sequences. Also, given the notoriously promiscuous HGT rates of aminoacyl-tRNA synthetase genes, tRNA CIF-based phyloclassification may be at least partly robust to HGT of network components. We describe how unique features of the tRNA-protein interaction network facilitate mining of traits governing macromolecular interactions from genomic data, and discuss why interaction-governing traits may be especially useful to solve difficult problems in microbial classification and phylogeny.
Author Summary
In this study, we describe a new way to classify living things using information from whole genomes. First, for a group of related organisms, we bioinformatically predict features by which specific classes of tRNAs are recognized by certain proteins or complexes. Second, we train an artificial neural network to recognize which code a new, unknown genome belongs to. We apply our method to SAR11, one of the most abundant bacteria in the world’s oceans. We find that different strains of SAR11 are more distantly related, both to each other and to mitochondria, than previously thought. However, with more traditional treatments of whole tRNA sequence data, we obtain different results, best explained as artifacts of base content convergence. Our tRNA features are therefore more robust to genomic base content convergence than the tRNAs in which they are embedded; this is additional evidence of their functional importance. The tRNA features we study form a clade-specific and slowly diverging “feature network” that underlies a universally conserved macromolecular interaction network. We discuss on theoretical grounds why traits governing macromolecular interactions may be especially well-suited to resolve deep relationships in the Tree of Life.
Introduction
What parts of genomes are most robust to compositional convergence? What information is most faithfully inherited vertically? The key assumptions of compositional stationarity and consistency in gene histories underpin most current approaches in phylogenomics and are frequently violated (reviewed in e.g.[1]). HGT is so widespread that the very existence of a “Tree of Life” has been questioned [2, 3]. Better understanding of ancient phylogenetic relationships requires discovery of new universal, slowly-evolving phylogenetic markers that are robust to compositional convergence and HGT.
The controversial phylogeny of Ca.Pelagibacter ubique (SAR11) is a case in point. SAR11 make up between a fifth and a third of the bacterial biomass in marine and freshwater ecosystems [4]. Adaptations to extreme environmental nutrient limitation may explain why SAR11 have very small cell and genome sizes and small fractions of intergenic DNA [5]. While some recent phylogenomic studies define a clade among SAR11, the largely endoparasitic Rickettsiales, and the alphaproteobacterial ancestor of mitochondria [6, 7, 8], others argue that this placement of SAR11 is an artifact of independent convergence towards increased genomic A+T content, and that SAR11 belongs closer to other free-living Alphaproteobacteria such as the Rhizobiales and Rhodobacteraceae [9, 10, 11]. Monophyly of SAR11 was also recently rejected [10].
Nonstationary macromolecular compositions are a known source of bias in phylogenomics [12, 13]. Widespread variation in macromolecular compositions may be associated with loss of DNA repair pathways in reduced genomes [14, 11], unveiling an inherent A+T-bias of mutation in bacteria [15] and elevating genomic A+T content [16, 17]. A process such as this has likely altered protein and RNA compositions genome-wide in SAR11, and if such effects are accounted for, the placement of SAR11 with Rickettsiales drops away as an apparent artifact [10, 11]. Consistent with this interpretation, SAR11 strain HTTC1062 shares a surprising and unique codivergence of tRNAHis and histidyl-tRNA synthetase (HisRS) with a clade of free-living Alphaproteobacteria [18, 19] that likely arose only once in bacteria [20]. This synapomorphy contradicts the placement of SAR11 with Rickettsiales.
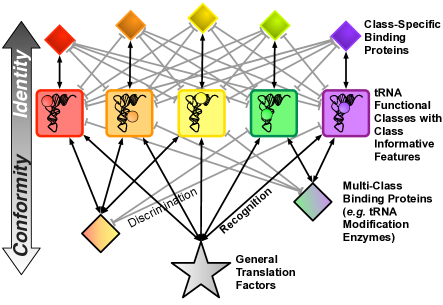
This work was motivated to determine whether the entire system of tRNA-protein interactions could be exploited to address phylogeny of bacteria, particularly SAR11. The highly conserved tRNA-protein interaction network (Fig. 1) has special advantages for comparative systems biological study from genomic data. First, the components and interactions of this network are highly conserved. Second, bioinformatic mining of interaction-determining traits from genomic tRNA data is favorable because tRNA structures are highly conserved not just across extant taxa but also across different functional classes of tRNAs (“conformity” [21]). Yet each functional class of tRNA must maintain a hierarchy of increasingly specific interactions with various proteins and other factors (“identity” [22]). The conflicting requirements of conformity and identity allow structural comparison and contrast to predict class-informative traits of tRNAs from sequence data by relatively simple bioinformatic methods [19]. The features that govern tRNA-protein interactions diverge across the three domains of life (reviewed in [23]) and also within the domain of bacteria [20].
In prior work, we developed “function logos” to predict, at the level of individual nucleotides before post-transcriptional modification, what genetically templated information in tRNA gene sequences is associated to specific functional identity classes [24]. We now call these function-logo-based predictions Class-Informative Features (CIFs). A tRNA CIF answers a question like: “if a tRNA gene from a group of related genomes carries a specific nucleotide at a specific structural position, how much informaiton do we gain about that tRNAs specific function?” Such information estimates are corrected for biased sampling of functional classes and sample size effects [24], and their statistical significance may be calculated [19]. Although an individual bacterial genome does not present enough data to generate a function logo, related genome data may be lumped, weakly assuming homogeneity of tRNA identity rules (although heterogeneity generally reduces signal). Function logos recover known tRNA identity elements (i.e. features that govern the specificity of interactions between tRNAs and proteins) [23], and more generally, predict features governing interactions with class-specific network partners such as amidotransferases [25]. A recent molecular dynamics study on a tRNAGlu-GluRS (Glutaminal tRNA-synthetase) complex identified tRNA functional sites involved in intra- and inter-molecular allosteric signalling within GluRS that couples substrate recognition to reaction catalysis [26]. The predicted sites are correlated with those from proteobacterial function logos [27].
In this work, we show that tRNA CIFs have diverged among Alphaproteobacteria in a phylogenetically informative manner. Second, as phylogenetic markers, tRNA CIFs are more robust to compositional convergence than the tRNA bodies in which they are embedded. Using our tRNA-CIF-based phyloclassification approach, we confirm that SAR11 are polyphyletic with the majority of strains clustering with the free-living Alphaproteobacteria. Our results have implications for how to best mine genomic data for phylogenetic signals.
Results
We reannotated Alphaproteobacterial tDNA data from tRNAdb-CE 2011 [28] and other prepublication genomic data, and split them into two groups according to whether or not their source genome contained the uniquely derived synapomorphic traits previously described [20]: a gene for tRNAHis containing A73 (using “Sprinzl coordinates”, [29]) and lacking templated . We could thereby partition the data into an RRCH clade (Rhodobacteraceae, Rhizobiales, Caulobacterales, Hyphomonadaceae), which present the uniquely derived tRNAHis, and the RSR grade (Rhodospirillales, Sphingomonadales, and Rickettsiales, excluding SAR11), which present “normal” bacterial tRNAHis with C73 and genomically templated . In all, data from 214 Alphaproteobacterial genomes represented 11644 predicted tRNA sequences (8773 sequences unique within genomes and 3064 total unique sequences). Our final dataset contained 147 genomes (8597 tRNAs) for the RRCH clade, 59 genomes (2792 tRNAs) for the RSR grade, and 8 genomes (255 tRNAs) of SAR11 strains.
The unique traits of the RRCH tRNAHis are perfectly associated to substitutions of key residues in the motif IIb tRNA-binding loops of HisRS involved in tRNA recognition [20]. Seven of eight SAR11 strains exhibited the unique tRNAHis/HisRS codivergence traits in common with RRCH genomes. In contrast, strain HIMB59 presented ancestral bacterial characters in both tRNAHis and HisRS (Fig. S1). These results immediately suggest that HIMB59 is not monophyletic with the other SAR11 strains, consistent with [10].
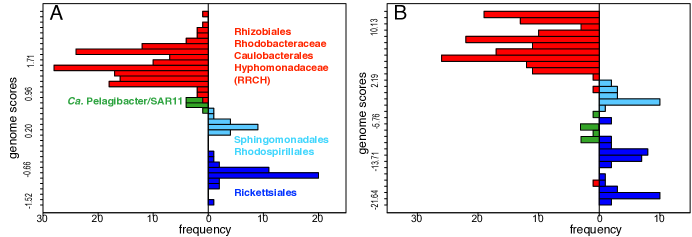
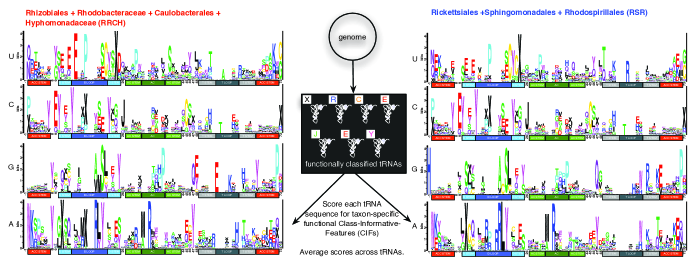
We computed function logos [24] of the RRCH clade and RSR grade to form the basis of a tRNA-CIF-based binary phyloclassifier as shown schematically in Fig. 2. To reduce bias, we used a Leave-One-Out Cross-Validation (LOOCV) approach. For comparison, we also performed LOOCV phyloclassification using sequence profiles of entire tRNAs, with typical results shown in Fig. 3B. Although the tRNA-CIF-based phyloclassifier (Fig. 3A) was biased positively by the much larger RRCH sample size, it achieved better phylogenetic separation of genomes than the total-tRNA-sequence-based phyloclassifier (Fig. 3B). The Sphingomonadales and Rhodospirillales separated in scores from the Rickettsiales in both classifiers. Most importantly, the tRNA-CIF-based phyloclassifier placed all eight SAR11 genomes closer to the RRCH clade and far away from the Rickettsiales with HIMB59 overlapping the Rhodospirillales, while the total-tRNA-sequence-based phyloclassifier placed all eight SAR11 genomes closer to the Rickettsiales. Fig. S2 shows the effects of different treatments of missing data in the total-tRNA-sequence-based classifier. Method “zero,” shown in Fig. 3B, is most analogous to the method used to generate Fig. 3A. Method “skip” (Fig. S2B) shows that SAR11 tRNAs share sequence characters in common with the RSR grade that are not seen in the RRCH clade. Methods “small” and “pseudo” (Figs. S2C and S2D) show that SAR11 have sequence traits not observed in either RSR or RRCH.
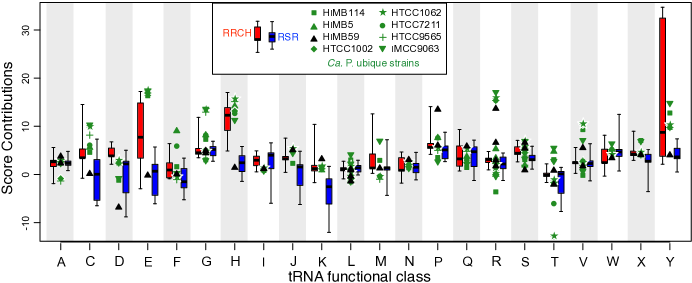
Many other tRNA classes besides tRNAHis contribute to the differentiated classification of RRCH and RSR genomes by the CIF-based binary classifier (Fig. 4). Other tRNA classes are also differentiated between these two groups, including tRNACys, tRNAAsp, tRNAGlu, tRNAIleLAU (symbolized “J”), tRNALys, tRNATyr. These results extend the observations of [18] who discovered unusual base-pair features of tRNAGlu in the RRCH clade. In classes for which the RRCH and RSR groups are well-differentiated, HIMB59 uniquely groups with RSR while other strains group with RRCH, while for other tRNA classes, all putative SAR11 strains lie outside the RRCH and RSR distributions. This implies that more diverse Alphaproteobacterial genomic data are necessary to completely resolve the phylogenetic affiliation of SAR11 strains, but strongly contradict a monophyletic affiliation of SAR11 with Rickettsiales.
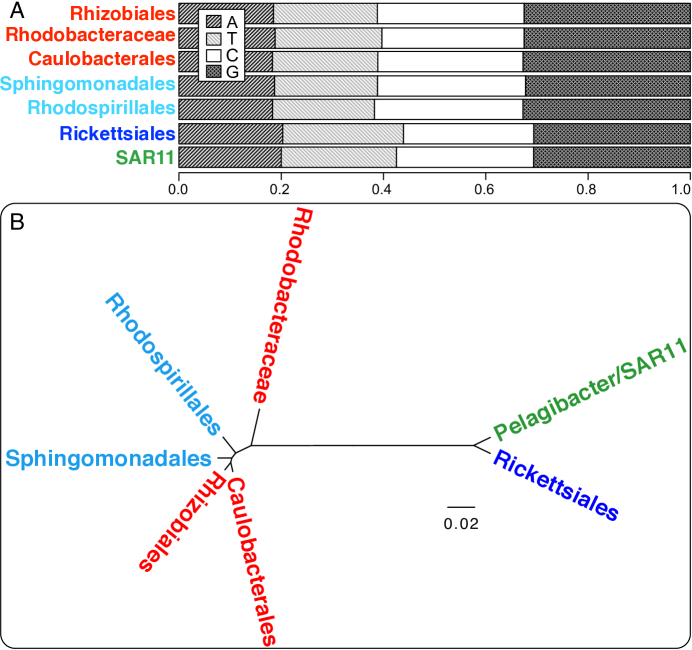
The increases in genomic A+T contents in SAR11 and Rickettsiales have also driven elevated A+T contents of their tRNA genes (Fig. 5A). Rickettsiales and SAR11 tRNA genes are both notably elevated in both A and T, and share an overall similarity in composition distinct from other Alphaproteobacteria. Hierarchical clustering of Alphaproteobacterial taxa based on tRNA gene base contents closely group SAR11 and Rickettsiales together (Fig. 5B).
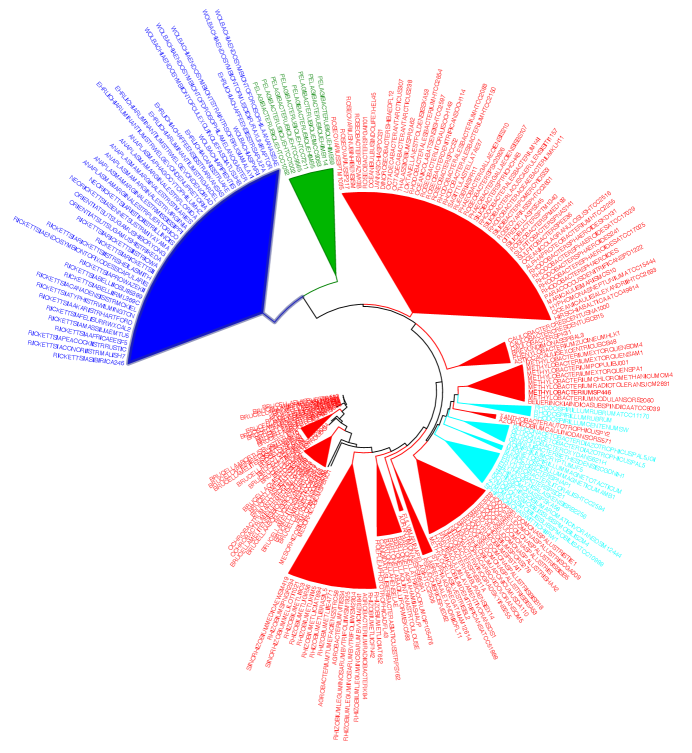
Nonstationary tRNA base content — convergence to greater A+T content — causes all eight SAR11 strains in our dataset to group with Rickettsiales using phylogenomic approaches based on total tRNA sequence evidence. In a “supermatrix” phylogenomic approach, concatenating genes for 28 isoacceptor classes from 169 species (2156 total sites) and using the GTR+Gamma model in RAxML, we estimated a Maximum Likelihood tree in which all eight putative SAR11 strains branch together with Rickettsiales (Fig. S3). For this analysis, in 31% of instances when isoacceptor genes were picked from a genome, we randomly picked one gene from a set of isoacceptor paralogs. However, our results did not depend on which paralog we picked. Using a distance-based approach with FastTree, we computed a consensus cladogram over 100 replicate alignments each representing different randomized picks over paralogs. As the consensus cladogram shows (Fig. S4) each replicate distance tree placed all eight putative SAR11 strains together with Rickettsiales. The recently introduced tRNA-specific FastUniFrac-based method for microbial classification [31] also places all SAR11 strains together with Rickettsiales (Fig. 6).
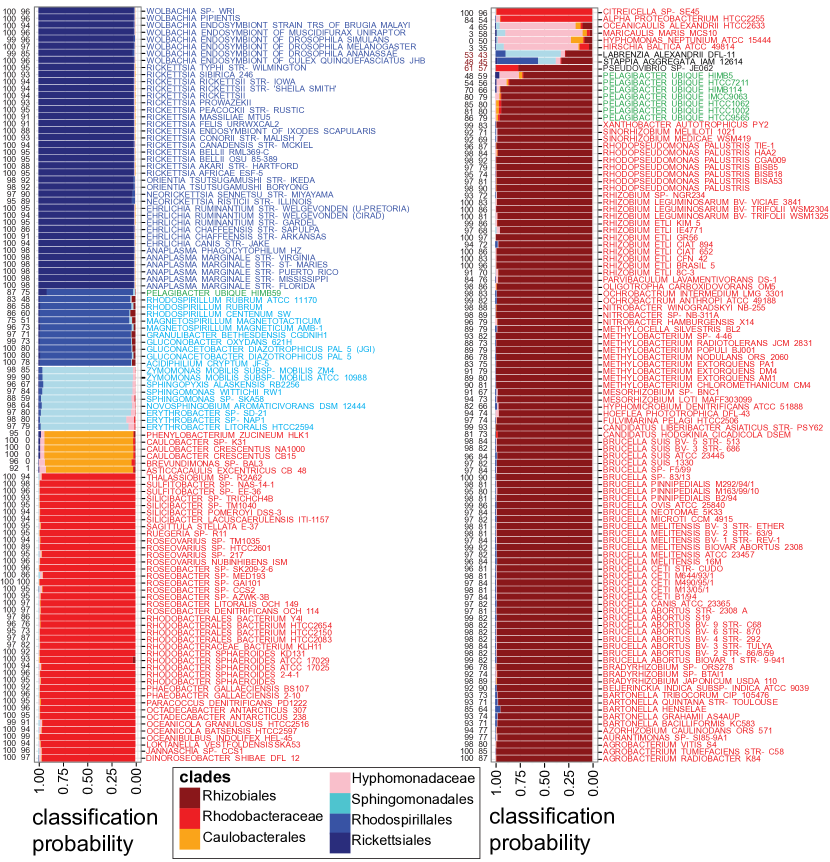
However, as shown in Fig. 7, a multiway classifier based on tRNA CIFs bins all SAR11 strains with the Rhizobiales except for HIMB59, which bins with the Rhodospirillales, consistent with the results of [10]. These results use a multilayer perceptron (MLP) classifier implemented in WEKA [32] and only seven taxon-specific CIF-based summary scores. The MLP is the simplest non-linear classifier able to handle the interdependent signals in the CIF-based scores for tree-like data [33]. In a Leave-One-Out cross-classification, all other genomes scored consistently with NCBI Taxonomy except three placed in Rhodobacteraceae based on 16S ribosomal RNA evidence: Stappia aggregata, Labrenzia alexandrii and the denitrifying Pseudovibrio sp. JE062. None of these genomes scored strongly against Rhodobacteraceae except Pseudovibrio, which scored four times greater against the Rhizobiales.
To assess robustness of our results we performed two controls: we bootstrapped sites of tRNA data in each genome to be classified, and we filtered away small CIFs with Gorodkin heights bits from our models, retrained the classifier and bootstrapped sites again. Generally bootstrap support values correspond to original classification probabilities. All SAR11 strains have support values as Rhizobiales, majority bootstrap values as Rhizobiales (HIMB114 at with Rickettsiales at and HTCC7211 at with Rickettsiales at ), or plurality bootstrap value as Rickettsiales (HIM5 at with Rickettsiales at ) except HIM59 which had a bootstrap support value of to be in the Rhodospirillales. Full bootstrap statistics with these model are provided in Table S1.
Discussion
Our results provide strong, albeit unconventional, evidence that most SAR11 strains are affiliated with Rhizobiales, while strain HIMB59 is affiliated with Rhodospirillales. These results are entirely consistent with comprehensive phylogenomic studies that control for nonstationary macromolecular compositions in Alphaproteobacteria [9, 10, 11] or a site-rate-filtered analysis [34]. Our CIF-based method works even though SAR11 and Rickettsiales tRNAs have converged in base content, so that total tRNA sequence-based phylogenomics gives opposite results. tRNA CIFs must be at least partly robust to compositional convergence of the tRNA bodies in which they are embedded.
It is well known that aminoacyl-tRNA synthetases (aaRS) are highly prone to HGT [35, 36, 37, 38, 39] including in Alphaproteobacteria [20, 40, 41]. We hypothesize that our tRNA-CIF-based phyloclassifiers are also robust to HGT of components of the tRNA-protein interaction network, consistent with [42], who argued that a horizontally transferred aaRS is more likely to functionally ameliorate to a tRNA-protein network into which it has been transferred rather than remodel that network to accomodate itself. HGT of aaRSs may also perturb a network so as to cause a distinct pattern of divergence ([20] and this work). Wang et al. [18] discuss the possibility that RRCH tRNAHis and HisRS were co-transferred into an ancestral SAR11 genome. However, this fails to explain the correlations of many other tRNA traits of SAR11 genomes with the RRCH clade reported here. Further study is needed to address the robustness of our method to component HGT.
A more distant relationship between most SAR11 strains and Rickettsiales actually strengthens the genome streamlining hypothesis [5]. If SAR11 were a true branch within Rickettsiales, it becomes more difficult to claim that genome reduction in SAR11 occurred by a selection-driven evolutionary process distinct from the drift-dominated erosion of genomes in the Rickettsiales [43, 16, 44]. By the same token, polyphyly of nominal SAR11 strains implies that the extensive similarity in genome structure and other traits between HIMB59 and SAR11 reported by [45] may have originated independently. Perhaps convergence in some traits is consistent with streamlining, which could also explain trait-sharing between SAR11 and Prochlorococcus, marine cyanobacteria also argued to have undergone streamlining [46]. Clear signs of data-limitation in our study should be taken to mean that better taxonomic sampling will improve our results and could ultimately resolve more than two origins of SAR11-type genomes among Alphaproteobacteria.
We extracted accurate and robust phylogenetic signals from tRNA gene sequences by first integrating within genomes to identify features likely to govern functional interactions with other macromolecules. Unlike small molecule interactions, macromolecular interactions are mediated by genetically determined structural and dynamic complementarities. These are intrinsically relative; a large neutral network [47] of interaction-determining features should be compatible with the same interaction network. Coevolutionary divergence — turnover—of features that mediate macromolecular interactions, while conserving network architecture, has been described in the transcriptional networks of yeast [48, 49] and worms [50] and in post-translational modifications underlying protein-protein interactions [51]. This work demonstrates that divergence of interaction-governing features is phylogenetically informative.
It remains open how such features diverge, with possibilities including compensatory nearly neutral mutations [52], fluctuating selection [53], adaptive reversals [54], and functionalization of pre-existent variation [55]. Major changes to interaction interfaces may be sufficient to induce genetic isolation between related lineages, as discussed for the 16S rRNA- and 23S rRNA-based standard model of the “Tree of Life,” in which many important and deep branches associate with large, rare macromolecular changes (“signatures”) in ribosome structure and function [56, 57, 58].
Interaction-mediating features of macromolecules may be systems biology’s answer to the phylogeny problem. Perhaps no other traits of genomes are vertically inherited more consistently than those that mediate functional interactions with other macromolecules in the same lineage. In fact, the structural and dynamic basis of interaction among macromolecular components — essential to their collaborative function in a system — may define a lineage better than any of those components can themselves, either alone or in ensemble.
Materials and Methods
Supplementary data packages are provided to reproduce all figures from raw data and enable third-party classification of alphaproteobacterial genomes.
Data
The 2011 release of the tRNAdb-CE database [28] was downloaded on August 24, 2011. From this master database, we selected Alphaproteobacteria data as specified by NCBI Taxonomy data (downloaded September 24, 2010, [59]). Also using NCBI Taxonomy, we further tripartitioned Alphaproteobacterial tRNAdb-CE data into those from the RRCH clade, the RSR grade (excluding SAR11), and three SAR11 genomes, as documented in Supplementary data for figure 2. Five additional SAR11 genomes (for strains HIMB59, HIMB5, HIMB114, IMCC9063 and HTCC9565) were obtained from J. Cameron Thrash courtesy of the lab of S. Giovannoni. We custom annotated tRNA genes in these genomes as the union of predictions from tRNAscan-SE version 1.3.1 (with -B option, [60]) and Aragorn version 1.2.34 [61]. We classified initiator tRNAs and tRNAIleCAU using TFAM version 1.4 [62] using a model previously created to do this based on identifications in [63] provided as supplementary data. We aligned tRNAs with covea version 2.4.4 [64] and the prokaryotic tRNA covariance model [60], removed sites with more than 97% gaps with a bioperl-based utility [65], and edited the alignment manually in Seaview 4.1 [66] to remove CCA tails and remove sequences with unusual secondary structures. We mapped sites to Sprinzl coordinates manually [29] and verified by spot-checks against tRNAdb [67]. We added a gap in the -1 position for all sequences and -1G for tRNAHis in the RSR group [18].
tRNA CIF Estimation and Binary Classifiers
Our tRNA-CIF-based binary phyloclassifier with Leave-One-Out Cross-Validation (LOO CV) is computed directly from function logos, estimated from tDNA alignments as described in [24]. Here, we define a feature as a nucleotide at a position in a structurally aligned tDNA, where and is the set of all Sprinzl coordinates [29]. The set of all possible features is the Cartesian product . A functional class or class of a tDNA is denoted where is the universe of functions we here consider, symbolized by IUPAC one-letter amino acid codes (for aminoacylation classes), for initiator tRNAs, and for tDNAIleLAU. A taxon set of genomes or just taxon set is a set of genomes, where is the set of all genomes, and is the power set of . In this work a genome is represented by the multiset of tDNA sequences it contains, denoted . The functional information of features is computed with a map from the Cartesian product of features, classes and taxon sets to non-negative real numbers. For a feature , class and taxon set , is the fraction of functional information or “Gorodkin height” [68], measured in bits, associated to that feature, class and taxon set. In this work, for a given taxon set , a function logo is the tuple:
| (1) |
Furthermore the set of tRNA Class-Informative Features for taxon set is defined:
| (2) |
Briefly, a tRNA Class-Informative Feature is a tRNA structural feature that is informative about the functional classes it associates with, given the context of tRNA structural features that actually co-occur among a taxon set of related cells, and corrected for biased sampling of classes and finite sampling of sequences [24]. Let denote a set of Alphaproteobacterial genomes partitioned into three disjoint subsets , and with , representing genomes from the RRCH clade, the RSR grade, and the eight nominal Ca. Pelagibacter strains respectively. To execute Leave-One-Out Cross-Validation of a tRNA CIF-based binary phyloclassifier for a genome , we compute a score , averaging contributions from the multiset of tDNAs in scored against two function logos and computed respectively from two disjoint taxon sets and , with . In this study, those sets are and , denoted and respectively. Each tDNA presents a set of features and has a functional class associated to it. The score is then defined:
| (3) |
As controls, we implemented four total-tDNA-sequence based binary phyloclassifiers to score a genome . All are slight variations in which a tRNA of class contributes a score that is a difference in log relative frequencies of the features it shares in class-specific profile models generated from and . The default “zero” scoring scheme method shown in Fig. 3B is defined as:
| (4) |
where
| (5) |
is the observed frequency of feature in tDNAs of class in set , and is the frequency of tDNAs of class in set .
Method “skip” corresponds to scoring scheme defined as:
| (6) |
where
| (7) |
and for as before.
Methods “pseudo” and “small” correspond to scoring schemes :
| (8) |
where
| (9) |
where , , , for method “pseudo,” and, for method “small,” , where .
Analysis of tRNA Base Composition
We computed the base composition of tRNAs aggregated by clades using bioperl-based [65] scripts, and transformed them by the centered log ratio transformation [30] with a custom script provided as supplementary data. We then computed Euclidean distances on the transformed composition data, and then performed hierarchical clustering by UPGMA on those distances as implemented in the program NEIGHBOR from Phylip 3.6b [69] and visualized in FigTree v.1.4.
Supermatrix and FastUniFrac Analysis
For supermatrix approaches, we created concatenated tRNA alignments from 169 Alphaproteobacteria genomes (117 RRCH, 44 RSR, 8 PEL) that all shared the same 28 isoacceptors with 77 sites per gene (2156 total sites). In cases where a species contained more than a single isoacceptor, one was chosen at random. Using a GTR+Gamma model, we ran RAxML by means of The iPlant Collaborative project RAxML server (http://www.iplantcollaborative.org, [70]) on January 23, 2013 with their installment of RAxML version 7.2.8-Alpha (executable raxmlHPC-SSE3, a sequential version of RAxML optimized for parallelization). We tested the robustness of our result to random picking of isoacceptors by creating 100 replicate concatenated alignments and running them through FastTree [71]. For the FastUniFrac analysis we used the FastUniFrac [72] web-server at http://bmf2.colorado.edu/fastunifrac/ to accomodate our large dataset. We removed two genomes from our dataset for containing fewer than 20 tRNAs, and following [31] removed anticodon sites. Following [31] deliberately, we computed an approximate ML tree based on Jukes-Cantor distances using FastTree [71]. We then queried the FastUniFrac webserver with this tree, defining environments as genomes. We then computed a UPGMA tree based on the server’s output FastUniFrac distance matrix in NEIGHBOR from Phylip 3.6b [69].
Multiway Classifier
All tDNA data from the RSR and RRCH clades were partitioned into one of seven monophyletic clades: orders Rickettsiales (N = 40 genomes), Rhodospirillales (N = 10), Sphingomonadales (N = 9), Rhizobiales (N = 91), and Caulobacterales (N = 6), or families Rhodobacteraceae (N = 43) or Hyphomonadaceae (N = 4) as specified by NCBI taxonomy (downloaded September 24, 2010, [59]) and documented in supplementary data for figure 7. We withheld data from the eight nominal SAR11 strains, as well as from three genera Stappia, Pseudovibrio, and Labrenzia, based on preliminary analysis of tDNA and CIF sequence variation. Following a related strategy as with the binary classifier, we computed, for each genome, seven tRNA-CIF-based scores, one for each of the seven Alphaproteobacterial clades as represented by their function logos, using the principle of Leave-One-Out Cross-Validation (LOO CV), that is, excluding data from the genome to be scored. Function logos were computed for each clade as described in [24]. For each taxon set (with genome left out if it occurs), genome obtains a score defined by:
| (10) |
Each genome is then represented by a vector of seven scores, one for each taxon set modeled. These labeled vectors were then used to train a multilayer perceptron classifier in WEKA 3.7.7 (downloaded January 24, 2012, [32]) by their defaults through the command-line interface, which include a ten-fold cross-validation procedure. We bootstrap resampled sites in genomic tRNA alignment data (100 replicates) and also bootstrap resampled a reduced (and retrained) model including only CIFs with a Gorodkin height [24] bits.
Acknowledgments
We thank J. Cameron Thrash and Stephen Giovannoni for sharing data in advance of publication, Harish Bhat, Torgeir Hvidsten, Carolin Frank and Suzanne Sindi for helpful suggestions.
References
- [1] Gribaldo S, Philippe H (2002) Ancient phylogenetic relationships. Theor Popul Biol 61: 391–408.
- [2] Gogarten JP, Doolittle WF, Lawrence JG (2002) Prokaryotic evolution in light of gene transfer. Mol Biol Evol 19: 2226–2238.
- [3] Bapteste E, O’malley MA, Beiko RG, Ereshefsky M, Gogarten JP, et al. (2009) Prokaryotic evolution and the tree of life are two different things. Biol Direct 4: 34.
- [4] Morris RM, Rappé MS, Connon SA, Vergin KL, Siebold WA, et al. (2002) SAR 11 clade dominates ocean surface bacterioplankton communities. Nature 420: 806–810.
- [5] Giovannoni SJ (2005) Genome Streamlining in a Cosmopolitan Oceanic Bacterium. Science 309: 1242–1245.
- [6] Williams K, Sobral B, Dickerman A (2007) A Robust Species Tree for the Alphaproteobacteria . J Bacteriol 189: 4578.
- [7] Georgiades K, Madoui MA, Le P, Robert C, Raoult D (2011) Phylogenomic Analysis of Odyssella thessalonicensis Fortifies the Common Origin of Rickettsiales, Pelagibacter ubique and Reclimonas americana Mitochondrion. PLoS ONE 6: e24857.
- [8] Thrash JC, Boyd A, Huggett MJ, Grote J, Carini P, et al. (2011) Phylogenomic evidence for a common ancestor of mitochondria and the SAR11 clade. Sci Rep 1.
- [9] Brindefalk B, Ettema TJG, Viklund J, Thollesson M, Andersson SGE (2011) A Phylometagenomic Exploration of Oceanic Alphaproteobacteria Reveals Mitochondrial Relatives Unrelated to the SAR11 Clade. PLoS ONE 6: e24457.
- [10] Rodríguez-Ezpeleta N, Embley TM (2012) The SAR11 Group of Alpha-Proteobacteria Is Not Related to the Origin of Mitochondria. PLoS ONE 7: e30520.
- [11] Viklund J, Ettema TJG, Andersson SGE (2012) Independent genome reduction and phylogenetic reclassification of the oceanic SAR11 clade. Mol Biol Evol 29: 599–615.
- [12] Foster PG (2004) Modeling compositional heterogeneity. Systematic Biology 53: 485-495.
- [13] Losos JB, Hillis DM, Greene HW (2012) Who speaks with a forked tongue? Science 338: 1428-1429.
- [14] Dale C, Wang B, Moran N, Ochman H (2003) Loss of DNA recombinational repair enzymes in the initial stages of genome degeneration. Mol Biol Evol 20: 1188–1194.
- [15] Hershberg R, Petrov DA (2010) Evidence that mutation is universally biased towards AT in bacteria. PLoS Genet 6.
- [16] Moran NA (2002) Microbial minimalism: genome reduction in bacterial pathogens. Cell 108: 583–586.
- [17] Lind PA, Andersson DI (2008) Whole-genome mutational biases in bacteria. Proceedings of the National Academy of Sciences 105: 17878–17883.
- [18] Wang C, Sobral BW, Williams KP (2007) Loss of a Universal tRNA Feature. J Bacteriol 189: 1954–1962.
- [19] Ardell DH (2010) Computational analysis of tRNA identity. FEBS Lett 584: 325–333.
- [20] Ardell DH, Andersson SGE (2006) TFAM detects co-evolution of tRNA identity rules with lateral transfer of histidyl-tRNA synthetase. Nucleic Acids Res 34: 893–904.
- [21] Wolfson A, LaRiviere F, Pleiss J, Dale T, Asahara H, et al. (2001) trna conformity. Cold Spring Harbor Symposia on Quantitative Biology 66: 185-194.
- [22] Giege R (2008) Toward a more complete view of tRNA biology. Nat Struct Mol Biol 15: 1007–1014.
- [23] Giegé R, Sissler M, Florentz C (1998) Universal rules and idiosyncratic features in tRNA identity. Nucleic Acids Res 26: 5017.
- [24] Freyhult E, Moulton V, Ardell DH (2006) Visualizing bacterial tRNA identity determinants and antideterminants using function logos and inverse function logos. Nucleic Acids Research 34: 905–916.
- [25] Bailly M, Giannouli S, Blaise M, Stathopoulos C, Kern D, et al. (2006) A single tRNA base pair mediates bacterial tRNA-dependent biosynthesis of asparagine. Nucleic Acids Res 34: 6083–6094.
- [26] Sethi A, Eargle J, Black AA, Luthey-Schulten Z (2009) Dynamical networks in tRNA:protein complexes. Proceedings of the National Academy of Sciences 106: 6620–6625.
- [27] Freyhult E, Cui Y, Nilsson O, Ardell DH (2007) New computational methods reveal tRNA identity element divergence between Proteobacteria and Cyanobacteria. Biochimie 89: 1276–1288.
- [28] Abe T, Ikemura T, Sugahara J, Kanai A, Ohara Y, et al. (2011) tRNADB-CE 2011: tRNA gene database curated manually by experts. Nucleic Acids Research 39: D210–3.
- [29] Sprinzl M, Horn C, Brown M, Ioudovitch A, Steinberg S (1998) Compilation of tRNA sequences and sequences of tRNA genes. Nucleic Acids Research 26: 148–153.
- [30] Aitchison J (1986) The Statistical Analysis of Compositional Data. Monographs on Statistics and Applied Probability. New York: Chapman and Hall.
- [31] Widmann J, Harris JK, Lozupone C, Wolfson A, Knight R (2010) Stable tRNA-based phylogenies using only 76 nucleotides. RNA 16: 1469–1477.
- [32] Hall M, Frank E, Holmes G, Pfahringer B (2009) The WEKA data mining software: an update. ACM SIGKDD .
- [33] Duda R, Hart P, Stork D (2012) Pattern Classification. Wiley, second edition.
- [34] Gupta RS, Mok A (2007) Phylogenomics and signature proteins for the alpha proteobacteria and its main groups. BMC Microbiol 7: 106.
- [35] Doolittle RF, Handy J (1998) Evolutionary anomalies among the aminoacyl-tRNA synthetases. Current opinion in genetics & development 8: 630–636.
- [36] Brown JR, Doolittle WF (1999) Gene descent, duplication, and horizontal transfer in the evolution of glutamyl- and glutaminyl-tRNA synthetases. J Mol Evol 49: 485–495.
- [37] Wolf YI, Aravind L, Grishin NV, Koonin EV (1999) Evolution of aminoacyl-tRNA synthetases–analysis of unique domain architectures and phylogenetic trees reveals a complex history of horizontal gene transfer events. Genome Res 9: 689–710.
- [38] Woese CR, Olsen GJ, Ibba M, Söll D (2000) Aminoacyl-tRNA synthetases, the genetic code, and the evolutionary process. Microbiol Mol Biol Rev 64: 202–236.
- [39] Andam CP, Gogarten JP (2011) Biased gene transfer in microbial evolution. Nat Rev Micro 9: 543–555.
- [40] Dohm J, Vingron M (2006) Horizontal gene transfer in aminoacyl-tRNA synthetases including leucine-specific subtypes. J Mol Evol .
- [41] Brindefalk B, Viklund J, Larsson D, Thollesson M, Andersson SGE (2006) Origin and evolution of the mitochondrial aminoacyl-tRNA synthetases. Mol Biol Evol 24: 743–756.
- [42] Shiba K, Motegi H (1997) Maintaining genetic code through adaptations of tRNA synthetases to taxonomic domains. Trends in biochemical sciences 22: 453–457.
- [43] Andersson SG, Kurland CG (1998) Reductive evolution of resident genomes. Trends in microbiology 6: 263–268.
- [44] Itoh T, Martin W, Nei M (2002) Acceleration of genomic evolution caused by enhanced mutation rate in endocellular symbionts. Proc Natl Acad Sci USA 99: 12944–12948.
- [45] Grote J, Thrash JC, Huggett MJ, Landry ZC, Carini P, et al. (2012) Streamlining and core genome conservation among highly divergent members of the SAR11 clade. MBio 3.
- [46] Dufresne A, Garczarek L, Partensky F (2005) Accelerated evolution associated with genome reduction in a free-living prokaryote. Genome Biol 6: R14–R14.
- [47] Schuster P, Fontana W, Stadler PF, Hofacker IL (1994) From sequences to shapes and back: a case study in RNA secondary structures. Proc Biol Sci 255: 279–284.
- [48] Kuo D, Licon K, Bandyopadhyay S, Chuang R, Luo C, et al. (2010) Coevolution within a transcriptional network by compensatory trans and cis mutations. Genome Res 20: 1672–1678.
- [49] Baker CR, Tuch BB, Johnson AD (2011) Extensive DNA-binding specificity divergence of a conserved transcription regulator. Proceedings of the National Academy of Sciences 108: 7493–7498.
- [50] Barrière A, Gordon KL, Ruvinsky I (2012) Coevolution within and between Regulatory Loci Can Preserve Promoter Function Despite Evolutionary Rate Acceleration. PLoS Genet 8: e1002961.
- [51] Beltrao P, Albanèse V, Kenner LR, Swaney DL, Burlingame A, et al. (2012) Systematic functional prioritization of protein posttranslational modifications. Cell 150: 413–425.
- [52] Hartl DL, Taubes CH (1996) Compensatory nearly neutral mutations: selection without adaptation. Journal of Theoretical Biology 182: 303–309.
- [53] He BZ, Holloway AK, Maerkl SJ, Kreitman M (2011) Does Positive Selection Drive Transcription Factor Binding Site Turnover? A Test with Drosophila Cis-Regulatory Modules. PLoS Genet 7: e1002053.
- [54] Bullaughey K (2012) Multidimensional adaptive evolution of a feed-forward network and the illusion of compensation. Evolution 67: 49–65.
- [55] Haag ES, Molla MN (2005) Compensatory evolution of interacting gene products through multifunctional intermediates. Evolution 59: 1620–1632.
- [56] Winker S, Woese CR (1991) A definition of the domains Archaea, Bacteria and Eucarya in terms of small subunit ribosomal RNA characteristics. Systematic and Applied Microbiology 14: 305–310.
- [57] Roberts E, Sethi A, Montoya J, Woese CR, Luthey-Schulten Z (2008) Molecular signatures of ribosomal evolution. Proceedings of the National Academy of Sciences 105: 13953–13958.
- [58] Chen K, Eargle J, Sarkar K, Gruebele M, Luthey-Schulten Z (2010) Functional role of ribosomal signatures. Biophysj 99: 3930–3940.
- [59] Sayers EW, Barrett T, Benson DA, Bolton E, Bryant SH, et al. (2010) Database resources of the National Center for Biotechnology Information. Nucleic Acids Res 38: D5–16.
- [60] Lowe TM, Eddy SR (1997) tRNAscan-SE: a program for improved detection of transfer RNA genes in genomic sequence. Nucleic Acids Res 25: 955–964.
- [61] Laslett D, Canback B (2004) ARAGORN, a program to detect tRNA genes and tmRNA genes in nucleotide sequences. Nucleic Acids Research 32: 11–16.
- [62] Tåquist H, Cui Y, Ardell DH (2007) TFAM 1.0: an online tRNA function classifier. Nucleic Acids Research 35: W350–3.
- [63] Silva FJ, Belda E, Talens SE (2006) Differential annotation of tRNA genes with anticodon CAT in bacterial genomes. Nucleic Acids Research 34: 6015–6022.
- [64] Eddy SR, Durbin R (1994) RNA sequence analysis using covariance models. Nucleic Acids Research 22: 2079–2088.
- [65] Stajich JE, Block D, Boulez K, Brenner SE, Chervitz SA, et al. (2002) The Bioperl toolkit: Perl modules for the life sciences. Genome Res 12: 1611–1618.
- [66] Gouy M, Guindon S, Gascuel O (2010) Seaview version 4: a multiplatform graphical user interface for sequence alignment and phylogenetic tree building. Molecular Biology and Evolution 27: 221–224.
- [67] Jühling F, Mörl M, Hartmann R, Sprinzl M, Stadler P, et al. (2009) trnadb 2009: compilation of trna sequences and trna genes. Nucleic acids research 37: D159–D162.
- [68] Gorodkin J, Heyer LJ, Brunak S, Stormo GD (1997) Displaying the information contents of structural RNA alignments: the structure logos. Computer Applications In the Biosciences : CABIOS 13: 583–586.
- [69] Felsenstein J (2005) PHYLIP (Phylogeny Inference Package) version 3.6. University of Washington, Seattle: Department of Genome Sciences.
- [70] Stamatakis A, Hoover P, Rougemont J (2008) A rapid bootstrap algorithm for the raxml web servers. Systematic Biology 57: 758-771.
- [71] Price MN, Dehal PS, Arkin AP (2010) FastTree 2–approximately maximum-likelihood trees for large alignments. PloS One .
- [72] Hamady M, Lozupone C, Knight R (2010) Fast UniFrac: facilitating high-throughput phylogenetic analyses of microbial communities including analysis of pyrosequencing and PhyloChip data. the ISME Journal 4: 17–27.
Figure Legends
Figure 1
A universal schema for tRNA-protein interaction networks.
Figure 2
Function logos [24] for two groups of alphaproteobacteria and overview of tRNA-CIF-based binary phyloclassification.
Figure 3
Leave-One-Out Cross-Validation (LOO-CV) scores of alphaproteobacterial genomes under two different binary phyloclassifiers. A. tRNA-CIF-based phyloclassifier B. Total tRNA sequence-based phyloclassifer.
Figure 4
Breakout of class contributions to scores under the tRNA CIF-based binary phyloclassifier.
Figure 5
Base compositions of alphaproteobacterial tRNAs showing convergence between Rickettsiales and SAR11. A. Stacked bar graphs of tRNA base composition by clade. B. UPGMA clustering of clades based on Euclidean distances of tRNA base compositions under the centered log ratio transformation [30].
Figure 6
FastUniFrac-based phylogenetic tree of alphaproteobacteria using tRNA data computed according to the methods of [31].
Figure 7
Seven-way tRNA-CIF-based phyloclassification of alphaproteobacterial genomes by the default multilayer perceptron in WEKA. Bootstrap support values under resampling of tRNA sites against (left) all tRNA CIFs and (right) CIFs with Gorodkin heights bits and model retraining (100 replicates). All support values correspond to most probable clade as shown except for Stapphia and Labrenza for which they correspond to Rhizobiales.