Simulations of supermassive black hole growth in high-redshift disk galaxies
Abstract
Observations suggest that a large fraction of black hole growth occurs in normal star-forming disk galaxies. Here we describe simulations of black hole accretion in isolated disk galaxies with sufficient resolution ( pc) to track the formation of giant molecular clouds that feed the black hole. Black holes in gas-rich disks (%) occasionally undergo Myr episodes of Eddington-limited accretion driven by stochastic collisions with massive, dense clouds. We predict that these gas-rich disks host weak AGNs of the time, and moderate/strong AGNs % of the time. Averaged over 100 Myr timescales and the full distribution of accretion rates, the black holes grow at a few per cent of the Eddington limit – sufficient to match observations and keep the galaxies on the relation. This suggests that dense cloud accretion in isolated disks could dominate cosmic black hole growth. In disks with %, Eddington-limited growth is extremely rare because typical gas clouds are smaller and more susceptible to disruption by AGN feedback. This results in an average black hole growth rate in high- galaxies that is up to times higher than that in low- galaxies. In all our simulations, accretion shows variability by factors of on a variety of time scales, with variability at Myr scales driven by the structure of the interstellar medium.
keywords:
galaxies:evolution – galaxies:formation1 Introduction
Supermassive black holes (BHs) are widely thought to be linked to galaxy evolution. Correlations between black hole mass and galaxy properties suggest the imprint of co-evolution (e.g Richstone et al., 1998; Ferrarese & Merritt, 2000; Gebhardt et al., 2000; Marconi & Hunt, 2003; Häring & Rix, 2004). Active Galactic Nuclei (AGN), the energetic signposts of black hole growth, provide a physical link between black hole growth and the wider galaxy (e.g. Silk & Rees, 1998; Di Matteo et al., 2005). Yet the physical processes of black hole fueling that trigger AGN are not fully understood.
At first glance, moving gas from galactic scales to the BH poses a huge angular momentum problem (cf. Jogee, 2006). One effective way to generate sufficient torques is via major, gas-rich mergers between galaxies. Simulations show that major mergers funnel gas toward the central black holes (Hernquist, 1989; Barnes & Hernquist, 1992; Di Matteo et al., 2005). Owing to the effectiveness of this merger-triggering mechanism, and because the global torques are relatively easy to resolve, a great deal of computational and theoretical work has investigated various aspects of merger-induced BH growth (e.g. Springel et al., 2005; Hopkins et al., 2005a, 2008; Johansson et al., 2009; Debuhr et al., 2010, 2011).
Although mergers probably do enhance BH activity (Ellison et al., 2011), observations have not strongly supported the major merger scenario for most AGNs. AGNs typically live in “normal,” isolated galaxies, with no obvious signs of a major merger (Grogin et al., 2005; Pierce et al., 2007; Gabor et al., 2009; Georgakakis et al., 2009; Cisternas et al., 2011; Kocevski et al., 2012). While some observations indicate that AGN host galaxies tend to be bulge-dominated (e.g. Kauffmann et al., 2003; Grogin et al., 2005), such hosts are in the minority at higher-redshifts and AGN are common in star-forming disks (Gabor et al., 2009; Hwang et al., 2010; Cisternas et al., 2011; Kocevski et al., 2012; Schawinski et al., 2012; Juneau et al., 2013). Black hole growth, like star-formation, mostly seems to occur in the Main Sequence of star-forming disk galaxies (Mullaney et al., 2012; Rosario et al., 2012).
These observations suggest that an important alternative mechanism must drive black hole growth in isolated, gaseous disk galaxies. Hopkins & Hernquist (2006) suggest that interstellar clouds in disk galaxies, owing to velocity perturbations away from a purely Keplerian orbit, will randomly scatter close enough to fuel the central BH. In very gas-rich galaxies such as those observed at high-redshift (e.g. Daddi et al., 2010b; Tacconi et al., 2010), instabilities form clumps and transient features, and interactions among these perturbations cause torques that drive a global inflow (Dekel et al., 2009b; Ceverino et al., 2010; Bournaud et al., 2011). This inflow, which does not rely on the clumps being long-lived, drives central (bulge) star-formation and could feed the black hole. Whether this instability-driven inflow can remove enough angular momentum to reach the central black hole is not clear, but only a small fraction of the global mass inflow needs to reach the black hole to drive substantial growth.
In this work we present high-resolution hydrodynamic simulations of isolated disk galaxies with a model for black hole fueling and feedback. With a spatial resolution of pc, these simulations can resolve the disk scale height and individual clouds in the ISM of the galaxies. This allows us to capture angular momentum exchange among gas clouds that can drive gas toward the galactic center. We focus on two broad regimes of disk galaxies – high-redshift clumpy disks with % gas fractions, and low-redshift disks with 10% gas fractions – and our simulations span a range of stellar masses.
As we show below, massive, dense gas clouds in high-redshift gas-rich galaxies stochastically collide with the black hole and drive persistent episodes of Eddington-limited accretion. The accretion rates are sufficient to explain most of the black hole growth at . This contrasts starkly with BH growth in low-, low-gas-fraction galaxies, which is tiny and never reaches the Eddington limit. A difference in gas fraction of leads to a difference in BH growth of up to .
2 Simulations
We have run a small suite of six fiducial simulations, plus some variations in resolution and physics recipes. Here we describe the hydrodynamics code along with models for cooling, star-formation, and black hole physics. Then we describe the details of the simulation runs, including initial conditions and relaxation.
2.1 Hydrodynamics with Ramses
We use the Adaptive Mesh Refinement (AMR) hydrodynamics code Ramses (Teyssier, 2002), version 3111http://www.itp.uzh.ch/t̃eyssier/Site/RAMSES.html, and we use customized code patches to alter various aspects of the physics. Ramses solves the equations of hydrodynamics and gravitational N-body dynamics on a Cartesian grid whose cells can vary in size. Dark matter and stars are treated as particles and behave as collisionless fluids. The Poisson equation is solved for each cell of the mesh, and the acceleration of each particle is then found by interpolating the potential to the position of the particle within the cell.
A base grid is set up at a given level of refinement with a fixed number of cells per side. For refinement level (which is the coarsest level in our simulations), there are cells per side total cells. Each of these cells may be refined based on some physical criteria. We refine cells when the total mass in a cell exceeds , the number of dark matter particles in a cell exceeds 30, or the local gas Jeans length in a cell is not resolved by at least 4 cell widths (Truelove et al., 1997). When refined, a cell is divided equally into 8 smaller cubic cells, thus giving a higher spatial resolution (by ). These smaller cells may also be refined into smaller and smaller cells, up to some smallest-cell limit determined by the user. We use a maximum level of refinement of , so that in our 50 kpc simulation box the maximum resolution is 50 kpc pc (corresponding to a maximal mass resolution of for typical ISM gas). This adaptive refinement enables high resolution where it is required without wasting resources by applying high resolution where it is not required. Timesteps are adapted to the levels of refinement so that the timestep for cells at refinement level is twice as long as the timestep at level .
Ramses incorporates cooling, star-formation, and supernova feedback. Cooling acts as a sink for the gas thermal energy in each grid cell. In our simulations, we assume all the gas has solar metallicity. We allow cooling down to a floor of 10 K, but we also enforce a density-dependent temperature floor to prevent artificial fragmentation in dense regions. This temperature floor explicitly fulfills the requirement that the local Jeans length is always resolved by at least four grid cells (Truelove et al., 1997).
Star-formation occurs in gas cells of sufficiently high density. We use a density threshold of 100 H atoms cm-3. At each timestep , the star-formation rate (SFR) in a gas cell above the threshold is , where 0.01 is the star-formation efficiency (cf. Zuckerman & Evans, 1974; Krumholz & Tan, 2007), is the cell volume, is the gas density, and is the free-fall time. Then, new star particles of mass are spawned with a probability consistent with the SFR and timestep . Once a particle is spawned, its mass is subtracted from the gas cell. If the desired star particle mass exceeds half the gas mass in the cell, then no star particle is allowed to form. This prevents density discontinuities due to the sudden drop in density. Such star-formation “lost” due to the mass criterion is reported by the code, and is typically a few percent. When a star particle does form, it inherits the position and velocity of its parent cell, but then evolves independently from then on.
Although we have tested various models for stellar feedback, here we use a simple thermal model for supernova. In this model, a star particle dumps thermal energy into its host grid cell’s gas 10 Myrs after it is spawned (its host cell at Myrs may differ from the cell that originally spawned it at ). The star particle represents a star cluster 10% of whose initial mass explodes as supernovae. For each of progenitor mass which explodes as a supernova, ergs of energy is instantaneously added as thermal energy to the nearest gas cell. We delay cooling for this heated cell (cf. Stinson et al., 2006) for 2 Myrs to prevent the injected energy from being rapidly radiated away. This cooling delay tends to suppress the overall SFR of the galaxy (and bring it roughly into agreement with observations) and allows heated gas to gain substantial momentum and generate winds.
2.2 Black hole fueling and feedback model
The publicly available version of Ramses also incorporates a model for the formation, fueling, and feedback of supermassive black holes. Because this model was originally implemented for cosmological simulations, we have made several alterations to make it more appropriate for idealized, high-resolution simulations of individual galaxies. The black hole is represented by a collisionless sink particle, much like the dark matter and star particles, which is added to the initial conditions. Black hole accretion is handled with a Bondi formalism based on Krumholz et al. (2004), and AGN feedback is implemented with a model similar to that described in Teyssier et al. (2011) and Dubois et al. (2012a), which is partly based on the work of Booth & Schaye (2009).
2.2.1 Black hole accretion
The accretion rate on to the black hole is given by a Bondi (Bondi & Hoyle, 1944; Bondi, 1952) formula of the form:
| (1) |
is the BH mass, is the gravitational constant, is the local gas density, is the local gas sound speed, and is the velocity of the gas relative to the BH. Properties of the surrounding gas are measured within an accretion region of radius pc, where is the smallest resolution element of the simulation. The gas properties are computed as weighted averages within the accretion region, with gas elements close to the black hole having larger weights (Krumholz et al., 2004). We have chosen , so there is never a “boost” factor in the accretion rate.
The black hole accretion rate is capped at the Eddington limit given by
| (2) |
where is the proton mass, is the Thomson scattering cross-section, is the speed of light, and is the efficiency with which accreted mass is converted into luminous energy. We use .
At each timestep (of duration ) a gas mass of is removed from the surrounding gas. Gas is removed from cells within using the same weighting scheme as for averaging gas properties. In order to prevent zero or negative gas densities, the fraction of gas removed from a given cell is limited to 50% of its original gas mass. The actual amount of mass accreted is then stored as a variable, since it will be used at coarse timesteps to determine the amount of AGN feedback.
2.2.2 AGN feedback
At each coarse timestep (the timestep corresponding to the coarsest level of refinement), we inject thermal energy into the gas surrounding the black hole. The injected energy is given by
| (3) |
Here is the efficiency with which radiation from accretion couples to matter. We adopt the fiducial value of used by Booth & Schaye (2009) and Teyssier et al. (2011), and as above.
The standard implementation of AGN feedback attempts to inject this energy at uniform pressure throughout the accretion region. If the available thermal energy is insufficient to heat the gas to a weighted average temperature K, then no injection occurs and the accretion energy is stored and added to that in the following timestep. This minimum temperature ensures that once an AGN outburst occurs, its energy will not be radiated away so rapidly as to have no effect on the gas. If the available thermal energy is sufficient to heat the gas above a maximal temperature K, then only enough energy is injected to heat the gas to that average temperature. In this case, the unused energy is again stored for use in the next timestep. This maximum temperature is probably implemented for technical reasons to prevent superheating of the gas, and correspondingly short timesteps which can grind a simulation to a halt (although it fails to prevent this problem, as described in the following paragraph). The maximum temperature is problematic in some cases, however. If the BH is in the midst of a very dense clump of gas, its Bondi rate may exceed the Eddington limit for a very long time. The energetic AGN output is not enough to blow away the dense clump, and the unused reserve of energy builds up to very large values as it is carried over from timestep to timestep.
Due to the clumpy ISM structure in our high-resolution simulations, a uniform-pressure injection sometimes yields unphysically high thermal temperatures ( K) – since pressure , injecting a huge amount of pressure into low density gas gives a large temperature. As a practical matter, such large temperatures lead to very small timesteps (thanks to the Courant condition), which make the simulations very expensive or impossible to run.
We have changed the AGN feedback implementation to circumvent these problems as follows. We inject the AGN outburst only into cold, dense gas instead of injecting a uniform pressure. We use an iterative procedure. First, we do a trial energy injection in the normal way, and check the post-injection temperature of all gas cells. Any cell whose post-injection temperature is above is marked to be excluded from energy injection. If any such cells exist, then we iterate by applying a trial energy injection to all cells except the excluded ones. We continue this process until all cells’ post-injection temperatures are below . This procedure is only rarely necessary. When we do execute it, % of all available cells are excluded, and the typical density of these cells is H cm-3, thus representing a tiny fraction of the mass within the blast region.
In cases where the post-injection temperature would exceed no matter how the outburst energy is distributed, we expand the blast region. We multiply the blast radius by factors of 1.25 (to roughly double the volume) in an iterative procedure. After increasing the blast region, we re-run the injection scheme and check whether all the outburst energy can be used without the temperature exceeding . If not, then we expand the blast radius again, and iterate. In the simulations presented here, this change rarely makes a significant difference because long periods of Eddington-limited accretion are rare.
2.2.3 Black hole’s motion
For the purposes of calculating the motion of the black hole, the mass of the black hole is evenly distributed over a few thousand particles within the accretion region. These particles are re-generated in a uniform spherical cloud at every coarse timestep. Between coarse timesteps (at finer timesteps), the motion of each collisionless “cloud” particle is tracked separately, and the black hole always inherits the velocity of its nearest cloud particle. When black hole accretion occurs, the momentum of accreted material is added to the black hole.
In test simulations at high resolution we found that this default implementation of black hole motion led to large scatter of the BH particle from the center of the galaxy, up to several kpc within the disk. In gas-rich disk simulations the local center-of-mass at the center of a galaxy (usually dominated by bulge stars) does indeed move out of the exact center, but by a few hundred pc, not several kpc. The scattering appears to be driven by interactions with massive, dense, star-forming clouds, but it is not clear whether this large black hole scattering is realistic or if it depends on the details of our implementation. To avoid this difficulty, we implemented an alternate formulation where the black hole tracks the local center of stellar mass. At each timestep we calculate the center of mass of stars within 100 pc of the BH (which in our simulation is well outside the sphere of influence of the BH). Instead of explicitly resetting the position of the BH, which could lead to discontinuous jumps in BH position, we instead set the BH velocity towards that center of mass. The magnitude of the velocity is km s-1 pc, where is the separation between the BH and the center-of-mass, and is the velocity of the center-of-mass. In this formulation the momentum of accreted gas is ignored.
2.2.4 Other black hole models
Although our Bondi accretion plus thermal feedback model is similar to those most commonly used, several alternatives have emerged in recent literature. For accretion, alternative models include those based on viscous disk accretion (Debuhr et al., 2011), drag force generated by stellar feedback (Okamoto et al., 2008), gravitational torques (Hopkins & Quataert, 2011), accretion of low angular momentum gas onto an accretion disk particle (Power et al., 2011), or the free fall time of surrounding gas (Hobbs et al., 2012). Generally, these models better account for the angular momentum of potentially accreting gas than does the Bondi model. For AGN feedback, alternative models include kinetic winds emerging from the smallest scales (Novak et al., 2011; Power et al., 2011), radiation-pressure driven winds (Nayakshin et al., 2009; Nayakshin & Power, 2010; Debuhr et al., 2011), and variations in the details of energy input (temperature, extent, etc.). Although our model is meant to represent thermal heating by AGN radiation, the enforcement of a minimum injection temperature effectively ensures that a wind will develop during periods of rapid accretion.
Given the variety of possible model combinations, a detailed study is beyond the scope of the present paper. Recent comparative studies imply that the particular choice of model (and its parameters) will affect details of BH accretion histories, and can change the long-term dynamics (Newton & Kay, 2013; Wurster & Thacker, 2013b, a). Regardless of accretion model, our simulations robustly predict the close approach of gas within pc of the black hole, which drives our main results. As we will show, periods of high accretion rates correspond closely to the amount of gas within pc of the black hole. What happens when the gas gets within a few tens of pc is model-dependent, though our results should be qualitatively insensitive to the details.
2.3 Simulation Runs
| Simulation | ||||
|---|---|---|---|---|
| M16f50 | 0.60 | |||
| M4f50 | 0.54 | |||
| M1f50 | 0.57 | |||
| M16f10 | 0.10 | |||
| M4f10 | 0.10 | |||
| M1f10 | 0.10 |
In order to bracket the properties of Main Sequence disk galaxies from high to low redshift (Daddi et al., 2007; Noeske et al., 2007; Elbaz et al., 2011), we focus on three regimes in baryonic mass ( and ), and two regimes of gas fraction (% and 10%), for a total of six fiducial simulations (Table LABEL:table.runs). The galaxies with % represent gas-rich disks observed at (e.g. Daddi et al. 2010a; Tacconi et al. 2010, 2013; Magdis et al. 2012, although see Narayanan et al. 2012), while the % galaxies represent disk galaxies at (e.g. Blanton & Moustakas, 2009). We have named the simulations by encoding their baryonic masses and approximate gas fractions: e.g. galaxy M16f50 is the galaxy with a baryonic mass of and gas fraction %. In the future we hope to extend this small suite of simulations to a broader range of properties.
We create initial conditions using particles for stars and dark matter, and density on a grid for the gas disk. The particle phase-space distribution is set up using the code from (Bournaud & Combes, 2002), in which the gas disk density distribution is added analytically. The rotation velocity for gas is computed from the circular velocity of the total gravitational potential, and corrected for the additional pressure term resulting from the density gradient (e.g. equation 13 in Wang et al., 2010), and the equivalent “asymmetric drift” correction is applied for stars. To improve the relaxation of the initial mass distribution, we compute the total gravitational potential once, let the particles evolve in this frozen potential for two disk dynamical times, and repeat this relaxation phase three times in total. The gas density profile is frozen so that the surface density does not vary from the initially chosen value. This ensures that the total mass distribution is close to equilibrium. This technique was chosen to keep the gas surface density as close as possible to its initial value as this is the most relevant parameter quantifying the reservoir available for AGN feeding, even if the dark matter density profile may be somewhat more affected in the initial particle relaxation phase.
Each of our simulations’ initial conditions includes million total collisionless particles, divided roughly equally between dark matter and star particles. Since we are focused on the central parts of the galaxy, we do not model the full dark matter halo outside the disk. The gaseous disks have exponential radial profiles with scale radii kpc (depending on the baryonic mass) and truncation radii about times larger. The gas has an exponential scale height of pc. Both gas and stars are initially rotating with a flat rotation curve. Outside the disk (which represents intergalactic space), the AMR gas cells are initialized with a uniform density times that at the edge of the disk, corresponding to H cm-3. We insert a black hole sink particle in the center of the galaxy with a mass within the scatter allowed by the local relation (e.g Marconi & Hunt, 2003; Bennert et al., 2011a).
From the initial conditions, we run the simulations at low-resolution (typically pc) for a relaxation phase of Myrs. We do this because initial conditions incorporating a disk and spherical halo cannot be fully in equilibrium, and finite resolution and initial AGN feedback may cause additional perturbations. During the first dynamical time, ring-shaped density waves move outward in the disk. These density perturbations generally show no more than a factor of 3 contrast with the smooth density profile, so they do not trigger instabilities or convey substantial gas mass outwards. The perturbations are damped out after the first dynamical time, and we allow structure such as spiral arms to develop before increasing to the full resolution. During this initial low-resolution relaxation phase, we allow star-formation, black hole accretion, and the associated feedback to prevent large gas densities from building up rapidly. We found that star-formation can rapidly deplete gas-rich galaxies of gas during this phase, so we construct the initial conditions with a gas fraction of 63%.
After the initial relaxation phase, we switch the simulation to the full resolution of 6.1 pc, allowing us to resolve dense structures up to several H cm-3. We denote the beginning of the high-resolution phase as time . We run each simulation for 100 Myrs, roughly a galaxy dynamical time, and several local dynamical times in the galactic centers. This time is sufficient to capture the dynamical evolution and its interaction with the black hole, but short enough that our simulations should be insensitive to uncertainties in the lifetimes of massive clumps. Estimates of clump lifetimes in galaxies are yrs, even in the presence of strong stellar feedback (e.g. Genel et al., 2012; Wuyts et al., 2012; Dekel & Krumholz, 2013). Over much longer timescales (several yrs), cosmological inflows and mergers are expected to impact the evolution of the galaxy and its black hole (Dekel et al., 2009a; Davé et al., 2012), so cosmological simulations might be a more appropriate tool (e.g. Kim et al., 2011; Dubois et al., 2012b, DeGraf et al. in preparation).
In addition to the six fiducial runs shown in Table LABEL:table.runs, we have also run several variant simulations. To test resolution effects, we have run several models at a resolution of 12 pc, as well as a brief periods at 3 pc resolution. These resolution tests show only marginal differences that do not impact our results. We also test the impact of AGN feedback by running two simulations – M4f50 and M4f10 – with all the same physics except our AGN feedback model (§3.3).
3 Simulation results
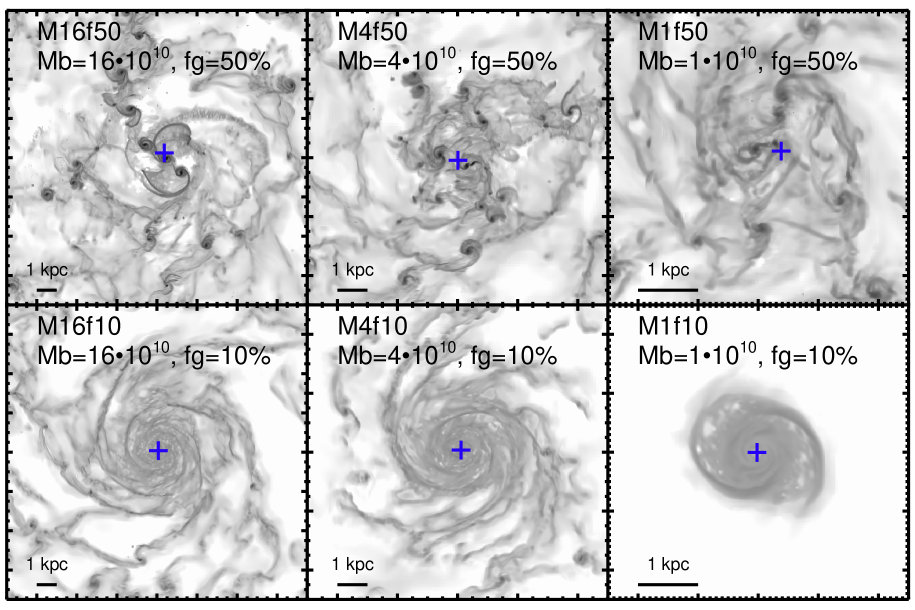
Figure 1 shows face-on images of gas density for each of our six simulations. This figure highlights the qualitative difference between gas-rich galaxies like those found at , and low-gas-fraction disk galaxies found in the local universe: gas rich galaxies preferentially form dense clouds and clumps, while low-gas-fraction galaxies form spiral arms and less-dense clouds. As described in Bournaud et al. (2011), gas density perturbations such as clumps will interact with each other, applying torques that lead to global gas inflow toward the central regions. This results in markedly different black hole fueling patterns that depend on the gas fraction, as we show below.
3.1 Black hole accretion rates: high gas fraction vs. low gas fraction

In this section, we show that black holes in our gas-rich simulations occasionally undergo persistent episodes ( Myr long) of Eddington-limited accretion, and they grow by up to 20% over the 100 Myr simulation interval. Our low-gas-fraction simulations, on the other hand, very rarely reach the Eddington limit, and grow by , or by one part in ten thousand.
Figure 2 illustrates these results. The top row shows our high-gas-fraction galaxies, and the bottom row shows low-gas-fraction galaxies. For each galaxy, we show the Bondi accretion rate (top panel), the per cent black hole mass growth (middle), and the star-formation rate as a function of time (bottom). The Bondi accretion rate is measured directly in the simulations and reported at each coarse timestep, along with the black hole mass and position. We calculate the fractional BH mass growth, , using the reported BH masses and the definition . We calculate the star-formation rate by adding up the masses of star particles born during each time interval in the simulation.
In simulations with high-, the accretion rate typically fluctuates around of the Eddington limit (dotted horizontal lines). Brief fluctuations by factors are relatively common, though they typically last Myr. Occasionally the Bondi rate jumps above the Eddington rate for periods of Myrs (but the actual accretion rate in the simulations is capped at the Eddington rate). As shown by rapid jumps in the fractional black hole mass growth plots, these high-accretion-rate phases are responsible for nearly all the mass growth of the black hole. Throughout the simulations, the SFR evolves slowly, varying by factors of . Trends with baryonic mass are not apparent – galaxy M4f50, the intermediate mass in our suite, shows more high-accretion episodes and thus more BH growth than both other cases. This strongly suggests that episodes of high accretion are stochastic. As we show in §3.2, high-accretion rate episodes occur when the BH collides with dense clouds of gas in the ISM.
In simulations with low-, the accretion rate again hovers around Eddington, yet almost never jumps above the Eddington limit. Black hole growth is tiny and relatively constant, unlike in the gas-rich galaxies where most BH growth occurs in brief episodes. These low- simulations have not developed the stellar bars that are relatively common in galaxies (and rare at higher redshifts Sheth et al., 2008; Kraljic et al., 2012), which some authors argue can drive significant gas inflows (e.g Athanassoula, 1992). Evidence for a link between bars and AGNs is mixed (Shlosman et al., 2000; Knapen et al., 2000; Lee et al., 2012), possibly because orbital resonances block the inflow if a bulge and/or black hole is present (e.g. Combes & Gerin, 1985). We have performed a preliminary test of bar influence by running simulation M4f10 at low resolution until a stellar bar naturally develops (after about 1.5 Gyrs). Once we run at high-resolution with the bar, we find that the average black hole accretion rate is only % higher than in our fiducial run, and therefore black hole growth remains essentially negligible. The presence of a bar does not appear to change our results.
Thus, a dichotomy of BH growth emerges between high- (i.e. high-) and low- (low-) disks. Gas-rich disks occasionally feed rapidly-growing BHs, while BHs in gas-poor disks remain quiescent (Dubois et al., 2012a). We argue below that this dichotomy emerges due to differences in ISM dynamics. Gas-rich galaxies form dense, massive clouds which can feed the black hole, while low- galaxies do not. Quantitatively, a higher gas fraction leads to as much fractional BH growth. All our simulations show significant variability, a subject to which we return in §3.3.
3.2 BH accretion driven by collisions with dense clouds
Bournaud et al. (2011) show that gas-rich disk galaxies undergo inflow that can feed the central black hole, and argue that this inflow occurs in both clumps and smooth flows. In our simulations, periods of high accretion rates are directly tied to dense structures within the galaxy’s ISM (cf. Dubois et al., 2013).
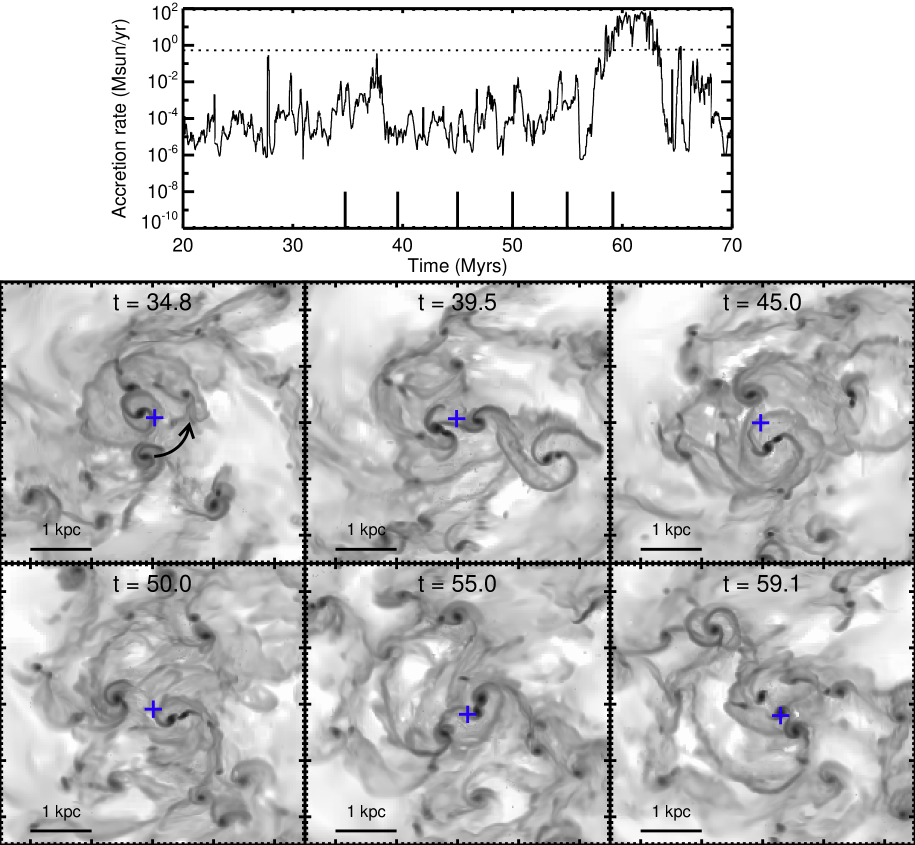
Figure 3 shows the infall of a dense, massive cloud, and its effects on the BH accretion rate, in galaxy M4f50. The top panel shows the (smoothed) BH accretion rate as a function time: this is a sub-interval of the accretion rate in Figure 2. The lower six panels show the turbulent galactic center at six different times (spaced by about 5 Myrs, labelled), with a blue cross for the location of the BH. The times corresponding to the snapshots are marked as vertical lines along the x-axis of the accretion rate panel above.
As multiple star-forming clouds rotate around the galactic center, mutual interactions among the clouds cause them to scatter off one another (the stellar galactic center, in which the BH sits, is also scattered somewhat). Filamentary structures between dense clouds occasionally collide with the black hole, inducing fluctuations in the accretion rate by 4 orders of magnitude, up to % of the Eddington limit. Finally, one of the dense clouds collides with the black hole ( Myrs), triggering a persistent phase of Eddington-limited accretion. Note that this dense cloud is not one of the more massive clumps in the simulation (seen in the outer disk in Figure 1), and it is smaller and less massive than the “giant clumps” identified in high-redshift observations (Elmegreen & Elmegreen, 2005; Elmegreen et al., 2009; Förster Schreiber et al., 2011; Guo et al., 2012).
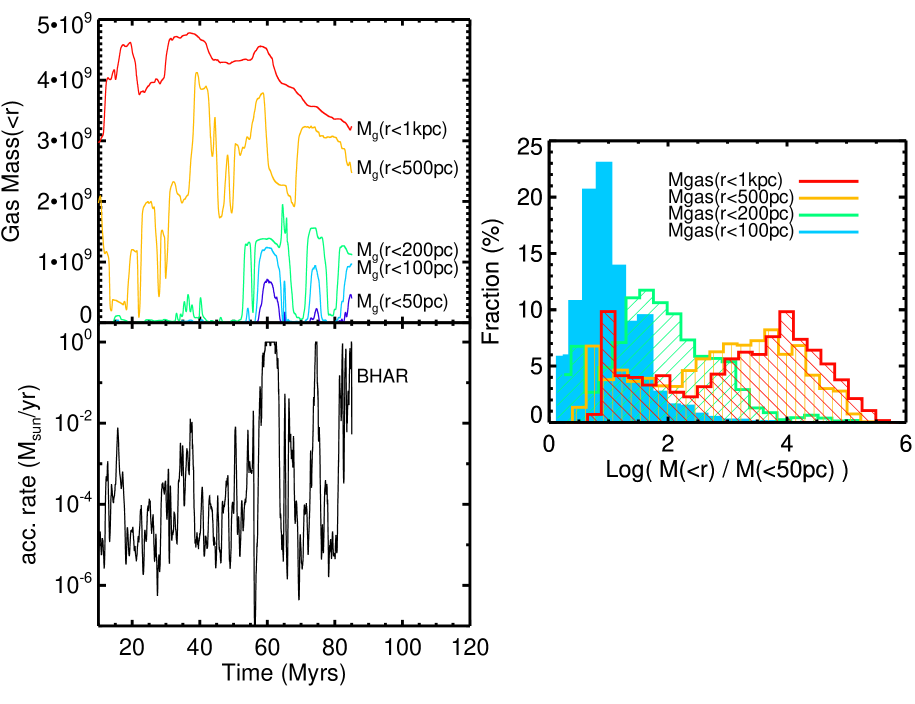
At any given time, multiple dense clouds are within 1 kpc of the BH. Yet Eddington-limited BH growth only occurs when such a cloud directly collides with the BH. This implies that BH accretion is only indirectly linked to gas inflow at 1 kpc, and directly linked only to the gas much closer in (Hopkins & Quataert, 2010; Bournaud et al., 2011). Figure 4 illustrates the relation between gas mass at various scales and the BH accretion rate (BHAR). The upper panel shows the total gas mass within radius of the BH, for radius values and pc, as a function of time. Note the masses (-axis) are shown on a linear scale. In the bottom panel, we show the BH accretion rate on a log scale. Within pc, rapid increases in gas mass – sometimes by factors of – clearly trigger increases in the accretion rate. At larger radii ( or 1000 pc), the total gas mass changes more slowly, and the connection between changes in the gas mass and the accretion rate is weak.
In the right panel of Figure 4, we show the distribution of values of pc for each pc. This illustrates the connection between gas at large scales and gas in the immediate vicinity of the BH. The connection is relatively strong for gas at 100 pc: there is typically as much gas within pc as at pc, with a scatter of a factor of 3. At larger radii the connection is weaker, with the distributions becoming broader. The mass of gas within 1 kpc can be as much as the mass within 50 pc, and the scatter in the distribution is a factor of 20. Therefore, cosmological simulations with a typical resolution of kpc cannot estimate the gas mass close to the BH within a factor of 20. This poses problems for typical implementations of BH fueling in such simulations (as argued by Hopkins & Quataert, 2010).
The critical radius at which the BH accretion rate responds directly to the local gas mass appears to be pc in simulation M4f50. This critical radius is approximately the characteristic size of dense clouds seen in Figure 3. If they are revolving about the galactic center at the galaxy’s rotation velocity, clouds outside this radius still must lose a huge fraction of their angular momentum to feed the black hole. Gas at 500 pc must lose % of its angular momentum to migrate within 100 pc; for gas at 200 pc, this number is %. Dense clouds lose this angular momentum via scattering with other clouds. Due to resolution limits we cannot address angular momentum loss within pc.
During the accretion event at Myrs driven by collision with a dense, massive cloud, the BH gains a total mass of . The gas mass of the dense cloud is , and the mass within pc is about half that. Even when a cloud collision triggers Eddington-limited feedback, the BH only accretes of the cloud mass.
3.2.1 A new mechanism for BH accretion?
BH accretion driven by random collisions with dense clouds is similar to the stochastic accretion described in Hopkins & Hernquist (2006), but some of their assumptions about ISM structure and dynamics do not hold in our simulations. In their analytic model, small interstellar clouds randomly collide with the BH, then AGN feedback immediately enters the “blowout” phase which destroys the cloud. In our (high-) simulations, a high accretion rate persists for several Myrs rather than being immediately shut down by AGN feedback. The simulated clouds colliding with the BH are sufficiently massive and dense to avoid immediate disruption by AGN feedback (see §3.3). This enables the accretion rate to remain near the Eddington limit for an extended period, and raises the time-averaged accretion rate of the BH (as we show in §4).
The prominence of dense clouds in feeding the BH suggests that high accretion rates rely on cloud survival. If strong stellar feedback were to disrupt the dense clouds before colliding with the black hole, it is not clear that the BH would ever reach Eddington-limited accretion rates. We have mitigated this uncertainty by restricting the duration of our simulations to less than the lifetimes of giant clumps (Wuyts et al., 2012; Dekel & Krumholz, 2013). The dense clouds responsible for most BH growth in our simulations, however, are smaller and less massive than the observed “giant” clumps, and lifetimes of these more moderate clouds remain uncertain. In future work we will test the impact of variations in stellar feedback on the black hole accretion rates seen in these simulations.
Based on this dense cloud-driven accretion process, we predict that AGNs are more common in unstable disks (Bournaud et al., 2012). We do not necessarily predict a one-to-one correlation between AGNs and the presence of giant clumps in the outer disk, but rather with more moderate dense clouds near the galactic center. In our simulations, powerful AGN occur only when the BH is embedded within a dense cloud. In the real Universe, such clouds would have substructure that determines whether the AGN is actually triggered, but our simulations suggest that a large reservoir of fuel provided by the dense cloud is required to maintain a powerful AGN. We also expect that the dense clouds driving accretion will partly obscure the AGN while they remain intact. With up to of gas within 200 pc of the BH, we estimate column densities H cm-2, enough to significantly attenuate the emitted X-rays. How this varies with line-of-sight is left to future work.
In summary, massive, dense clouds drive BH growth in gas-rich galaxies. These clouds form as instabilities in gas-rich disks, and through mutual interactions they migrate inwards as part of a global inflow (Bournaud et al., 2011). The dense clouds stochastically collide with the BH, inducing persistent phases of Eddington-limited BH growth.
3.3 Impact of AGN feedback on accretion rates

As in other simulations with AGN (e.g. Di Matteo et al., 2005; Springel, 2005; Degraf et al., 2010; Booth & Schaye, 2009; Debuhr et al., 2010), black hole growth is self-regulated by AGN feedback. In this section we directly illustrate the effects of AGN feedback, and show that it dramatically reduces accretion rates. We also show that AGN feedback imposes very short timescale variability in our simulations, but that variability on Myr scales is driven by structure in the ISM.
Figure 5 compares the BH accretion rates in our fiducial simulations to simulations without AGN feedback. The simulation pairs shown here start from the same point, . During the relaxation phase preceding this time (i.e. ), AGN feedback is switched on in both cases. After , AGN feedback is switched off in the “No AGN feedback” simulation. Both simulations use an Eddington limit on the accretion rates, and both black holes are allowed to grow in mass. The only difference is that in the “No AGN feedback” simulation, we do not inject thermal energy associated with black hole growth.
As shown in Figure 5, the “No AGN feedback” simulations have generally higher Bondi accretion rates, with a larger fraction of the time spent above the Eddington limit. Periods of high accretion in the “No AGN feedback” simulations do not correspond one-to-one to high-accretion periods in the fiducial simulation. There are some periods where the accretion rate with feedback is higher than without feedback (e.g. around Myrs). This is apparently because AGN feedback alters the formation and dynamics of dense gas clouds in the galactic center.
In the “No AGN feedback” simulation of low- galaxy M4f10, accretion rates are again significantly higher and even beyond the Eddington limit. This indicates that AGN feedback prevents Eddington accretion in low- galaxies. We speculate that in low- galaxies, feedback disrupts the (relatively small) clouds that otherwise would rapidly feed the black hole. High- galaxies form more massive, denser clouds that the feedback cannot disrupt, and these ultimately fuel Eddington accretion. We leave the details of cloud disruption by feedback to future work.
In §3.2 we mentioned the high accretion rate variability in our fiducial simulations. Similar variability is seen in other simulations with and without AGN feedback (Levine et al., 2010; Hopkins & Quataert, 2010; Novak et al., 2011). Some of the variability, especially on the shortest timescales, is induced by our AGN feedback model. Figure 5 shows that even without AGN feedback, the BH accretion rate remains highly variable, though on longer timescales than in the fiducial simulations. The accretion rate sometimes changes by orders of magnitude over Myr. This implies that the accretion rate variability (on these timescales) is driven by the clumpy and filamentary structure of the ISM rather than AGN feedback. The characteristic variability timescale is determined by the typical size and velocity of a gas structure. A typical dense cloud of size pc with a velocity of km s-1 (which is typical for central clouds in M4f50) will pass over the black hole in Myrs, which is similar to the variability timescale we see. The “no feedback” M4f10 (low-) simulation shows variability on shorter timescales ( Myr) owing to smaller typical sizes of ISM structures.
AGN feedback introduces an additional high-frequency variability that is a direct consequence of our feedback implementation. The blast region into which the AGN injects its energy is the same as the region over which the accretion rate is measured. Thus, by heating up the gas we directly lower the Bondi rate. The AGN blast is only executed at each coarse timestep, which is the timescale on which our feedback model induces variability in accretion rates (technically, the coarse timestep varies based on conditions in the simulation). This high-frequency variability depends on the details of the feedback implementation, and thus may not be physically accurate.
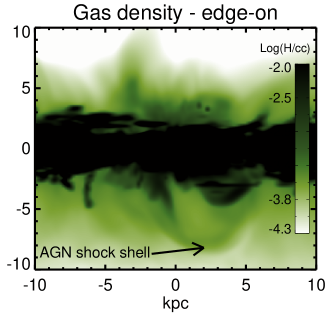
The AGN feedback does not have a major impact on the star-forming gas in the galactic disk (except perhaps in the central regions; cf. Newton & Kay, 2013), but it does drive high-velocity outflows from the galaxy. We show an example outflow in Figure 6. We show an edge-on view of simulation M4f50, with the image stretch adjusted to highlight low-density structures outside the disk. The Eddington-limited accretion event at Myrs has driven an outflow that shocks the gas below the plane of the disk. This AGN-driven shock shell has expanded kpc below the disk in Myrs, implying an average outflow velocity of km s-1 . Above the disk, gas densities are lower (due to earlier feedback events), allowing chimneys of gas to escape. In future work we will study these outflows, and the broader impact of AGN feedback on galaxies, in detail.
In summary, AGN feedback suppresses BH accretion and imposes some variability, but ISM structure drives accretion variability on Myr timescales. The AGN feedback cannot disrupt the dense, massive clouds in gas-rich galaxies, so collisions with these clouds trigger persistent Eddington accretion. AGN feedback can disrupt the smaller gas clouds in low- galaxies, thereby preventing high accretion rates. Although AGN feedback does not have a drastic effect on the star-forming gas in the outer disk, it does drive high-velocity outflows.
4 Implications for BH-galaxy co-evolution
Although our suite of simulations is small, our broad results can be extended to shed light on the nature of black hole fueling in the broad context of galaxy evolution. One crucial result we have already discussed is that black holes grow significantly in isolated, gas-rich disks. In this section, we examine Eddington ratio distributions in our simulations, quantify the implied AGN duty cycle, and study the relationship between SFR and accretion rate.
4.1 Eddington ratio distributions
The Eddington ratio quantifies BH accretion activity independent of BH mass, and its accessibility to observational estimates makes it a useful tool to understand the life cycles of BH accretion. Observers estimate the Eddington ratio using either the full spectral energy distribution (Trump et al., 2011) or a bolometric correction (Heckman et al., 2004; Vasudevan & Fabian, 2007; Kauffmann & Heckman, 2009; Aird et al., 2012) for the AGN luminosity , and a BH mass measurement for the Eddington limit. BH mass estimates typically come from assuming scaling relations between galactic bulges and BH mass, but for quasars better estimates may be available from emission line scaling relations (e.g. Kelly & Bechtold, 2007). In our simulations the Eddington ratio is just the actual accretion rate divided by the Eddington rate: .
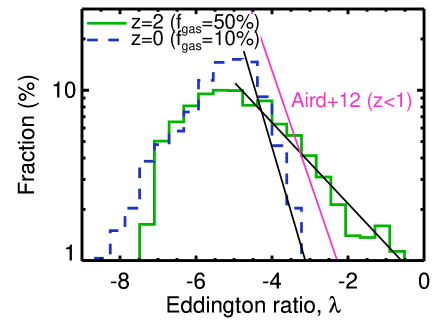
Figure 7 shows Eddington ratio distributions of our simulations. Episodes of high accretion are rare and stochastic, and the Myr duration of each simulation does not adequately sample these events – simulation M16f50 has only one high-accretion episode, whereas M4f50 has several. In order to correct for this stochasticity, we take the combined average Eddington distribution for the high- galaxies, and a separate average for the low- galaxies. This is what we show in Figure 7.
In observations, Eddington ratios are difficult to measure at very low values (), so we follow observers in fitting a power-law to the high- end of each distribution. The power-laws (straight solid lines) provide good fits with a slope of for the % simulations, and a slope of for the % simulations. As expected, the high- galaxies are much more likely to have Eddington ratios than are the low- galaxies.
We compare with the power-law observational Eddington ratio distribution of Aird et al. (2012) for galaxies with . We use their best-fit slope of (which is consistent with that from Kauffmann & Heckman, 2009), and make a rough correction so that the normalization is comparable to our low- distribution. In our low- distribution, 46% of the time is spent at Eddington ratios , while in the observations all AGN are above that level. Thus we multiply the best-fit normalization from Aird et al. (2012) by as a normalization correction. The result is shown as a pink line in Figure 7. The observed slope is quite similar to that of our low- simulations, but the normalization falls between our high- and low- curves.
With redshifts up to , the observed sample probably includes many galaxies with % (as well as mergers) that could explain why the observations show higher accretion rates than our simulations. Aird et al. (2012) do note an increase in the fraction of galaxies with high Eddington ratios at higher redshifts, although they suggest the same power-law slope holds at all observed redshifts. Our simulations predict that, along with the increased fraction of high-accretion events, the slope evolves with gas fraction (i.e. redshift), becoming significantly flatter for galaxies at than for low-redshift galaxies.
4.2 The AGN duty cycle and black hole growth
The AGN duty cycle plays a central role in efforts to understand AGN triggering (and thus black hole fueling). The duty cycle can be loosely thought of as the fraction of galaxies whose AGN is “on” at a given time, or the fraction of time a given galaxy’s AGN is “on.” Observationally, an AGN appears to be “on” only if it is sufficiently bright to be detected in whatever wavelength is being observed (e.g. X-rays). Estimates of the duty cycle vary with selection technique, luminosity/accretion rate thresholds, redshift, and BH mass (cf. Marconi et al., 2004; Shankar et al., 2009).
Simulations (including ours) indicate that AGNs have complex light curves, so the duty cycle is most conveniently defined by quantifying the fraction of time spent above a given luminosity or accretion rate (e.g. Hopkins et al., 2005b). Using the Eddington ratio distributions shown in Figure 7 (plus knowledge of the BH masses from the simulations), we calculate the duty cycle in this way.
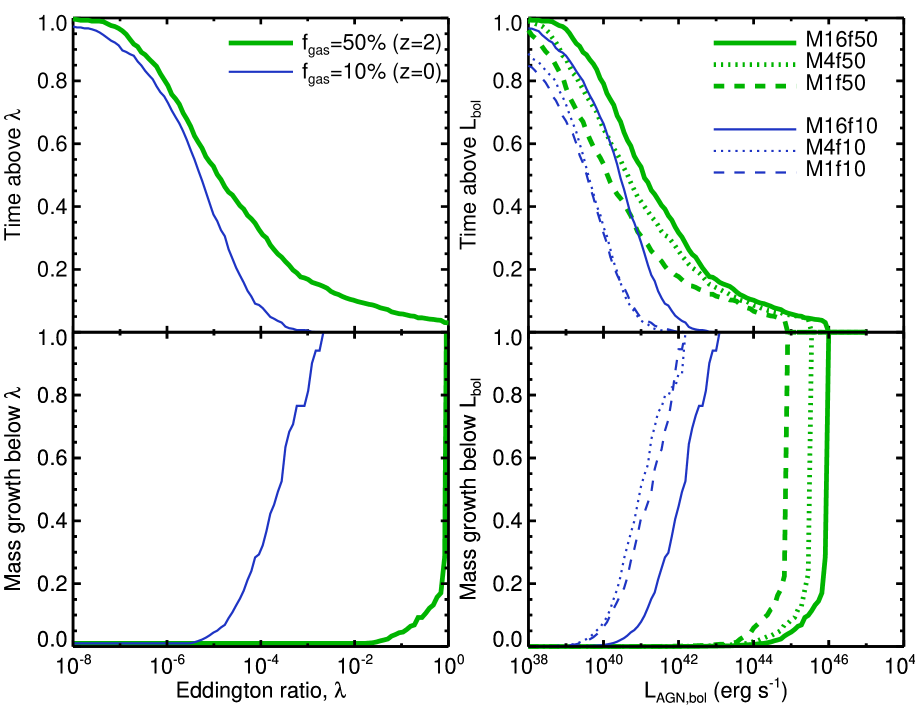
In the top row of Figure 8 we show the fraction of time spent above a given Eddington ratio (left panel) and AGN bolometric luminosity (right panel). The Eddington ratios, averaged over galaxies of a given gas fraction, are taken directly from Figure 7; Figure 8 essentially presents the same data in a cumulative way.
We calculate AGN luminosities as follows. We apply the combined average Eddington ratio distribution for gas-rich galaxies (green curve in Figure 7) to each of the gas-rich galaxies for a hypothetical 100 Myr period. Starting from the original BH masses from Table LABEL:table.runs, we advance through 1000 steps of 0.1 Myrs. At each step we randomly select an Eddington ratio from the average distribution and apply the corresponding accretion to the BH growth. We calculate the AGN luminosity from the accretion rate via , where we use . This method corrects for stochasticity by assuming that each individual galaxy takes on the combined average Eddington ratio distribution of galaxies with similar gas fractions (see also Hickox et al., 2013).
From Figure 8 (as well as Figure 7) we see that black holes in gas-rich galaxies (thick green lines) typically spend more time at higher Eddington ratios than their low- counterparts (thin blue lines). Furthermore, the gas-rich galaxies spend % of the time above erg s-1, and % of the time above . A correction from bolometric luminosity to X-ray luminosity of (cf. Barger et al., 2001; Marconi et al., 2004) implies that our gas rich galaxies should spend % of the time detectable as X-ray AGNs (with erg s-1), and up to 25% of the time as weak (or stronger) AGNs with erg s-1. Our low- galaxies spend less than 1% of the time detectable as X-ray AGNs.
In the bottom row of Figure 8, we show the fraction of the total BH mass growth attributed to accretion below a given value of the Eddington ratio (left) or the AGN luminosity (right).
In gas-rich simulations (thick green lines), nearly all of the BH mass growth occurs at Eddington ratios above , and 80% of the growth occurs at Eddington ratios . In low- simulations, on the other hand, the (meagre) BH growth occurs at Eddington ratios near . The factor of difference in gas fraction leads to a difference in Eddington ratios of up to . This large gap reinforces the dichotomy of BH growth between high- and low- galaxies. BH fueling in gas-rich galaxies is dominated by a few dense clouds that migrate to the center, whereas fueling in gas-poor galaxies is much smoother.
Although we have presented a small number of simulations, these duty cycle data can be incorporated into semi-analytic models of BH-galaxy co-evolution (e.g. Kauffmann & Haehnelt, 2000; Volonteri et al., 2003; Somerville et al., 2008; Hirschmann et al., 2012). The Eddington distributions provide a quantitative estimate of the black hole growth that occurs in isolated disks. We hope to construct larger suites of simulations, encompassing a better sampling of galaxy properties, in the future.
4.3 Coincident AGN and star-formation
Recent observations link AGN to star-formation (e.g. Rosario et al., 2012; Mullaney et al., 2012). The observations suggest a scenario where Main Sequence star-forming galaxies occasionally fuel their black holes without a trigger that substantially alters their star-formation rates. We have already demonstrated that high-redshift star-forming disk galaxies can host AGNs without any external triggers such as mergers. In this section, we connect directly to observable star-formation rates and AGN luminosities.
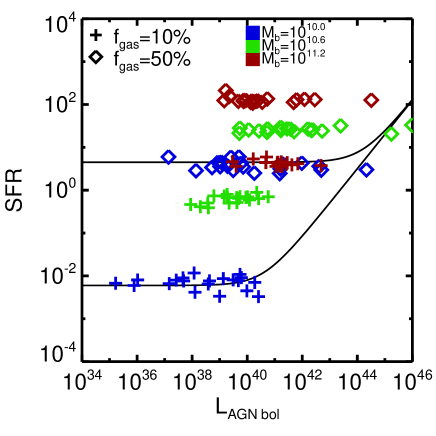
Figure 9 shows the SFR as a function of bolometric AGN luminosity at 20 evenly-spaced times from each of our simulations. In an individual simulated galaxy, the SFR changes only slightly, but the AGN luminosity varies by orders of magnitude within a single dynamical time. As observed for X-ray selected AGN by Rosario et al. (2012), AGN at low luminosities may live in galaxies with a wide spread in SFR. At high AGN luminosities there is an envelope such that high-luminosity AGN live only in galaxies with high-SFR. We illustrate this trend in the figure with solid lines of the form , where and are arbitrary constants chosen to match our low-mass galaxies, and the power law slope of 0.8 is approximately the best-fit value from Rosario et al. (2012).
Two effects combine to form this envelope: a mass effect, and a gas fraction effect. First, galaxies with higher stellar masses host more massive black holes, and these more massive black holes accrete gas at higher absolute rates (for a given Eddington ratio) than lower-mass black holes. This effect may be sensitive to the accretion model – the Bondi formula depends strongly on black hole mass, but not all accretion models do (Hopkins & Quataert, 2010). Second, black holes in high-redshift galaxies with higher gas fractions spend more time at high Eddington ratios. This results from the dichotomy in ISM properties that depends on gas fraction – gas rich galaxies form dense clouds that fuel Eddington-limited accretion.
4.4 Cosmological growth of BHs in disk galaxies
While we have demonstrated that BHs can undergo significant, Eddington-limited growth in isolated gas-rich disk galaxies, in this section we address the role of this mode of BH growth in growing the total mass of BHs in the present Universe. Given the black hole mass from the local relation, what fraction of the BH growth occurred in isolated disk galaxies? A more detailed exploration of the AGN luminosity function and the BH mass function awaits future work with semi-analytic models. Here we follow observers (Heckman et al., 2004; Silverman et al., 2009; Mullaney et al., 2012) in comparing the BH growth rates (, i.e. the accretion rate) to the stellar mass growth rates (, i.e. the SFR).
Galaxies on the star-forming Main Sequence at (like our gas-rich simulations) are likely to end up as red elliptical galaxies at . If they were to remain on the Main Sequence, they would generally grow too much in stellar mass to explain the local galaxy stellar mass function (Peng et al., 2010). Therefore most of their ongoing star-formation at contributes to the “bulge” mass – i.e. the total mass of an elliptical galaxy – at . (For this simple analysis, we ignore any distinction between true bulges and pseudobulges, with which BHs do not correlate; see e.g. Kormendy & Kennicutt 2004; Kormendy et al. 2011). In order to satisfy the relation, the BH must eventually undergo an equivalent amount of growth. During the simulations, the bulge growth (and BH growth) are small, ranging from insignificant to % – too small for a galaxy to move off the relation. Thus, we examine the average growth rates rather than the total growth in BH mass and stellar mass.
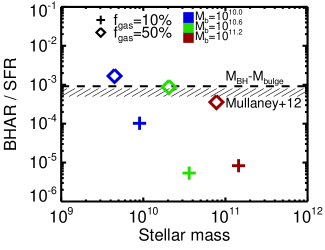
Figure 10 shows as a function of stellar mass for our 6 simulations. The BH accretion rates include a correction for stochasticity by drawing their Eddington ratios from the average Eddington ratio distributions in Figure 7 (see §4.2).
For comparison, we also show the rough band of observed for galaxies (Mullaney et al., 2012). The local relation implies that the bulge is about as massive as the BH it hosts – Bennert et al. (2011a) put this number at about 2200, with a substantial uncertainty (Graham, 2012). Assuming the black hole and stellar mass grow in tandem, and accounting for stellar mass loss via stellar evolution (winds and supernovae), we arrive at a rough expectation that the time-averaged BH accretion rate must be of the SFR. We plot this as a horizontal dashed line in Figure 10. This can be thought of as the black hole growth required to “keep up” with star-formation in order to end up on the relation at . As noted by Mullaney et al. (2012), their observations are close to the required BH growth, implying that most BH mass is built-up in star-forming galaxies.
In Figure 10, our gas-rich galaxies fall within a factor of of both the observed band and the required ratio to keep galaxies on the relation. This result implies that BH growth in isolated Main Sequence galaxies at dominates BH growth at this epoch – no mergers required. Assuming that the Mullaney et al. (2012) observations indeed probe the bulk of BH growth, BH fueling via collisions with dense clouds (as described in §3.2) could dominate the cosmic build-up of BH mass.
The low- galaxies show % of the required BH growth. This is not surprising since they never reach the Eddington-limited accretion that dominates BH growth. This result suggests that BH accretion in isolated, low-redshift disk galaxies is not a major contributor to BH growth, and that processes other than disk instabilities (e.g. mergers; Di Matteo et al., 2005; Springel et al., 2005) must drive the observed BH growth in these galaxies. As noted previously, bar instabilities (which do not occur in our fiducial simulations) could contribute to BH growth in principle, but the evidence and our preliminary tests suggest that bars are not major drivers of AGNs.
We must also note that the relation may vary with redshift. Most observations suggest that, at high-, BHs are too massive to lie on the BH-bulge relations (e.g. Treu et al., 2004, 2007; Peng et al., 2006; Merloni et al., 2010; Bennert et al., 2011b). Ignoring the conflict this creates with our simulation initial conditions, these observations imply that (at least some) black holes should undergo a phase of growth that puts them above the line in Figure 10 at higher redshifts, then below the line at lower redshifts.
In summary, BHs in , % simulations accrete sufficient mass to keep them on the relation and to match observations of . BHs in % galaxies only grow % of the required amount, implying the need for other AGN triggers such as mergers.
5 Summary and Conclusion
We have simulated 6 isolated disk galaxies, with a range of baryonic masses, at 6 pc resolution and a model for black hole accretion and feedback. Our simulations fall into two broad regimes: gas-rich (%) clumpy disks, and relatively gas-poor (%) stable disks.
Gas-rich disks form dense, massive clouds that migrate inward due to mutual angular momentum exchange with other density perturbations (Figure 3). The black hole accretion rate fluctuates stochastically on Myr timescales as clouds and filaments collide with the BH (Figures 2 and 5). Occasionally a massive, dense cloud collides with the BH (Figure 3). AGN feedback is insufficient to disrupt these dense clouds, so the collision drives persistent ( Myr) Eddington-limited accretion (Figure 2). The BH accretion rates correlate with gas mass fluctuations within radii up to pc, roughly the sizes of the clouds (Figure 4). Owing largely to these dense cloud-driven accretion events, BHs in gas-rich galaxies spend % of their time at Eddington ratios above (Figures 8 and 7). On average this growth agrees with observations, and is sufficient for the BH growth to “keep up” with star-formation so that the galaxy ends up on the local relation (Figures 9 and 10). This dense-cloud driven accretion could thus play a crucial role in the cosmic growth of BHs.
Low-, low-redshift disks show markedly different accretion patterns. These galaxies develop spiral arms and small clouds rather than massive clumps (Figure 1). These small density perturbations drive stochasticity in the accretion rate on shorter timescales ( Myrs), and they are more easily disrupted by AGN feedback (Figure 5). The feedback effectively eliminates episodes of Eddington-limited accretion, and these BHs rarely even reach Eddington (Figures 8 and 7). With their growth so suppressed, these BHs cannot “keep up” with their hosts’ SFRs, implying that additional AGN triggers such as mergers are required for low- disks (Figure 10).
Acknowledgements
We thank Romain Teyssier for making RAMSES available, Florent Renaud for help with code, and the anonymous referee for comments on the paper. We acknowledge support from the EC through grants ERC-StG-257720 and the CosmoComp ITN. Simulations were performed at TGCC and as part of a GENCI project (grants 2011-042192 and 2012-042192).
References
- Aird et al. (2012) Aird J. et al., 2012, ApJ, 746, 90
- Athanassoula (1992) Athanassoula E., 1992, MNRAS, 259, 345
- Barger et al. (2001) Barger A. J., Cowie L. L., Bautz M. W., Brandt W. N., Garmire G. P., Hornschemeier A. E., Ivison R. J., Owen F. N., 2001, AJ, 122, 2177
- Barnes & Hernquist (1992) Barnes J. E., Hernquist L., 1992, ARA&A, 30, 705
- Bennert et al. (2011a) Bennert V. N., Auger M. W., Treu T., Woo J.-H., Malkan M. A., 2011a, ApJ, 726, 59
- Bennert et al. (2011b) —, 2011b, ApJ, 742, 107
- Blanton & Moustakas (2009) Blanton M. R., Moustakas J., 2009, ARA&A, 47, 159
- Bondi (1952) Bondi H., 1952, MNRAS, 112, 195
- Bondi & Hoyle (1944) Bondi H., Hoyle F., 1944, MNRAS, 104, 273
- Booth & Schaye (2009) Booth C. M., Schaye J., 2009, MNRAS, 398, 53
- Bournaud & Combes (2002) Bournaud F., Combes F., 2002, A&A, 392, 83
- Bournaud et al. (2011) Bournaud F., Dekel A., Teyssier R., Cacciato M., Daddi E., Juneau S., Shankar F., 2011, ApJ, 741, L33
- Bournaud et al. (2012) Bournaud F. et al., 2012, ApJ, 757, 81
- Ceverino et al. (2010) Ceverino D., Dekel A., Bournaud F., 2010, MNRAS, 404, 2151
- Cisternas et al. (2011) Cisternas M. et al., 2011, ApJ, 726, 57
- Combes & Gerin (1985) Combes F., Gerin M., 1985, A&A, 150, 327
- Daddi et al. (2010a) Daddi E., Bournaud F., Walter F., Dannerbauer H., Carilli C. L., Dickinson M., Elbaz D., Morrison G. E., Riechers D., Onodera M., Salmi F., Krips M., Stern D., 2010a, ApJ, 713, 686
- Daddi et al. (2007) Daddi E. et al., 2007, ApJ, 670, 156
- Daddi et al. (2010b) Daddi E., Elbaz D., Walter F., Bournaud F., Salmi F., Carilli C., Dannerbauer H., Dickinson M., Monaco P., Riechers D., 2010b, ApJ, 714, L118
- Davé et al. (2012) Davé R., Finlator K., Oppenheimer B. D., 2012, MNRAS, 421, 98
- Debuhr et al. (2011) Debuhr J., Quataert E., Ma C.-P., 2011, MNRAS, 412, 1341
- Debuhr et al. (2010) Debuhr J., Quataert E., Ma C.-P., Hopkins P., 2010, MNRAS, 406, L55
- Degraf et al. (2010) Degraf C., Di Matteo T., Springel V., 2010, MNRAS, 402, 1927
- Dekel et al. (2009a) Dekel A., Birnboim Y., Engel G., Freundlich J., Goerdt T., Mumcuoglu M., Neistein E., Pichon C., Teyssier R., Zinger E., 2009a, Nature, 457, 451
- Dekel & Krumholz (2013) Dekel A., Krumholz M. R., 2013, MNRAS, 432, 455
- Dekel et al. (2009b) Dekel A., Sari R., Ceverino D., 2009b, ApJ, 703, 785
- Di Matteo et al. (2005) Di Matteo T., Springel V., Hernquist L., 2005, Nature, 433, 604
- Dubois et al. (2012a) Dubois Y., Devriendt J., Slyz A., Teyssier R., 2012a, MNRAS, 420, 2662
- Dubois et al. (2013) Dubois Y., Pichon C., Devriendt J., Silk J., Haehnelt M., Kimm T., Slyz A., 2013, MNRAS, 428, 2885
- Dubois et al. (2012b) Dubois Y., Pichon C., Haehnelt M., Kimm T., Slyz A., Devriendt J., Pogosyan D., 2012b, MNRAS, 423, 3616
- Elbaz et al. (2011) Elbaz D. et al., 2011, A&A, 533, A119
- Ellison et al. (2011) Ellison S. L., Patton D. R., Mendel J. T., Scudder J. M., 2011, MNRAS, 418, 2043
- Elmegreen & Elmegreen (2005) Elmegreen B. G., Elmegreen D. M., 2005, ApJ, 627, 632
- Elmegreen et al. (2009) Elmegreen D. M., Elmegreen B. G., Marcus M. T., Shahinyan K., Yau A., Petersen M., 2009, ApJ, 701, 306
- Ferrarese & Merritt (2000) Ferrarese L., Merritt D., 2000, ApJ, 539, L9
- Förster Schreiber et al. (2011) Förster Schreiber N. M. et al., 2011, ApJ, 739, 45
- Gabor et al. (2009) Gabor J. M. et al., 2009, ApJ, 691, 705
- Gebhardt et al. (2000) Gebhardt K. et al., 2000, ApJ, 539, L13
- Genel et al. (2012) Genel S. et al., 2012, ApJ, 745, 11
- Georgakakis et al. (2009) Georgakakis A. et al., 2009, MNRAS, 397, 623
- Graham (2012) Graham A. W., 2012, ApJ, 746, 113
- Grogin et al. (2005) Grogin N. A. et al., 2005, ApJ, 627, L97
- Guo et al. (2012) Guo Y., Giavalisco M., Ferguson H. C., Cassata P., Koekemoer A. M., 2012, ApJ, 757, 120
- Häring & Rix (2004) Häring N., Rix H.-W., 2004, ApJ, 604, L89
- Heckman et al. (2004) Heckman T. M., Kauffmann G., Brinchmann J., Charlot S., Tremonti C., White S. D. M., 2004, ApJ, 613, 109
- Hernquist (1989) Hernquist L., 1989, Nature, 340, 687
- Hickox et al. (2013) Hickox R. C., Mullaney J. R., Alexander D. M., Chen C.-T. J., Civano F. M., Goulding A. D., Hainline K. N., 2013, ArXiv e-prints
- Hirschmann et al. (2012) Hirschmann M., Somerville R. S., Naab T., Burkert A., 2012, MNRAS, 426, 237
- Hobbs et al. (2012) Hobbs A., Power C., Nayakshin S., King A. R., 2012, MNRAS, 421, 3443
- Hopkins et al. (2008) Hopkins P. F., Cox T. J., Kereš D., Hernquist L., 2008, ApJS, 175, 390
- Hopkins & Hernquist (2006) Hopkins P. F., Hernquist L., 2006, ApJS, 166, 1
- Hopkins et al. (2005a) Hopkins P. F., Hernquist L., Cox T. J., Di Matteo T., Martini P., Robertson B., Springel V., 2005a, ApJ, 630, 705
- Hopkins et al. (2005b) Hopkins P. F., Hernquist L., Martini P., Cox T. J., Robertson B., Di Matteo T., Springel V., 2005b, ApJ, 625, L71
- Hopkins & Quataert (2010) Hopkins P. F., Quataert E., 2010, MNRAS, 407, 1529
- Hopkins & Quataert (2011) —, 2011, MNRAS, 415, 1027
- Hwang et al. (2010) Hwang H. S., Elbaz D., Lee J. C., Jeong W.-S., Park C., Lee M. G., Lee H. M., 2010, A&A, 522, A33
- Jogee (2006) Jogee S., 2006, in Lecture Notes in Physics, Berlin Springer Verlag, Vol. 693, Physics of Active Galactic Nuclei at all Scales, Alloin D., ed., p. 143
- Johansson et al. (2009) Johansson P. H., Burkert A., Naab T., 2009, ApJ, 707, L184
- Juneau et al. (2013) Juneau S. et al., 2013, ApJ, 764, 176
- Kauffmann & Haehnelt (2000) Kauffmann G., Haehnelt M., 2000, MNRAS, 311, 576
- Kauffmann & Heckman (2009) Kauffmann G., Heckman T. M., 2009, MNRAS, 397, 135
- Kauffmann et al. (2003) Kauffmann G. et al., 2003, MNRAS, 346, 1055
- Kelly & Bechtold (2007) Kelly B. C., Bechtold J., 2007, ApJS, 168, 1
- Kim et al. (2011) Kim J.-h., Wise J. H., Alvarez M. A., Abel T., 2011, ApJ, 738, 54
- Knapen et al. (2000) Knapen J. H., Shlosman I., Peletier R. F., 2000, ApJ, 529, 93
- Kocevski et al. (2012) Kocevski D. D. et al., 2012, ApJ, 744, 148
- Kormendy et al. (2011) Kormendy J., Bender R., Cornell M. E., 2011, Nature, 469, 374
- Kormendy & Kennicutt (2004) Kormendy J., Kennicutt Jr. R. C., 2004, ARA&A, 42, 603
- Kraljic et al. (2012) Kraljic K., Bournaud F., Martig M., 2012, ApJ, 757, 60
- Krumholz et al. (2004) Krumholz M. R., McKee C. F., Klein R. I., 2004, ApJ, 611, 399
- Krumholz & Tan (2007) Krumholz M. R., Tan J. C., 2007, ApJ, 654, 304
- Lee et al. (2012) Lee G.-H., Woo J.-H., Lee M. G., Hwang H. S., Lee J. C., Sohn J., Lee J. H., 2012, ApJ, 750, 141
- Levine et al. (2010) Levine R., Gnedin N. Y., Hamilton A. J. S., 2010, ApJ, 716, 1386
- Magdis et al. (2012) Magdis G. E. et al., 2012, ApJ, 760, 6
- Marconi & Hunt (2003) Marconi A., Hunt L. K., 2003, ApJ, 589, L21
- Marconi et al. (2004) Marconi A., Risaliti G., Gilli R., Hunt L. K., Maiolino R., Salvati M., 2004, MNRAS, 351, 169
- Merloni et al. (2010) Merloni A. et al., 2010, ApJ, 708, 137
- Mullaney et al. (2012) Mullaney J. R. et al., 2012, ApJ, 753, L30
- Narayanan et al. (2012) Narayanan D., Bothwell M., Davé R., 2012, MNRAS, 426, 1178
- Nayakshin et al. (2009) Nayakshin S., Cha S.-H., Hobbs A., 2009, MNRAS, 397, 1314
- Nayakshin & Power (2010) Nayakshin S., Power C., 2010, MNRAS, 402, 789
- Newton & Kay (2013) Newton R. D. A., Kay S. T., 2013, ArXiv e-prints
- Noeske et al. (2007) Noeske K. G. et al., 2007, ApJ, 660, L43
- Novak et al. (2011) Novak G. S., Ostriker J. P., Ciotti L., 2011, ApJ, 737, 26
- Okamoto et al. (2008) Okamoto T., Nemmen R. S., Bower R. G., 2008, MNRAS, 385, 161
- Peng et al. (2006) Peng C. Y., Impey C. D., Rix H.-W., Kochanek C. S., Keeton C. R., Falco E. E., Lehár J., McLeod B. A., 2006, ApJ, 649, 616
- Peng et al. (2010) Peng Y.-j. et al., 2010, ApJ, 721, 193
- Pierce et al. (2007) Pierce C. M. et al., 2007, ApJ, 660, L19
- Power et al. (2011) Power C., Nayakshin S., King A., 2011, MNRAS, 412, 269
- Richstone et al. (1998) Richstone D. et al., 1998, Nature, 395, A14+
- Rosario et al. (2012) Rosario D. J. et al., 2012, A&A, 545, A45
- Schawinski et al. (2012) Schawinski K., Simmons B. D., Urry C. M., Treister E., Glikman E., 2012, MNRAS, 425, L61
- Shankar et al. (2009) Shankar F., Weinberg D. H., Miralda-Escudé J., 2009, ApJ, 690, 20
- Sheth et al. (2008) Sheth K. et al., 2008, ApJ, 675, 1141
- Shlosman et al. (2000) Shlosman I., Peletier R. F., Knapen J. H., 2000, ApJ, 535, L83
- Silk & Rees (1998) Silk J., Rees M. J., 1998, A&A, 331, L1
- Silverman et al. (2009) Silverman J. D. et al., 2009, ApJ, 696, 396
- Somerville et al. (2008) Somerville R. S., Hopkins P. F., Cox T. J., Robertson B. E., Hernquist L., 2008, MNRAS, 391, 481
- Springel (2005) Springel V., 2005, MNRAS, 364, 1105
- Springel et al. (2005) Springel V., Di Matteo T., Hernquist L., 2005, ApJ, 620, L79
- Stinson et al. (2006) Stinson G., Seth A., Katz N., Wadsley J., Governato F., Quinn T., 2006, MNRAS, 373, 1074
- Tacconi et al. (2010) Tacconi L. J. et al., 2010, Nature, 463, 781
- Tacconi et al. (2013) Tacconi L. J. et al., 2013, ApJ, 768, 74
- Teyssier (2002) Teyssier R., 2002, A&A, 385, 337
- Teyssier et al. (2011) Teyssier R., Moore B., Martizzi D., Dubois Y., Mayer L., 2011, MNRAS, 414, 195
- Treu et al. (2004) Treu T., Malkan M. A., Blandford R. D., 2004, ApJ, 615, L97
- Treu et al. (2007) Treu T., Woo J.-H., Malkan M. A., Blandford R. D., 2007, ApJ, 667, 117
- Truelove et al. (1997) Truelove J. K., Klein R. I., McKee C. F., Holliman II J. H., Howell L. H., Greenough J. A., 1997, ApJ, 489, L179
- Trump et al. (2011) Trump J. R. et al., 2011, ApJ, 733, 60
- Vasudevan & Fabian (2007) Vasudevan R. V., Fabian A. C., 2007, MNRAS, 381, 1235
- Volonteri et al. (2003) Volonteri M., Haardt F., Madau P., 2003, ApJ, 582, 559
- Wang et al. (2010) Wang H.-H., Klessen R. S., Dullemond C. P., van den Bosch F. C., Fuchs B., 2010, MNRAS, 407, 705
- Wurster & Thacker (2013a) Wurster J., Thacker R. J., 2013a, MNRAS, 431, 2513
- Wurster & Thacker (2013b) —, 2013b, MNRAS, 431, 539
- Wuyts et al. (2012) Wuyts S. et al., 2012, ApJ, 753, 114
- Zuckerman & Evans (1974) Zuckerman B., Evans II N. J., 1974, ApJ, 192, L149