THE CONCEPTUAL DESIGN OF THE MAGDALENA RIDGE OBSERVATORY INTERFEROMETER
Abstract
We describe the scientific motivation for and conceptual design of the Magdalena Ridge Observatory Interferometer, an imaging interferometer designed to operate at visible and near-infrared wavelengths. The rationale for the major technical decisions in the interferometer design is discussed, the success of the concept is appraised, and the implications of this analysis for the design of future arrays are drawn out.
keywords:
instrumentation: interferometers; ; ;
1 Introduction
The last 50 years have seen a drive to enhance the angular resolution delivered by ground-based telescopes in the presence of atmospheric turbulence. Most of this effort has focused on the use of adaptive optics (AO): modern implementations can routinely deliver 100 milliarcsecond diameter point spread functions. Nevertheless, the desire for angular resolutions better than this remains a powerful driving force in astrophysics. For example, over half of the key science cases comprising the E-ELT design reference mission Liske et al. [2011] require the diffraction-limited performance at the 10 mas level to be delivered.
Ground-based interferometric arrays have contributed to studies on much smaller angular scales. Typical recent studies have focused on Cepheid multiplicity [Gallenne et al., 2013; Li Causi et al., 2013], circumstellar disk physics [Kreplin et al., 2013], the orbital dynamics of close binaries [Hummel et al., 2013; Sana et al., 2013] and the fundamental parameters of single stars [Klotz et al., 2013; Arroyo-Torres et al., 2013]. Interferometric arrays currently offer the only direct means to study astrophysical phenomena on such small angular scales. However, the scientific output of the current generation of ground-based arrays appears to have converged to about 50 peer reviewed papers per year, focused almost exclusively on galactic astrophysics. This level and focus of activity has been maintained for at least five years now, and this might suggest that these major facility arrays are being constrained by the capabilities of their initial suite of instruments.
The principal shortcomings of current interferometers are easily identifiable and are broadly speaking poor sensitivity and the inability, in most implementations, to routinely image targets with high fidelity. These issues formed the basis of the initial planning of the technical architecture of the Magdalena Ridge Observatory Interferometer (MROI). The MROI was conceived as part of an ambitious plan at the New Mexico Institute of Mining and Technology (NMT) to develop a new astronomical observatory at a high altitude site in central New Mexico to support a broad portfolio of programmes in research, education, and the commercial and defence arenas.
In this paper we review the conceptual design of the MROI, currently under construction on the Magdalena Ridge at an elevation of 10,500 ft. From conception, the MROI was targeted towards expanding the capabilities of ground-based optical/near-infrared interferometry in three main directions: sensitivity, imaging capability, and speed of operation. However, it aimed to do this not by solving a set of extreme technical challenges, but rather by leveraging the many technical lessons that had been learnt developing the first generation of prototype interferometers and by capitalising on advances in technology that had taken place since those first arrays had been commissioned. In this sense it has always been a low-risk endeavour. More importantly, though, its architecture was guided through an iterative process whereby the scientific ambitions of its proposed user community were moderated by transparent presentations of the technical constraints implicit in interferometric imaging and the current state-of-the-art in the management of the turbulent atmosphere.
The layout of our manuscript is as follows. We begin with a review of the limitations of existing arrays in section 2 and follow this with a brief resumé of the broad areas of science the MROI has been designed to tackle in section 3. We then walk through the major technical requirements in section 4 and the key design choices and trades that were made as the overall architecture of the MROI was frozen (section 5). We present the high-level error budget for the array in section 6 and evidence that we can meet the key sensitivity requirement in section 7. The main technical lessons learned during the design, prototyping and on-going deployment of the MROI are summarised in section 8 and our conclusions appear in section 9.
2 Limitations of existing interferometers
The scientific capabilities of conventional optical/IR telescopes are frequently characterised by their “performance” measured against half a dozen or so key metrics. These usually include such items as spatial resolution, spectral resolving power, wavelength range, sensitivity, field-of-view and so on. Almost all of these are appropriate figures of merit for interferometric arrays, but as written they “hide” perhaps the most important shortcoming of contemporary optical/IR arrays, that is, the fact that few are able to provide images of the targets under study. In the following sub-sections we discuss the background to this problem as well as the capabilities of existing interferometric arrays with reference to two of the more conventional performance metrics listed above: sensitivity and spatial resolution.
2.1 Imaging capability
The ability of an interferometric array to recover an image is limited fundamentally by how many independent measurements of the visibility function of the source, i.e. the Fourier transform of the sky brightness distribution, can be secured. If a total of independent visibility data are collected, this implies that an image with of order degrees-of-freedom can be reconstructed. Thus, for example, if a pixel image of an extended source is required, of order 25 independent visibility data need to be collected. In addition, the projected baselines used to secure these data should range in length by a factor of roughly 5:1.
Meeting these requirements is a significant challenge for all existing optical/IR arrays. For example, at the CHARA array on Mt Wilson, the typical range in baseline lengths realised in imaging observations to date has been between 3 and 4:1 [see e.g. Baron et al., 2012] At the VLTI, baseline length ratios of up to 6:1 have been achieved but only by combining measurements made over several nights Millour et al. [2011] during which time some of the interferometer elements have been relocated. An additional issue is the long time needed to secure individual visibility “snapshots”. At the VLTI, the allocations of time recommended for securing calibrated snapshot visibility data with the AMBER (3 visibilities) and MIDI (2 visibilities) instruments are between 50 and 90 minutes.
As a result of these issues, in excess of 90% of the published scientific results from optical/IR interferometers rely upon fitting either geometric or physical models to the measured visibility data. In cases where the systems under study are well known, in the sense that they can be reliably characterised by a model with a small number of degrees-of-freedom, interferometric data can provide very powerful diagnostics for the precise values of the model parameters. However, there are many cases where the models themselves are in question, e.g. “Is the dust distributed in a continuous disk or might an Archimedean spiral be preferred?”, or where the physical model used contains many parameters whose interaction is complex — an example of such a physical model might be that of a dusty disk with an inner and outer radius, an inclination, parameters describing the radial and vertical scale-lengths, a dust mass, a dust composition, a grain size distribution and a stellar temperature and luminosity. In these cases the inability to recover an image assuming no preferred structure (i. e. “model-independent imaging”) is a major shortcoming of contemporary interferometers.
2.2 Limiting sensitivity
An almost equally pressing issue for the current generation of optical/IR interferometric arrays is their relatively poor sensitivity. Because ground-based arrays are constrained to operate in the presence of atmospheric fluctuations, they are fundamentally limited by the small values of Fried’s parameter, , and the atmospheric coherence time. . In view of this, one might expect the limiting sensitivity of an optical/IR array to be similar to that of a natural guide star (NGS) AO system, i.e. to be based on the brightness of the star being used to sense the atmospheric wavefront perturbations. At typical NGS AO systems reference stars as faint as can used very effectively, and partial AO correction can still be realised with guide stars as faint as .
In practice, all existing optical/IR arrays struggle to come even close to these sensitivity limits. The faintest optical measurements secured at the NPOI, SUSI and CHARA arrays have been from targets with visual magnitudes in the range 5–7, while in the near-infrared band typical limiting magnitudes have been in the range 6–8. In a few cases fringe data have been secured on targets as faint as but these studies have relied upon arrays that have exploited AO-corrected 8 m-class telescopes as the basis array elements.
It is this relatively poor sensitivity that means that contemporary optical/IR interferometry has has such a small impact on extra-galactic astrophysics, and that most interferometric studies have been directed towards a small number of the brightest exemplars of different classes of targets. The ability to reach a limiting sensitivity comparable to that of current NGS AO installations would be a major advance.
2.3 Angular resolution
A dimension along which existing interferometric implementations have made significant inroads is that of angular resolution. As mentioned in section 1 above, all existing separated element optical/IR arrays have baselines sufficiently long — typically at least 100 m — that sensitivity to sub-10 mas angular scales is guaranteed. There seems little doubt that arrays with baselines at least five times longer than this, i.e. of order 500 m are desirable. Baldwin and Haniff (2002) provide a useful table summarising the characteristic angular scales expected for a range of targets at distances which would ensure that more than only the brightest targets would be observable. Many of these classes of object, e.g. main sequence stars, stellar gas shells, spectroscopic and interacting binaries, and AGN broad line regions, would only be expected to be resolved on baselines in excess of 300 m.
What is less clear is whether arrays with baselines in excess of a kilometer are of high priority. Targets requiring such long baselines to resolve them must necessarily be small, and if so, they must be distant. In that case, it is likely they would be faint unless they had particularly high brightness temperatures. Baldwin & Haniff [2002] discuss this argument further, but notwithstanding the details, it seems probable that enhancing the imaging capability and sensitivity of existing arrays ought to take priority over extending their maximum baselines.
3 Science drivers for the MROI
The science case for the MROI is predicated on three key areas, familiar to many existing interferometric facilities today. This is really a reflection of the brightness temperatures of the targets and the operational wavelengths and baselines accessible at most modern facilities. The key differences associated with the interferometric observations at MROI, however, are in more accurate imaging and in much greater sensitivities, both of which will dramatically change the fundamental scientific questions that can be answered. Our three key areas, outlined briefly below, encapsulate the scientific drivers which drive the design choices for the facility.
3.1 AGN Astrophysics
Though active galactic nuclei (AGN) have been studied for many years, interferometric imaging offers the prospect of gaining important new insights into their structure. The physical scales of most interest include the broad line region (BLR) on sub 0.1 pc scales; the narrow line region (NLR) extending from 1–1000 pc and the dust torus which ranges in size from pc. In nearby AGN () these correspond to angular sizes from 0.5 mas to several seconds of arc, but it is on scales smaller than 0.1 arcseconds where observations with the MROI will have most leverage.
The limiting sensitivity of modern interferometers today means that only about 1 dozen AGN have been studied at near or mid-infrared wavelengths [c.f. Tristram et al., 2009; Honig et al., 2012; Kishimoto et al., 2011]. However, even this small quantity of data has been intriguing. For instance, in the mid-infrared, Centaurus A appears to have a thin, dusty disk, the axis of which may align with its radio jet [Meisenheimer et al., 2007] while NGC 3783 and the Circinus galaxy appear clumpy [Beckert et al., 2008; Tristram et al., 2007] and NGC 1068 may have a torus and funnel structure [Raban et al., 2009]. Studying a significantly larger sample of these galaxies with an interferometer with complex imaging capabilities is required to understand the origin and ubiquity of these morphologies.
A key goal for MROI will be to investigate the details and reliability of dust torus models. It is being designed to address questions such as: a) the frequency of occurrence of tori, b) the geometric and physical properties of the obscuring material, and c) whether these are consistent with “unified” schemes. In particular, model-independent images are crucial in interpreting observations of clumpy (but small) tori, which are not well-described by a small number of parameters but which are increasingly favoured. Simulations of the archetype NGC 1068 [Honig et al., 2006] predict K-band visibilities greater than 30% on baselines of up to 50 m, a regime where the most compact configurations of the MROI (with baselines from 8–45 m) will be ideally matched to the relevant scales. Furthermore it should be possible to correlate the torus axis with the larger scale radio emission.
A more ambitious study to be undertaken with MROI will be to investigate the BLR/NLR transition region. Imaging the transition region between the BLR and the NLR offers the prospect of isolating the outflowing line-emitting gas and in turn determining the origin, geometric, physical and temporal characteristics of the outflow. This would result in a breakthrough in the understanding of the dynamics of AGN cores, of which little is currently known.
3.2 YSO Astrophysics
A second major theme for MROI will be to advance detailed studies of star and planet formation through studies of young stellar objects (YSOs). As with the AGN, results from first-generation near-IR interferometers have led to significant new insights into the complex inner structure of protostellar/planetary disks. For example, the sizes of Herbig Ae/Be and T Tauri objects have been measured to be 3-7 times larger than predicted by geometrically-thin disk models previously used to explain the SED measurements [see e.g. Millan-Gabet et al., 2007, and references therein], and have led to the development of a new class of “puffed up” models for the flared disk emission [e.g. Dullemond et al., 2001; Isella & Natta, 2005]. Other measurements have produced tantalising evidence for structures in the inner disk relevant to the planet formation process. For example, hotspots have been detected in the disks of AB Aur [Millan-Gabet et al., 2006] and FU Orionis [Malbet et al., 2005], and evidence for gap clearing has been found in LkCa 15 [Espaillat et al., 2008].
What has been missing in all of these studies has been sufficient visibility and closure phase data to properly constrain the complex geometrical and physical structure of the inner, i. e. sub-10-AU-scale, regions of the disk. Measurements of order one hundred Fourier amplitudes and closure phases, at sensitivity levels a several magnitudes fainter than what is currently possible, will be critical to understanding the physical processes taking place there.
A key goal for MROI’s early science will be to provide a census of disk properties for well-defined samples of low, intermediate and high-mass stars. By allowing hundreds of targets to be observed with excellent Fourier plane coverage, it will be possible to critically assess theoretical models which predict not only the structure expected but also the temporal evolution of the dust. This evolution is expected to be strongly impacted by the presence of any planetary or brown-dwarf companions in the inner disk, which should lead to either disk breakup or disk-clearing [Creech-Eakman et al., 2010]; such structures will certainly be detectable in active YSO disks with MROI. The higher resolution spectral modes of MROI () will allow it to discriminate between dust, gas and molecular emission using spectral diagnostics such as the Brackett gamma line and CO bandheads [c.f. Eisner et al., 2007]. MROI will thus enable routine monitoring of the dust and gas on scales that have Keplerian rotational timescale of weeks to years.
A parallel theme will be to search for low-mass companions in star forming regions, not only from the perspective of precise dynamical mass and age estimation [e.g. Konopacky et al., 2007a] but also to validate models of star formation. To date this has been undertaken using high resolution imaging methods on single telescopes [e.g. shift-and-add imaging, speckle interferometry or AO — see Konopacky et al., 2007b], but these are limited in both angular resolution and the ability to detect the lowest-mass companions. MROI, when employed in the compact configuration, will be ideally suited to make major inroads in this area: companions with a K-band flux 1/100 that of the primary star will be detectable within a night’s observations, allowing numerous candidates in, e.g., Taurus and Orion to be surveyed to well below the hydrogen burning limit.
3.3 Mass-Loss and Dynamical Systems
The third key area for optical/infrared interferometry is the study of fundamental physical processes. Unique contributions can be made by imaging interferometers with sub-milliarcsecond resolution whenever complex systems/processes are being studied which are difficult to understand without direct imaging. In this case, MROI will focus on the physics of mass loss, mass transfer in binaries, and time-domain/dynamical interactions. While this type of work is in principle possible for any interferometer, it becomes much more powerful with an increase in the number of apertures (and consequent numbers of visibilities and closure-phases) that are used and with shorter timescales for producing complete images. Excellent recent examples of images in these broad scientific areas include: CHARA imaging results on the long-period eclipsing system, Epsilon Aurigae [Kloppenborg et al., 2010], and on the interacting binary system Beta Lyrae [Zhao et al., 2008] and older aperture masking results from the Keck Observatory on interacting binary/mass-losing system WR104 [Tuthill et al., 2008].
Because few actual images exist today, except for the brightest “archetypes” of each class of object, it is expected that tremendous insight into all the evolutionary stages of low to high-mass stars will be accomplished when statistical samples of objects in each class are accumulated. Some of the questions MROI will address include: a) how does the pulsational behaviour in the late stages of life of an AGB star affect the mass-loss and subsequent shaping processes of planetary nebulae; b) what are the characteristics of mass-loss processes at different stages in stellar evolution, i.e. continuous, episodic, clumpy, smooth; c) what is the interaction between the stellar surface (i. e. magnetic fields, star spots) and the mass-loss processes as traced over a variety of time-scales; d) how does mass-transfer in interacting systems trigger subsequent explosive events; e) what is the connection between stellar “shape” (i. e. non-spherical, rapidly rotating systems) and their wind structures; and f) do optical or infrared counterparts exist to trace known phenomena at X-ray/UV wavelengths, for example in the shocks or hot winds, for high-mass systems? Papers which shed some light on these questions have been published in the last few years and include: on the nova RS Ophiuchi Barry et al. [2008], on star-spots on Betelgeuse [Chiavassa et al., 2010], and on imaging of rapidly rotating stars [c.f. van Belle, 2012, and references therein]. In all cases, high-resolution images on statistical numbers of objects, and especially over a variety of timescales, will only increase our understanding of the physical processes involved. MROI’s design is uniquely developed to address many of these questions.
4 Technical requirements
In order to clarify the goals for the conceptual design of the MROI, the functional and performance requirements for the array need to be defined. The major requirements are briefly summarised below, but this is only part of a much larger list. The requirements generally result from a desire to address the three primary science missions outlined above, i.e. studies of active galactic nuclei, star and planet formation, and stellar accretion and mass loss, but is important to recognise that the requirements do not solely flow top-down from the science case but result from a balancing scientific desirability and technical feasibility: it will be seen below that many scientifically desirable specifications conflict with one another when it comes to implementing them together in a single design.
4.1 Imaging
The attainment of a unique imaging capability was one of the chief scientific drivers for the MROI. The imaging performance can be characterised crudely by the number of resolution elements (often called “resels” in analogy to pixels) in an image but for interferometric imaging the number of resels which can be derived is dependent not only on the angular size of the object but also on the object morphology. Objects such as stellar disks have visibility functions which fall rapidly from unity with increasing spatial frequency. On the baselines which have sufficient angular resolution to see interesting features such as surface activity, the majority of the flux in the object is resolved and the visibility can be so low that the signal-to-noise ratio of the fringes is below the level required to find the interferometric fringes even on bright targets. Our experience with the COAST interferometer was that many such objects could not be observed with more than a few resels across the image, not for the lack of long enough baselines but for lack of ability to acquire fringes on baselines beyond the first lobe of the object visibility function.
A way to get around this limitation is known as “baseline bootstrapping” and is discussed in the next section, but use of this technique imposes limitations on the efficient sampling of the plane. As a result the requirements for imaging of objects which have a bright and compact core which remains unresolved when the features of interest have been resolved are different from those for imaging of so-called “resolved-core” objects like stellar disks. The requirement for the MROI was that with resolved-core objects it should be able to make images with 55 resolution elements across the object while with compact-core objects under favourable conditions it should be able to make 1010 resel images. This exceeds the image quality of all existing optical arrays and is comparable to the images from aperture-masking arrays and many existing radio interferometers.
Another important aspect of the imaging is the dynamic range of the images, i.e. the ratio of the brightest and weakest believable features in any recovered maps. This is dependent on a combination of the Fourier coverage of the observation and the calibration errors on the visibility amplitudes and phases. Aperture-masking results suggest that a dynamic range of 100:1 on bright sources is both feasible and scientifically productive, and so this specification adopted for the MROI.
4.2 Sensitivity
The concept of sensitivity is usually defined for an interferometer in terms of a limiting magnitude. An object at the limiting magnitude is just bright enough that it is possible to acquire interferometric data on the object. This implies that some form of fringe acquisition and tracking is performed, as without this it is impossible to guarantee that the interferometer is observing fringes. Thus the limiting magnitude refers to the overall brightness of the object for fringe-tracking purposes: if an image with a large dynamic range can be made, it may be possible to observe objects within the field of view which are several magnitudes fainter than this.
The extra-galactic component of the top-level science mission for the MROI sets the basic requirement for its desired sensitivity. At H-band magnitudes fainter than about 11 the very closest and brightest active galactic nuclei just start to become visible. However, it is not until a H-band sensitivity of 14 is reached that of order 100 targets become visible in the Northern celestial sky. In practice, such a sensitivity requirement for the array is particularly challenging but later sections will show that this can be achieved in an optimised design.
4.3 Wavelength coverage
The wavelength range from 0.6–2.4 m is key to the science goals of MROI because it includes the key H line at 656 nm and also the near-infrared range where many of the top-level science targets are bright. The deterioration in wavefront quality due to atmospheric “seeing” means that it becomes rapidly more difficult to compensate for the atmosphere at shorter wavelengths, while at longer wavelengths the rising thermal background causes the sensitivity to fall rapidly. Thus the near-infrared is the regime where the best interferometric sensitivity can be realised.
4.4 Spectral resolution
Spectral resolving powers of would be valuable for studying atomic line emission and absorption in stellar sources but such a capability would only be useful on relatively bright objects because of signal-to-noise-ratio issues. A higher priority is a resolving power that allows useful isolation of molecular features from their nearby continuum in stellar sources, and velocity-resolved imaging in the very nearest AGN, together with a lower-resolution mode which allows crude spectral diagnostics on fainter targets.
4.5 Automation and reliability
It is well established that the most productive optical/infrared interferometers have been those with highly automated sequencing and operation. Our design philosophy for the MROI implicitly assumes this model, so that tasks such as pre-observing alignment of the optical trains, self-testing of the detector and beam combination subsystems, and failure recovery, will all be carried out transparently with a minimum of operator intervention.
5 Conceptual design
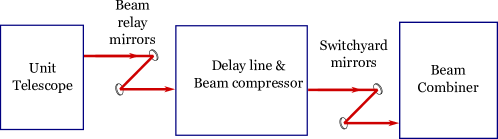
The requirements for the MROI emphasise its ability to image faint and complex sources in a model-independent manner, and so designing array which optimised both of these aspects was critical. Both of these goals, and especially the sensitivity goal, affect all aspects of the interferometer design and so there is a many-to-many relationship between the elements of the implementation and the design goals. In this section the major elements of the conceptual design are described, the relationship of these elements to the overall goals is described and the trade-offs made between conflicting requirements are addressed. The elements of the design are addressed roughly in order of their importance, but are also ordered by the sequence in which the stellar light impinges on each of these in its journey from the star to being detected as fringes, as shown in Figure 2.
5.1 Array configuration
A critical choice for any interferometer is the number of telescopes. The cost of an interferometer increases approximately linearly with the number of telescopes, but the number of points sampled by telescopes increases faster than . Adequate coverage is critical to imaging performance, both in terms of image complexity and dynamic range, but can also be achieved (at the expense of imaging speed) through repositioning of telescopes.
When imaging resolved-core sources (as defined in section 4.1), an interferometer with a larger number telescopes is superior not only in imaging speed but also in the achievable image complexity. This is because the only reliable way to access baselines which give many resels across such sources is to utilise the so-called “baseline bootstrapping” technique Pauls et al. [1998].
In baseline bootstrapping, multiple telescopes are arranged in a “chain” such that the nearest-neighbour telescopes are spaced by a distance which is less than the size of the main lobe of the visibility function. On these shortest baselines the fringe visibility is high enough to allow fringe tracking and hence the measurement of atmospheric phase differences. These differences can be integrated along the chain to track the phase perturbations on the longest baselines where the fringe visibility is too low to allow direct fringe tracking. The longest baseline which can be accessed is limited to times the shortest baseline. Hence the maximum number of resels across such an object rises approximately linearly with the number of telescopes. This limit cannot be improved upon by moving the telescopes.
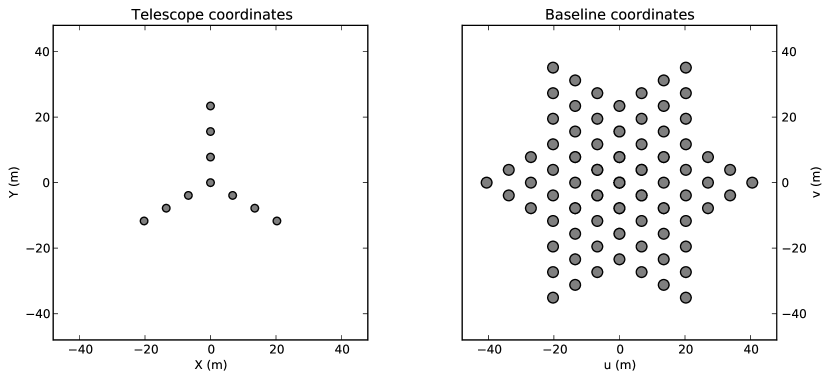
The MROI infrastructure is designed for 10 telescopes (more telescopes could be added but could not be operated simultaneously). When the telescopes are arranged in an equispaced -shaped configuration as shown in Figure 1 then the array can be viewed as a set of 3 “bootstrapping chains” each consisting of 7 telescopes, oriented at 120∘ angles to one another. The ratio of the longest baseline in this array to the nearest-neighbour spacing is 5:1 and so this will allow approximately 55 resel imaging on resolved-core objects, a capability which is unmatched by any existing optical interferometer.
At the same time the “snapshot” coverage of the array is superior to any existing optical interferometer, as shown in Figure 1, giving access to 36 well-separated baselines and 36 closure phases. For compact-core objects, then a non-redundant configuration can be used, giving access to 45 baselines simultaneously. Using Earth rotation to increase the density of the coverage will then allow images with approximately 1010 resels to be reconstructed on these objects.
A “Y” shaped array configuration has been used in a number of interferometers including COAST, NPOI and CHARA and offers many advantages including the ability to easily route light from the telescopes to the centre of the array while using a train of mirrors whose angles of incidence are symmetric between telescopes. However the most compelling advantage of this layout for the MROI is that the array site is on a saddle in the mountain which allows the arms of a horizontal “Y” shaped array to be built with a minimum of earth movement.
The longest practicable baseline using this layout is approximately 350 meters and this gives a maximum angular resolution of 0.3 milliarcseconds at a wavelength of 600 nm.
A single configuration of the array gives access to minimum and maximum angular scales with a ratio of only 5:1, whereas the range of sizes of possible science targets ranges over more than two orders of magnitude. The telescopes are therefore designed to be relocatable between a number of different arrays. The primary array configurations are scaled versions of the “bootstrapping” array, with maximum baselines ranging from 40 m to 346 m and minimum baselines ranging from 7.8 m to 67 m. The array therefore allows access to angular scales with a range of 44:1.
Four “bootstrapping” configurations span this range with a scaling of approximately two between successive configurations. Different configurations have been arranged to re-use some of the telescope stations (by distorting the regular spacing of the telescopes along the arms by a few percent) so that a total of 28 stations is required.
5.2 Telescopes and adaptive optics
One critical factor in the sensitivity of an interferometer is the telescopes, called “unit telescopes” here to distinguish them from the aperture synthesis telescope comprising the entire array. Large unit telescopes equipped with high-order adaptive optics (AO) would appear at first sight to be the most promising route to high sensitivity, but not only is this an expensive option for an imaging array with many telescopes, but it also conflicts with the need to pack the telescopes close together in order to sample larger-scale angular structure and thereby access targets such as nearby evolved stars and geosynchronous satellites.
In addition, high-order adaptive optics are only effective if there is a bright enough reference available to sense the wavefront perturbations. The angular density of bright natural references (stars) is sufficiently low that the science target itself is most often the AO reference. Typical AGN-type targets with an near-infrared magnitudes of 14 have visible-wavelength magnitudes of around 16 and these are too faint to drive current AO systems at radial orders higher than tip-tilt Wilson & Jenkins [1996].
Tip/tilt correction gives the best limiting magnitude on telescopes which are of order 2–3 in diameter Buscher [1988b] and so, in the absence of laser guide star systems at each telescope, telescopes in the 1–2 metre size range provide close to the best possible interferometric sensitivity at optical and near-infrared wavelengths.
5.3 Beam relay
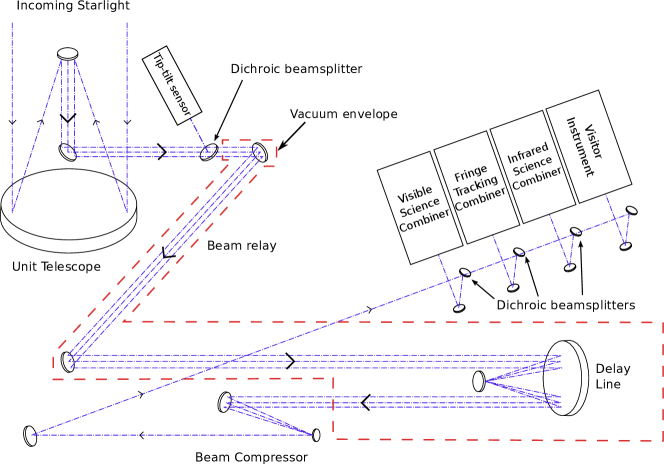
The parallel beams exiting from the unit telescopes are sent to the beam combining optics as a set of parallel beams, where most of the path is in vacuum, as shown in Figure 2. Vacuum beam propagation was chosen over monomode fiber optics for beam transport as it allows the propagation of the entire bandpass from the optical to the infrared to be handled in a single system rather than requiring splitting the bandpass into multiple bands for propagation, which inevitably incurs additional losses.
The diameters of the beams need to be significantly larger than the Fresnel zone size in order to minimise the effects of diffraction for propagation over a distance . For propagation distances of order 1 km and a wavelength of 2.2 m, this zone size is of order 5 cm and so relatively large optics are required for propagation over these distances. The propagation distances inside the beam combining area are of the order 20 m so smaller beams can be used in order to keep the size and cost of the more complex beam combination optics within reasonable bounds. A set of beam compressors between the delay lines and the beam combination optics serves to transform between these two beam sizes.
5.4 Delay lines
Dynamical optical path compensation is required in order to equalise the path-lengths travelled by the starlight from the target to the detector. The path-length stroke required from these compensators scales with the size of the array, and arrays of comparable size such as CHARA and NPOI utilise a two-stage path compensation system, consisting of a switchable delay to give large stroke and a continuously-variable delay to give fine control of the path-length. The approach adopted at MROI was to have a single-stage system which introduces all the delay in a continuously-variable manner. This minimises the number of reflections needed and at the same time avoids the switching overheads associated with the two-stage systems.
5.5 Science instruments
The 10 beams exiting from the delay lines are compressed and then spectrally split using optimised dichroics Hobson & Baldwin [2004] between a number of interferometric beam combiners. A visible-light combiner and a near-infrared (JHK) combiner can be operated simultaneously, and space has been left for a “guest” instrument which might substitute for one or other of these combiners. These beam combiners will be optimised for operation on faint sources, but at low light levels the signal-to-noise ratio of the fringes decreases as the number of beams which are combined simultaneously is increased, because the photons from all the telescopes contribute to the noise on all the baselines. Therefore the MROI science instrument concepts are based on a number of parallel combiners, each of which combine a different subset of the beams. A beam “switchyard” then allows the beams to be “shuffled” between combiners to allow all pairs of telescopes to be interfered with one another. One possibility would be to have two combiners accepting 4 beams each. This would produce fringes on 12 baselines and 6 independent closure phases. A series of 4 reconfigurations of the switchyard would allow access to all 45 baselines and 24 of the 36 independent closure phases possible from the array.
5.6 Fringe tracking
Fringe tracking is required to overcome effects of the random path-length perturbations introduced by the atmosphere and the instrument. Fringe “cophasing” attempts to compensate for the motion of the fringes at the sub-wavelength level while “coherencing” is coarser and attempts to reduce the fringe motion to less than the coherence length of the light, which can be many microns.
Fringe tracking in the MROI will mostly utilise the group delay method which is based on observing the phase differences between the fringes in multiple spectral bands. This allows fringe coherencing on sources about 10 times fainter than is possible with cophasing methods Buscher [1988a] and so is the best way of achieving the MROI faint-science goals. The MROI has been designed with a separate fringe-tracking combiner rather than using the science instrument to derive a fringe-tracking signal, because it allows each combiner to be optimised for a different role.
5.7 Alignment
Misalignments of components of the interferometric beam train are a source of wavefront error in an interferometer which can lead to significant losses in light throughput and fringe visibility. Many of the components need to be realigned on at least a nightly basis to account for drifts which have occurred during the day. A significant fraction of the realignment in many interferometers requires manual intervention and this can limit the amount of realignment which can be done at the start of the night. The MROI was designed from the start to allow automated alignment of the majority of the optical train in order to minimise the time overhead and to increase the overall accuracy of the alignment.
5.8 Control software
Automated operation of an interferometer is critical to its scientific productivity, as large numbers of subsystems must work together to produce the interference fringes, and the cadence between observations is necessarily short in order to allow for observations of calibrator stars as close in time to the target observations as possible. A second critical feature for interferometers is continuous recording and storing of engineering data, as the calibration of the fringe visibility can depend on many variables within the system, and some of these can only be determined after the fact. For commissioning and operations, near-real-time display of data from multiple subsystems on the same console is essential to debugging operation of the system.
The control software concept is based around independently-developed sub-systems forming a distributed system communicating over Ethernet. The system as a whole is only soft-real-time as the hard-real-time elements are confined mostly within subsystems such as the fast tip/tilt system. Real-time communication between subsystems is needed only between the fringe-tracker and the delay lines and this can be provided by a dedicated communications link.
6 Error budget
Given that increasing telescope size does not provide substantial gains in sensitivity, the overall efficiency of the system becomes paramount. In order to achieve the faint-object science goals for the MROI a two-fold strategy to achieve the maximum optical efficiency was adopted. The first component of the strategy was to focus on an optical design which was as simple as possible, so as to minimise the number of optical elements in the system. In some cases this meant sacrificing capabilities, for example a full polarimetric capability, which could have offered increased science performance on brighter targets. It should be noted that the polarisation fidelity of the interferometer (defined as the ability to faithfully measure the object morphology in the Stokes I component) was not sacrificed as this did not involve compromising the optical efficiency of the system Buscher et al. [2009].
This resulted in a beam train which has a low number of optical elements compared with many existing arrays: in the MROI design starlight experiences 13 reflections from the entrance of the telescope to the entrance of any of the beam combining instruments. This can be compared with the VLTI, where the light experiences 32 reflections between the equivalent locations in the beam train Puech & Gitton [2005].
The second component of the strategy was to make sure that each surface introduced the minimum optical loss consistent with an affordable budget and minimal technical risk. This can be achieved in principle by only using components with the best possible coatings and which are manufactured to the tightest possible wavefront tolerances. However, the components tend to cost exponentially more the tighter the tolerances are set, and achieving these tolerances is easier for some components than for others. From this emerges the concept of an optical “error budget”, in which global values for the allowable losses are defined and these budgets are then shared between subsystems in a way that excessive requirements are not placed on any single subsystem.
In interferometric instruments, both the losses to the number of photons and losses that reduce the fringe visibility are important, and so both must be considered as part of the optical error budget. The majority of the visibility loss is caused by wavefront errors, including both temporal “piston jitter” errors caused by vibrations in the system and spatial wavefront errors such as tilt and focus errors. As a simplifying assumption, the fringe visibility loss is assumed to vary as
| (1) |
where is the spatial or temporal RMS difference of phase between the interfering wavefronts. This assumption is related to the “extended Maréchal approximation” used in aberrated optical systems and empirically found to be a reasonable approximation for Mahajan [1983]; Hardy [1998]. If each beam train in the interferometer introduces uncorrelated phase errors with RMS value then
| (2) |
If in addition each component labelled in the beam train introduces a spatial or temporal wavefront error which is uncorrelated between components then the total error is the root summed squared (RSS) of the individual errors
| (3) |
As a result, the visibility loss contributed by different components can be combined multiplicatively in the same way that losses in photon throughput can be combined.

Figure 3 shows an outline of the visibility loss budget for the MRO interferometer. This is shown in a “tree” form showing how the budget is split amongst various components. The loss is shown for a wavelength of 1.6 m which is the wavelength of the highest-sensitivity fringe-tracking for MROI. The visibility losses in the error budget can be broken down into factors due to atmospheric seeing and those due to the instrument. At the reference wavelength, the MROI telescopes have a diameter in the reference seeing conditions (cm at a wavelength of 500 nm) and so with perfect tip/tilt correction the RMS visibility loss factor due to the uncorrected higher-order atmospheric aberrations is about 0.6 Buscher [1988b]. Residual tilts caused by the imperfect performance of the tip-tilt correction system are budgeted to allow an additional visibility loss factor of 0.9. Assuming an exposure time of 2 then the visibility loss due to atmospheric temporal fluctuations is about 0.8 Buscher [1988b].
Spatial and temporal wavefront errors introduced by the interferometer optics are budgeted to each introduce a reduction in the fringe visibility by a factor 0.8, values comparable to the atmospheric losses and corresponding to RMS wavefront errors in each case. The telescope optics are the largest elements in the optical train and the most prone to vibration, so half of the RSS wavefront error budget (corresponding to a 10% visibility loss) is allocated to the telescopes and the remaining half to the rest of the interferometer subsystems.
The remaining optical train has smaller optics, but a larger number of components. Each optical element will introduce a wavefront error due to imperfections in its manufacture, but in addition the curved optical components can introduce wavefront errors due to alignment errors such as defocus. Assigning the wavefront errors equally to manufacturing errors in each element and the alignment error leads to the spatial wavefront error budget being shared between more than 20 contributors. As a result, each contributes on average only 0.5% or so to the final visibility loss.
This level of loss corresponds to an RMS wavefront error of at the fringe-tracker wavelength of 1600 nm, corresponding to RMS at the 633 nm HeNe laser wavelength at which optics are normally tested. Small optics can be routinely polished to give a wavefront quality of peak-to-valley and the RMS wavefront error will typically be a factor of 5 or so smaller than the peak-to-valley [Porro et al., 1999], so a mirror will contribute a visibility loss well within the typical tolerances assigned. Thus it can be seen that by using an error budget, the wavefront error requirements can be shared out such that no single component has unfeasible requirements placed on it.
An error budget for both photon loss and visibility loss was developed for the entire system with a starting goal of an overall visibility loss factor of and a photon throughput from the top of the atmosphere to detected photoelectrons of 20%. Adjustments to the error budget based on more detailed designs of the subsystems systems has resulted in a predicted system visibility loss factor of and a photon throughput of 13%.
7 Limiting magnitude
The science requirements lead to a specification that the interferometer should allow fringe tracking on an object with an H magnitude of 14 which is unresolved on the nearest-neighbour “bootstrapping” baselines. With a 13% throughput and assuming a pairwise, nearest-neighbour fringe-tracking beam combiner, 1540 photons/second will be detected over the H-band from such an object in each fringe pattern, and so in a 35 ms exposure (corresponding to 2 in the reference seeing conditions of ms at a wavelength of 500 nm), approximately photons from the target will be detected. With an RMS system visibility of , the fringe signal level (sometimes called the coherent flux) will therefore be
| (4) |
There will be an additional 8.2 photons detected per frame of sky and thermal background photons giving a photon noise level of
| (5) |
Assuming that the fringe tracker uses 4-bin “ABCD” sampling and 5 spectral channels across the H-band, then the noise due to detector read noise is
| (6) |
where is the noise on the readout of a single pixel, assumed to be 2 electrons: near-infrared detectors with single-read noise values of this order are now available. Thus the signal-to-noise ratio for a fringe measurement in a single exposure will be
| (7) |
Simulations of fringe tracking with this number of spectral channels Buscher [1988a] show that group-delay tracking is possible when the signal-to-noise ratio per exposure is as low as 0.56, so the MROI science goal of fringe-tracking on a H=14 AGN appears to be achievable with this design. Improved margins could be obtained if detector read noise performance better than 2 electrons can be achieved using multiple non-destructive reads, as has already been demonstrated in the laboratory [Finger et al., 2012].
8 Experience from implementing the design
Because the MROI is not currently operational it is not yet possible to provide definitive evidence that by implementing the conceptual design all the scientific performance goals will definitely be met. Instead we can look at what the experience of designing (and in many cases building and testing) the subsystems on the basis of the conceptual design tells us about how well the conceptual design stands up to the reality of implementation. Here we discuss this experience for selected subsystems. The aim is not to describe the designs of these subsystems in detail, as this has been (and will be) discussed elsewhere, but rather to comment on where the design was unusual and where there were technical roadblocks due to unrealistic constraints imposed by the conceptual design.
8.1 Unit Telescopes
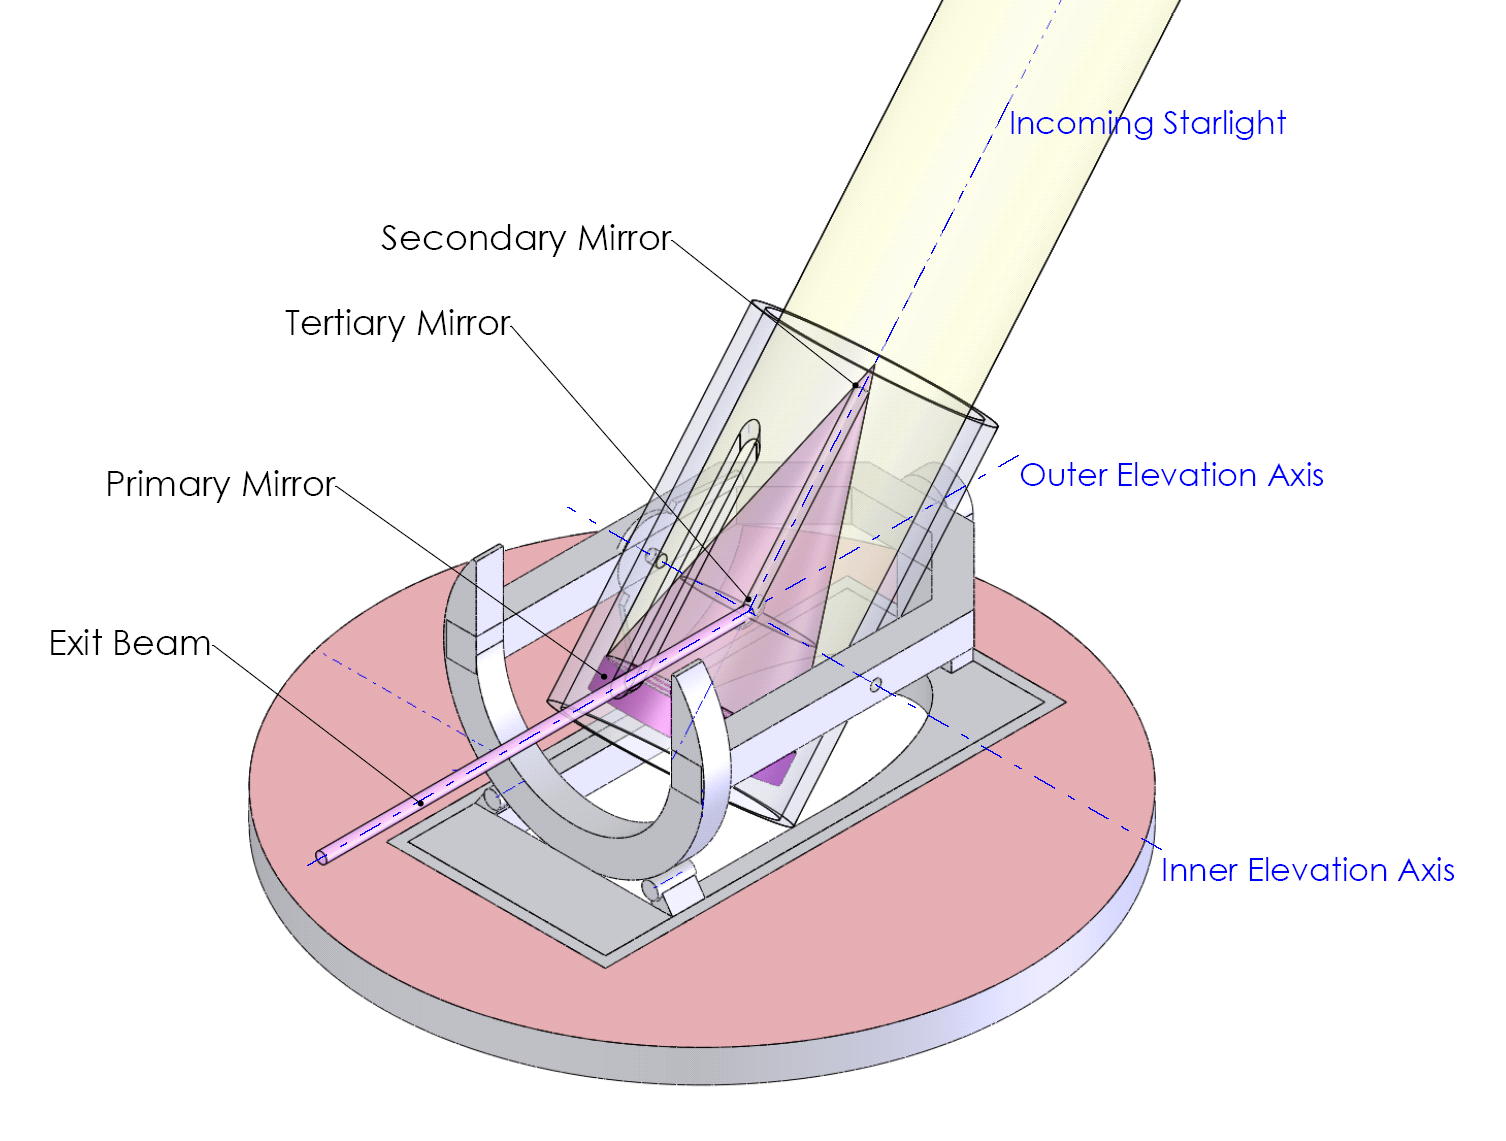
The unit telescopes for the MROI are 1.4 m in diameter and use a relatively unusual mount design in order to improve light throughput to the interferometer. This “alt-alt” design as shown in Figure 4 allows the starlight to be captured and converted into a narrow collimated beam travelling in a fixed horizontal direction using only 3 reflections. This therefore has lower reflection losses than conventional “alt-az” mount which typically requires 7 reflections to achieve the same result.
In addition, the telescope has been specified with a high wavefront quality in order to reduce fringe visibility losses due to the optics. Wavefront quality for an interferometric telescope includes also the “piston term” errors which can be induced by telescope vibrations and also pupil wander which can cause the beams from different telescopes not to overlap.
The telescope mounts have been built and tested in the factory by AMOS (Advanced Mechanical and Optical Systems) and have passed all major performance tests. The OPD vibrations are less than 40 nm RMS over a 35 ms exposure and the pupil motion is less than 350 m in radius.
The telescopes are designed to be relocatable between different stations along the array. The concept adopted is to relocate the telescope and its enclosure together, using a transporter based on those used for stacking shipping containers.
Despite the relatively small size of the telescopes, attaining the shortest telescope spacings in a close-packed configuration proved difficult. The enclosures were designed to allow only the minimum space for support electronics, servicing and relocation, and the minimum spacing achieved was 7.8 m, only just short enough to overlap with the baselines offered by 8-meter-class telescopes.
8.2 Fast Tip-Tilt Systems
The location of the fast tip-tilt (FTT) systems in the MROI beam-train is perhaps unusual; we have opted to place the sensors on the Unit Telescope Nasmyth platforms (with corrections applied by the UT secondary mirrors). Compared with locating the sensors in the beam combining building, this increases the photon flux available for sensing atmospheric tip-tilt perturbations and thus enhances the limiting sensitivity of the fast tip-tilt systems. This sensitivity limit would otherwise be the limiting factor for observations of red objects such as AGN and YSOs. With the sensor at the telescope, we expect to achieve a residual two-axis tip-tilt error of 60.8 mas RMS on the sky at in the reference seeing, by taking advantage of the high quantum efficiency and sub-electron read-noise offered by electron-multiplying CCD detectors.
However the disadvantage to this location is the sensitivity to non-common-path errors, whether movements of the FTT optics which shift the image on the tip-tilt sensor or changes in the alignment of the beam relay mirrors which are not be seen by the tip-tilt sensor. The system has therefore been designed for high optomechanical stability ( on the sky for a C change in ambient temperature, corresponding to a 0.5 m image shift on the tip-tilt sensing CCD). The design of the FTT systems, including optomechanical considerations, is discussed in more detail by Young et al. [2012].
The level of intra-night stability we expect to achieve with the final design, based on tests of prototype components, is a factor 2–4 greater than originally budgeted. To accommodate this, as well as any instability in the tilts of the beam relay mirrors, we have designed a continuous alignment system to be installed in the beam combining building — this is described in section 8.7.
8.3 Beam Relay System
The diameters of the beams for propagation from the telescopes to the BCA was chosen to be 95 mm based on beam propagation studies which included the effects of atmospheric turbulence Horton et al. [2001]. Inside the BCA the beam is compressed to approximately 13 mm.
Due to the Y-shaped array design, only two reflections are needed between the telescopes and the delay lines, but the mirrors involved need to be outdoors with their centres 1.6 m above ground level. The concrete piers to hold these mirrors needed to be engineered to achieve the appropriate stability in the face of wind loads, and this proved technically challenging, resulting in bulky and costly piers. Although the mirror mounts will be inside vacuum enclosures, they and their piers will be subject to substantial diurnal temperature fluctuations and so the stability of the beam relay is being tested to see if they will be sufficiently stable during the night.
8.4 Delay Lines
The desire to deliver high throughput and efficient operations were major drivers for the implementation of the MROI delay lines. The detailed design of these has been presented elsewhere [Fisher et al., 2010] and so here we summarise only a few of their novel features.
The MROI design supports a delay range from 0 to 380 m, in vacuum, and is realised in a single stroke with only three reflections. As a result there is no need for any separate switchable “long” delays nor any longitudinal dispersion correctors.
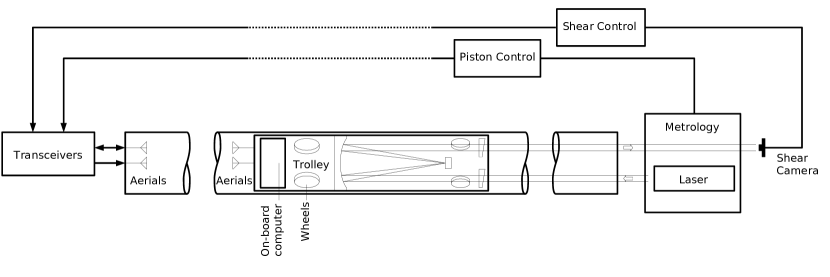
Implementing this functionality required a design which concentrated in making the delay scalable to hundreds of metres at an affordable cost. This involved innovations such as using the vacuum vessel as the surface on which the delay carriage runs, wireless control and inductive supply of power so that there are no cables to be dragged as the optical delay is adjusted. Figure 5 shows a schematic of the delay line, indicating that in addition to the normal control loop for the position of the catseye (controlling the “piston” component of the wavefront), the delay lines incorporate active control of the shear of the return beams, to allow the use of less straight and hence more affordable pipes for the vacuum vessel.
Tests in Cambridge in a 25 m long evacuated test rig have demonstrated that the system can meet all the system’s top level performance requirements, including a delay jitter nm RMS over 10 ms; nm RMS over 35 ms, and nm RMS over 50 ms ( RMS over ). Full repositioning of the carriage over the whole OPD range can be executed in 5 min. The first delay line carriage has been delivered to the MROI site and site acceptance tests in a 100 m long delay line will take place later this year.
8.5 Fringe Tracking Beam Combiner
The fringe tracking beam combiner that has been adopted for the MROI (Infrared COherencing Nearest Neighbour tracker: ICONN) is a so-called nearest-neighbour design in which the beam combiner optics only mix beams from pairs of telescopes that are closest to each other. This arrangement maximises the per-baseline signal-to-noise ratio.
The design of ICONN [Jurgenson et al., 2008] has allowed for up to 10 input beams, from the three arms of the MROI, and straightforwardly manages the unusual situation of the telescope at the vertex of the array which, unlike all the other array elements, has three nearest-neighbours. Currently the performance of ICONN is being tested in a single-baseline demonstration in the laboratory using a PICNIC detector to sense the dispersed fringes. Initial results are promising, and show very high fringe visibilities and an excellent level of stability in a relatively uncontrolled environment.
8.6 Science Beam Combiner
The eventual implementation will include two science beam combiners, using “visible” (0.6–1.0 m) and near-infrared (, , ) light respectively. A decision was made to prioritise development of the near-IR science beam combiner over the visible-wavelength one, as this enables a larger fraction of the science mission and places less stringent demands on the performance of the rest of the interferometer.
A range of design concepts for the near-IR science beam combiner were considered. These were described in Baron et al. [2006]. All the designs include a fast optical “switchyard” would comprise plane mirrors mounted on precision slides to enable the rapid selection of beams, such that different subsets from of the available beams are selected for entry into the combiner. This approach maximizes the instantaneous fringe signal-to-noise but incurs a small efficiency overhead associated with reconfiguring the switchyard every few minutes to measure all of the baselines. Initial tests of candidate slides suggest that it will be possible to use a look-up table to correct for errors in the mirror orientation following each reconfiguration.
8.7 Alignment
The biggest sources of alignment error in the interferometer are due to drifts in the tilts of mirrors in the beam train, which leads to tilt errors in the propagating beam. Over long distances these tilt errors lead to errors in the transverse position of the beam (“beam shear”) and so control of these errors requires measuring and correcting both the tilt and the shear simultaneously.
For the purposes of nightly alignment, the optical train from the telescope to the beam combiner can be conceptually split into three independent optical “sub-trains” whose optical axes must be aligned with one another, as shown in Figure 6. The optical axes of these sub-trains are defined by the inner rotation axis of the unit telescopes, by the line of motion of the delay line and by the optical axes of the relevant beam combiner respectively. These axes are connected by pairs of mirrors which can be adjusted to align the tilt and shear of the axes between sub-trains.
The alignment of these sub-trains will be accomplished by sending out a reference “pilot beam” which is aligned with the delay line axis and which shines both out towards the telescopes and back towards the beam combiners. Tilt and shear sensors at the telescopes and the beam combiners will allow the pilot beam position and direction to be compared with the corresponding optical axes. Automated procedures will be used to adjust the appropriate relay mirror pairs for any misalignment [see Shtromberg et al., 2010]. Most of this activity will be automated, and so is expected to run in parallel on the beam trains for different telescopes, minimising the overhead for system alignment.
For this strategy to be effective, most of the alignment system components will be located in thermally-stable environments so that drifts during and after the alignment process are kept to a minimum. At the MROI the beam combining area (BCA) is stabilised so that diurnal temperature fluctuations are at the 0.1∘ C level and this zone will contain the optics for the pilot beam injection as well as all the beam compressors and the beam combination optics. The delay lines are less susceptible to thermal drifts and so are housed in a passively stabilised enclosure, the delay line area or DLA. Over the seasons the DLA will be allowed to drift in temperature by more than 10∘ C but on a diurnal basis the temperature change is of the order 1∘ C, and so intra-night drifts will be kept within an acceptable range.
An issue which was recognised at a late stage in the design was that during the night (i. e. after the automated alignment) it will be likely that temperature-induced perturbations of the components of the beam trains mounted either on the telescope’s Nasmyth tables or the “exposed” beam relay mirrors will lead to slow ( s) drifts in alignment. To address this, there will be a secondary low-bandwidth alignment system located within the temperature-controlled BCA. This will correct slow changes in alignment by picking off light in the 940–1000 nm bandpass and monitoring the tilt and shear drifts in real-time.
8.8 Controls
In implementing the MROI control system, we have had to solve one overriding issue – the need to integrate many diverse systems into an integrated whole that can be operated efficiently. The diversity arises for a variety of reasons, including intrinsic differences in the kinds of functionality provided by the sub-systems (such as capturing sensor readings, closing fast servo loops, and complex algorithms for e.g. alignment or fringe tracking), and implementation constraints (such as the need to interface specific hardware devices or run under certain operating systems).
The problem of merging these systems is solved by using standardised interface software that is automatically generated from a simple high-level description of these systems. The generated interface code provides functionality for object construction and destruction, system configuration using data obtained from the central database, receiving commands, publishing monitor data, faults and alerts, and subscribing to monitor data published by other interferometer systems.
The control system is capable of managing independent subsets of the interferometer array. A typical use of this feature would be to operate most of the unit telescopes as a single system, while simultaneously doing calibrations on two recently moved telescopes. For additional information see Farris et al. [2010].
9 Conclusions
Although the MROI is not yet operational, a number of conclusions can be drawn from the design of the interferometer. The first of these is the importance of imaging to the scientific productivity of interferometers and the technical implications that arise from this. It is clear from the science case for the MROI that there are a large number of science targets for which imaging would provide critical new insights. All these targets are complex, and so the number of degrees of freedom in any model used to describe the target is large. Model-independent imaging is the only way to constrain these degrees of freedom in a way which can constrain which models are appropriate and is robust to any degeneracies in the models.
Given the scientific importance of imaging, we have argued that having a large number of telescopes is critical in meeting the imaging goals, not only because of the substantial increase in the speed of imaging, but because for many objects the problem of tracking atmospheric phase perturbations can only be tackled with a “bootstrapping” array, which necessarily requires many telescopes. The MROI with 10 telescopes will be able to image “resolved-core” objects with of order resels across the image; to make more detailed images of these objects will require correspondingly more telescopes — moving the telescopes around will not be able to achieve this effect.
A second scientific focus of the MROI is that of sensitivity. Our analysis suggests that increasing the aperture size of the unit telescopes in the interferometer will have limited effect in increasing the faintness of the targets which can be observed, and that concentrating on designing an efficient beam train which is able to provide the required functionality may have greater benefits. Our analysis has assumed the use of natural-guide-star adaptive optics, and the availability of cheap and reliable laser-guide-star technology could change this picture. Even in this latter scenario the increase in sensitivity can only be realised with larger and so more costly telescopes and this needs to be tensioned against the smaller number of telescopes which can be deployed within a given budget.
A final remark can be made about the process of the development of the conceptual design which is reflected in the structure of this paper. It is often argued that to design a new interferometer requires first the development a “killer” science case, and this then drives the technical development of the interferometer. The process described here is a more nuanced one which starts from an analysis of the scientific successes and shortcomings of existing arrays, followed by a judgement of which of the shortcomings can be overcome most fruitfully without requiring inordinate amounts of technical development. Having established the likely direction of technical evolution, the next step is to establish if there is indeed a science case that would capitalise on this increased technical capability and to develop this case more fully. Finally, this science case is used both to justify the requests for funding and to guide the design of the interferometer. Thus, and we believe this observation is true of many fields and not just interferometry, a successful instrument development process is in reality not a linear and purely “science-driven” one, nor is it a “technology-driven” one, but instead the flow between scientific and technical drivers is a never-ending back-and-forth between the two.
Acknowledgements
The authors would like to acknowledge the help of E.B. Seneta and J. Kern with the diagrams; development of the initial concept was aided by discussions with C. Briand and T. Sauza.
References
- Arroyo-Torres et al. [2013] Arroyo-Torres, B., Wittkowski, M., Marcaide, J. M. & Hauschildt, P. H. [2013] Astronomy and Astrophysics 554, 76, 10.1051/0004-6361/201220920;.
- Baldwin & Haniff [2002] Baldwin, J. E. & Haniff, C. A. [2002] Philosophical Transactions of the Royal Society of London. Series A: Mathematical, Physical and Engineering Sciences 360, 969–986.
- Baron et al. [2006] Baron, F., Buscher, D. F., Coyne, J., Creech-Eakman, M. J., Haniff, C. A., Jurgenson, C. A. & Young, J. S. [2006] “Beam combiner studies for the Magdalena Ridge Observatory Interferometer,” Advances in Stellar Interferometry, eds. Monnier, J. D., Schöller, M. & Danchi, W. C., 10.1117/12.671174.
- Baron et al. [2012] Baron, F., Monnier, J. D., Pedretti, E., Zhao, M., Schaefer, G., Parks, R., Che, X., Thureau, N., ten Brummelaar, T. A., McAlister, H. A., Ridgway, S. T., Farrington, C., Sturmann, J., Sturmann, L. & Turner, N. [2012] The Astrophysical Journal 752, 20, 10.1088/0004-637X/752/1/20;.
- Barry et al. [2008] Barry, R. K., Danchi, W. C., Traub, W. A., Sokoloski, J. L., Wisniewski, J. P., Serabyn, E., Kuchner, M. J., Akeson, R., Appleby, E. & Bell, J. [2008] The Astrophysical Journal 677, 1253.
- Beckert et al. [2008] Beckert, T., Driebe, T., Honig, S. F. & Weigelt, G. [2008] A&A 488, L17.
- Buscher et al. [2009] Buscher, D., Baron, F. & Haniff, C. [2009] Publications of the Astronomical Society of the Pacific 121, 45, 10.1086/597127.
- Buscher [1988a] Buscher, D. F. [1988a] “Getting the most out of COAST,” PhD thesis, Cambridge University.
- Buscher [1988b] Buscher, D. F. [1988b] MNRAS 235, 1203.
- Chiavassa et al. [2010] Chiavassa, A., Haubois, X., Young, J., Plez, B., Josselin, E., Perrin, G. & Freytag, B. [2010] A&A 515, 12.
- Creech-Eakman et al. [2010] Creech-Eakman, M., Young, J., Haniff, C., Buscher, D., Elvis, M., Chiavassa, A. & Schartmann, M. [2010] Proc. SPIE 7734, 106.
- Dullemond et al. [2001] Dullemond, C. P., Dominik, C. & Natta, A. [2001] ApJ 560, 957.
- Eisner et al. [2007] Eisner, J. A., Chiang, E. I., Lane, B. F. & Akeson, R. L. [2007] ApJ 657, 347.
- Espaillat et al. [2008] Espaillat, C., Calvet, N., Luhman, K. L., Muzerolle, J. & D’Alessio, P. [2008] ApJ 682, L125.
- Farris et al. [2010] Farris, A., Klinglesmith, D., Seamons, J., Torres, N., Buscher, D. & Young, J. [2010] “Software architecture of the Magdalena Ridge Observatory Interferometer,” Proc. SPIE, 10.1117/12.856497.
- Finger et al. [2012] Finger, G., Baker, I., Alvarez, D., Ives, D., Mehrgan, L., Meyer, M., Stegmeier, J., Thorne, P. & Weller, H. J. [2012] , 84530T10.1117/12.926288.
- Fisher et al. [2010] Fisher, M., Boysen, R. C., Buscher, D. F., Haniff, C. A., Seneta, E. B., Sun, X., Wilson, D. M. A. & Young, J. S. [2010] “Design of the MROI delay line optical path compensator,” Proc. SPIE, 10.1117/12.857168.
- Gallenne et al. [2013] Gallenne, A., Monnier, J. D., Mérand, A., Kervella, P., Kraus, S., Schaefer, G. H., Gieren, W., Pietrzyński, G., Szabados, L., Che, X., Baron, F., Pedretti, E., McAlister, H., ten Brummelaar, T., Sturmann, J., Sturmann, L., Turner, N., Farrington, C. & Vargas, N. [2013] Astronomy and Astrophysics 552, 21, 10.1051/0004-6361/201321091;.
- Hardy [1998] Hardy, J. W. [1998] Adaptive optics for astronomical telescopes (Oxford University Press, USA).
- Hobson & Baldwin [2004] Hobson, M. P. & Baldwin, J. E. [2004] Applied Optics 43, 2651, 10.1364/AO.43.002651.
- Honig et al. [2006] Honig, S. F., Beckert, T., Ohnaka, K. & Weigelt, G. [2006] Astronomy and Astrophysics 452, 459, 10.1051/0004-6361:20054622;.
- Honig et al. [2012] Honig, S. F., Kishimoto, M., Antonucci, R., Marconi, A., Prieto, M., Tristam, K. & Weigelt, G. [2012] ApJ 755, L149.
- Horton et al. [2001] Horton, A. J., Buscher, D. F. & Haniff, C. A. [2001] MNRAS 327, 217.
- Hummel et al. [2013] Hummel, C. A., Rivinius, T., Nieva, M.-F., Stahl, O., van Belle, G. & Zavala, R. T. [2013] Astronomy and Astrophysics 554, 52, 10.1051/0004-6361/201321434;.
- Isella & Natta [2005] Isella, A. & Natta, A. [2005] A&A 527, 121.
- Jurgenson et al. [2008] Jurgenson, C. A., Santoro, F. G., Baron, F., McCord, K., Block, E. K., Buscher, D. F., Haniff, C. A., Young, J. S., Coleman, T. A. & Creech-Eakman, M. J. [2008] “Fringe tracking at the MROI,” Proc. SPIE, 10.1117/12.788223.
- Kishimoto et al. [2011] Kishimoto, M., Honig, S., Antonucci, R., Barvanis, R., Kotani, T., Tristam, K., Weigelt, G. & Levin, K. [2011] A&A 527, 121.
- Kloppenborg et al. [2010] Kloppenborg, B., Stencel, R., Monnier, J. D., Schaefer, G., Zhao, M., Baron, F., McAlister, H., ten Brummelaar, T., Che, X., Farrington, C., Pedretti, E., Sallave-Goldfinger, P. J., Sturmann, J., Sturmann, L., Thureau, N., Turner, N. & Carroll, S. M. [2010] Nature 464, 870, 10.1038/nature08968.
- Klotz et al. [2013] Klotz, D., Paladini, C., Hron, J., Aringer, B., Sacuto, S., Marigo, P. & Verhoelst, T. [2013] Astronomy and Astrophysics 550, 86, 10.1051/0004-6361/201220444;.
- Konopacky et al. [2007a] Konopacky, Q. M., Ghez, A. M., Duchêne, G., McCabe, C. & Macintosh, B. A. [2007a] AJ 133, 2008.
- Konopacky et al. [2007b] Konopacky, Q. M., Ghez, A. M., Rice, E. L. & Duchêne, G. [2007b] ApJ 663, 394.
- Kreplin et al. [2013] Kreplin, A., Weigelt, G., Kraus, S., Grinin, V., Hofmann, K.-H., Kishimoto, M., Schertl, D., Tambovtseva, L., Clausse, J.-M., Massi, F., Perraut, K. & Stee, P. [2013] Astronomy and Astrophysics 551, 21, 10.1051/0004-6361/201220806.
- Li Causi et al. [2013] Li Causi, G., Antoniucci, S., Bono, G., Pedicelli, S., Lorenzetti, D., Giannini, T. & Nisini, B. [2013] Astronomy and Astrophysics 549, 64, 10.1051/0004-6361/201220207;.
- Liske et al. [2011] Liske, J., Ardeberg, A., Battaglia, G., Bergeron, J., Calamida, A., Cimatti, A., Cappellari, M., Comerón, F., Dumusque, X., Feltzing, S., Franx, M., Francois, P., Freudling, W., Gladysz, S., Gratton, R., Haehnelt, M., Hill, V., Hook, I., James, G., Kaeufl, H.-U., Kissler-Patig, M., ̵̧, A. K. Y., Lehnert, M., Leibundgut, B., Lovis, C., McCaughrean, M., Naef, D., Nonino, M., Pasquini, L., Puech, M., Queloz, D., Rebolo, R., Rodriguez Espinosa, J., Rosati, P., Toft, S., Tolstoy, E., Udry, S., Venemans, B., Villegas, D. & Zinnecker, H. [2011] “E-elt design reference mission,” Tech. Rep. E-TRE-ESO-080-0717 Issue 2, ESO.
- Mahajan [1983] Mahajan, V. N. [1983] Journal of the Optical Society of America 73, 860, 10.1364/JOSA.73.000860.
- Malbet et al. [2005] Malbet, F., Lachaume, R., Berger, J.-P., Colavita, M. M., di Folco, E., Eisner, J. A., Lane, B. F., Millan-Gabet, R., Ségransan, D. & Traub, W. A. [2005] A&A 437, 627.
- Meisenheimer et al. [2007] Meisenheimer, K., Tristram, K. R. W., Jaffe, W., Israel, F., Neumayer, N., Raban, D. & Röttgering, H. [2007] A&A 471, 453.
- Millan-Gabet et al. [2007] Millan-Gabet, R., Malbet, F., Akeson, R., Leinert, C., Monnier, J. & Waters, R. [2007] “The circumstellar environments of young stars at au scales,” Protostars and Planets V (Space Sciences Series, University of Arizona Press), p. 539.
- Millan-Gabet et al. [2006] Millan-Gabet, R., Monnier, J. D., Berger, J.-P., Traub, W. A., Schloerb, F. P., Pedretti, E., Benisty, M., Carleton, N. P., Haguenauer, P., Kern, P., Labeye, P., Lacasse, M. G., Malbet, F., Perraut, K., Pearlman, M. & Thureau, N. [2006] The Astrophysical Journal Letters 645, L77, 10.1086/506153.
- Millour et al. [2011] Millour, F., Meilland, A., Chesneau, O., Stee, P., Kanaan, S., Petrov, R., Mourard, D. & Kraus, S. [2011] Astronomy & Astrophysics 526, A107, 10.1051/0004-6361/201016193.
- Pauls et al. [1998] Pauls, T. A., Mozurkewich, D., Hajian, A. R. & Armstrong, J. T. [1998] Proc. SPIE , 46110.1117/12.317111.
- Porro et al. [1999] Porro, I. L., Traub, W. A. & Carleton, N. P. [1999] Appl. Optics 38, 6055.
- Puech & Gitton [2005] Puech, F. & Gitton, P. [2005] “Interface control document between VLTI and its instruments,” Tech. Rep. VLT-ICD-ESO-15000-1826, European Southern Observatory.
- Raban et al. [2009] Raban, D., Jaffe, W., Röttgering, H. & Tristram, K. M. K. R. W. [2009] MNRAS 394, 1325.
- Sana et al. [2013] Sana, H., Le Bouquin, J.-B., Mahy, L., Absil, O., De Becker, M. & Gosset, E. [2013] Astronomy and Astrophysics 553, 131, 10.1051/0004-6361/201321189;.
- Shtromberg et al. [2010] Shtromberg, A. V., Jurgenson, C. A., McCord, K. M., Olivares, A. M., Bloemhard, H. N., Santoro, F. G., Buscher, D. F., Haniff, C. A., Young, J. S., Torres, N. C. & Farris, A. R. [2010] “Magdalena Ridge Observatory Interferometer automated alignment system,” Proc. SPIE, 10.1117/12.857369.
- Tristram et al. [2007] Tristram, K. R. W., Meisenheimer, K., Jaffe, W., Schartmann, M., Rix, H.-W., Leinert, C. & Morel, S. [2007] A&A 474, 837.
- Tristram et al. [2009] Tristram, K. R. W., Raban, D., Meisenheimer, Jaffe, K., W., Rottgering, H., Burtscher, L., Cotton, W., Graser, U., Henning, T., Leinert, C., Lopez, B., Morel, S., Perrin, G. & Wittkowski, M. [2009] A&A 502, 67.
- Tuthill et al. [2008] Tuthill, P., Monnier, J., Lawrence, N., Danchi, S., W. Owocki & Gayley, K. [2008] ApJ 675, 698.
- van Belle [2012] van Belle, G. V. [2012] Ann. Rev. A & A 20, 51.
- Wilson & Jenkins [1996] Wilson, R. W. & Jenkins, C. R. [1996] Monthly Notices of the Royal Astronomical Society 278, 39, 10.1093/mnras/278.1.39.
- Young et al. [2012] Young, J., Buscher, D., Haniff, C., Fisher, M., Seneta, E. B., Rea, A., Wilson, D., Farris, A., Selina, R., Sun, X. & Olivares, A. [2012] Proc. SPIE , 84451V10.1117/12.926316.
- Zhao et al. [2008] Zhao, M., Geis, D., Monnier, J., Thureau, N., Pedretti, E., Baron, F. & coauthors, . [2008] ApJ 684, 95.