11email: sofia@astro.lu.se 22institutetext: University of Utah Department of Physics and Astronomy, Salt Lake City, UT 84112
22email: jennifer@physics.utah.edu 33institutetext: European Southern Observatory, Karl-Schwarzschild Str. 2, 85748 Garching b. München, Germany
33email: fprimas@eso.org
A study of the metal-rich, thick disk globular cluster NGC 5927 ††thanks: Based on observations collected at the European Southern Observatory, Chile, ESO, Programme ID 079.B-0721(A)
We present a list of 72 radial velocity member stars in the metal-rich globular cluster NGC 5927. The radial velocities are based on multi-epoch, multi-fibre spectra. We identify 46 RGB/HB stars and 26 turn-off stars that are radial velocity members in the cluster. This cluster is situated quite close to the disk and hence fore- and/or background contamination, especially in the outskirts of the cluster, can be quite severe. Fortunately, the cluster has a radial velocity (we determine it to vr=–104.035.03 km s-1) that sets it clearly apart from the bulk velocities of the surrounding, background, and foreground stellar populations. Hence, our identification of members is clean and we can quantify a 50% contamination when stars in the outer part of the cluster are selected solely based on position in the colour-magnitude diagram as opposed to selections based on radial velocities.
Key Words.:
Globular clusters: individual: NGC 5927, Stars: kinematics and dynamics1 Introduction
It has long been recognized that the globular cluster system in the Milky Way contains at least two distinct groups: a metal-poor system and a metal-rich system (Zinn, 1985). While some individual clusters might be accreted from satellite systems, metal-poor clusters are typically associated with the halo (Bica et al., 2006; Law & Majewski, 2010). The metal-rich sub-system is strongly concentrated around and therefore typically associated with the Galactic bulge (Bica et al., 2006). Additional structure in the metal rich-system was originally proposed by Armandroff (1989), who suggested that these clusters were kinematically associated with the stellar thick disk. Proper motion studies confirm Bulge membership for some metal-rich clusters for which orbits can be derived (Dinescu et al., 1999a, b, 2003; Casetti-Dinescu et al., 2007, 2010). However, a few clusters may still be associated with the thick disk. One of the best thick disk candidate clusters is NGC 5927 (Casetti-Dinescu et al., 2007).
No detailed spectroscopic abundance analysis of NGC 5927 has been published in the last 20 years despite evidence that the overall metallicity of the cluster is poorly constrained. Based on Ca ii IR triplet measurements by Rutledge et al. (1997a), three different calibrations yield varying results: –0.34 dex (Zinn-scale), –0.64 dex (Carretta & Gratton -scale), and –0.67 dex (Kraft & Ivans, 2003). Thomas et al. (2003) used Lick indices to derive [Fe/H] = –0.210.11.
At contamination from the background (Bulge) population is of small concern and the foreground contamination is expected to be moderate (but as we shall see it is still significant). This property has made NGC 5927 a popular empirical fiducial cluster in studies of extra-galactic resolved stellar populations and it is often used as a template for colour-magnitude diagrams, integrated colours, and spectra of metal-rich, single age stellar populations. Recent examples include Brown et al. (2004, 2005) Bedin et al. (2005), and Santos & Piatti (2004).
For these reasons it is interesting to provide a clean sample of members of the cluster that can be used for further detailed studies, e.g., as targets for high-resolution spectroscopic studies. In this paper we present a VLT-FLAMES observation of a large number of stars in this cluster and derive the radial velocities of the stars as well as the systemic velocity of the cluster.
2 Selection of targets
| Star | 2MASS ID | R.A. | Dec. | vHelio | ||||||
|---|---|---|---|---|---|---|---|---|---|---|
| (fibre) | (fibre) | [km s-1] | [km s-1] | |||||||
| NGC 5927-01 | 15275603-5041223 | 15 27 56.16 | –50 41 22.20 | –102.01 | 0.37 | 16.02 | 15.83 | 13.355 | 12.619 | 12.565 |
| NGC 5927-02 | 15 27 56.88 | –50 40 28.20 | –94.39 | 0.19 | 16.12 | 15.94 | ||||
| NGC 5927-03 | 15275764-5039423 | 15 27 57.60 | –50 39 42.12 | –101.05 | 0.36 | 16.16 | 15.98 | 13.707 | 13.021 | 12.891 |
| NGC 5927-04 | 15280273-5039163 | 15 28 02.64 | –50 39 16.20 | –105.61 | 0.52 | 16.03 | 15.88 | 12.282 | 12.129 | |
| NGC 5927-05 | 15280546-5040214 | 15 28 05.52 | –50 40 21.72 | –105.37 | 0.46 | 16.04 | 15.82 | 13.026 | 12.432 | 12.161 |
| NGC 5927-06 | 15280537-5041317 | 15 28 05.28 | –50 41 31.56 | –102.34 | 0.44 | 16.19 | 16.09 | 13.738 | 13.012 | 12.917 |
| NGC 5927-07 | 15 28 09.12 | –50 39 22.32 | –105.84 | 0.56 | 16.08 | 15.88 |
Column one the IDs used by us for the stars while column two gives the 2MASS identification. Columns three and four contain the target fibre coordinates, column five the heliocentric radial velocity, and column six the radial velocity standard deviation as derived in Sect. 4. Columns seven and eight list the in-flight ACS magnitudes (T. Brown priv. com.). The last three columns list the magnitudes from 2MASS.
| Star | R.A. | Dec. | R.V. | ||
| (fibre) | (fibre) | [km s-1] | |||
| TO001 | 15 27 49.25 | –50 41 08.00 | –103.74 | 20.11 | –0.097 |
| TO004 | 15 27 50.70 | –50 39 46.40 | –107.32 | 20.23 | –0.105 |
| TO012 | 15 27 51.21 | –50 40 41.10 | –106.90 | 19.81 | –0.088 |
| TO013 | 15 27 52.64 | –50 39 02.20 | –98.06 | 20.05 | –0.101 |
| TO014 | 15 27 51.24 | –50 41 13.50 | –99.88 | 20.24 | –0.092 |
| TO015 | 15 27 52.31 | –50 39 43.10 | –96.88 | 19.80 | –0.048 |
| TO016 | 15 27 51.12 | –50 41 48.70 | –118.28 | 20.16 | –0.109 |
| TO021 | 15 27 53.81 | –50 39 44.20 | –111.05 | 19.97 | –0.104 |
| TO022 | 15 27 54.42 | –50 38 57.60 | –102.84 | 19.89 | –0.060 |
| TO033 | 15 27 53.58 | –50 41 13.30 | –110.28 | 20.04 | –0.097 |
| TO036 | 15 27 54.61 | –50 40 46.50 | –105.18 | 19.99 | –0.148 |
| TO037 | 15 27 53.72 | –50 42 05.10 | –99.15 | 19.85 | –0.025 |
| TO051 | 15 27 59.47 | –50 41 40.70 | –105.33 | ||
| TO052 | 15 28 1.45 | –50 39 27.30 | –102.29 | 20.04 | –0.090 |
| TO054 | 15 28 0.52 | –50 41 49.00 | –105.52 | 20.05 | –0.068 |
| TO056 | 15 28 2.62 | –50 39 33.50 | –110.10 | 20.09 | –0.101 |
| TO064 | 15 28 5.51 | –50 39 25.70 | –99.61 | 19.88 | –0.091 |
| TO070 | 15 28 6.40 | –50 39 34.60 | –104.23 | 20.00 | –0.047 |
| TO083 | 15 28 6.97 | –50 41 50.20 | –106.09 | 20.15 | –0.088 |
| TO084 | 15 28 7.43 | –50 41 32.50 | –105.61 | 20.07 | –0.053 |
| TO086 | 15 28 7.93 | –50 41 10.50 | –103.21 | 19.97 | –0.092 |
| TO088 | 15 28 7.43 | –50 42 24.90 | –93.08 | 20.14 | –0.085 |
| TO090 | 15 28 9.62 | –50 40 30.50 | –103.40 | 20.26 | –0.115 |
| TO101 | 15 28 10.67 | –50 40 10.00 | –107.09 | 19.80 | –0.071 |
| TO103 | 15 28 11.03 | –50 39 55.70 | –108.89 | 20.08 | –0.122 |
| TO106 | 15 28 11.14 | –50 40 22.60 | –95.77 | 19.95 | –0.089 |
| TO020 | 15 27 53.96 | –50 39 24.90 | 13.82 | 19.74 | –0.028 |
| TO042 | 15 27 55.43 | –50 42 8.20 | 15.37 | 20.09 | –0.073 |
| TO058 | 15 28 1.78 | –50 41 56.60 | 9.71 | 19.86 | –0.044 |
| TO078 | 15 28 6.25 | –50 42 6.80 | 32.98 | 20.18 | –0.117 |
Fibre coordinates are given in columns two and three. Column four
contains the heliocentric radial velocity derived from the combined spectrum (see Sect. 4).
The last columns contain the in-flight ACS magnitudes (T. Brown priv. com.).
The first 26 lines contain the stars with a
radial velocity that makes them likely members of NGC 5927. The last four
entries are the stars that fall more than 3 outside the
mean cluster radial velocity.
Star T051 has no detection in the Brown photometry within 1.5 arcsec. There are
two sources within 1.7 arcseconds. We cannot unambiguously associate colors from
Brown et al. (2005) with our target source.
| Cluster members | Cluster non-members | ||||||||||||
|---|---|---|---|---|---|---|---|---|---|---|---|---|---|
| Star | 2MASS ID | R.A. | Dec | Star | 2MASS ID | R.A. | Dec | ||||||
| M003 | 15280206-5039020 | 15 28 2.06 | -50 39 2.00 | 14.08 | 13.39 | 13.3 | M130 | 15274240-5039396 | 15 27 42.40 | -50 39 39.60 | 14.21 | 13.61 | 13.38 |
| M012 | 15275697-5042051 | 15 27 56.97 | -50 42 5.10 | 13.88 | 13.17 | 13.08 | M138 | 15274271-5039153 | 15 27 42.71 | -50 39 15.30 | 13.81 | 13.06 | 12.98 |
| M061 | 15280140-5038244 | 15 28 1.40 | -50 38 24.40 | 14.1 | 13.43 | 13.27 | M171 | 15281652-5043230 | 15 28 16.52 | -50 43 23.00 | 14.25 | 13.52 | 13.38 |
| M098 | 15280608-5043008 | 15 28 6.08 | -50 43 0.80 | 14.17 | 13.56 | 13.36 | M211 | 15282906-5040257 | 15 28 29.06 | -50 40 25.70 | 13.99 | 13.31 | 13.16 |
| M111 | 15280900-5038085 | 15 28 9.00 | -50 38 8.50 | 14.36 | 13.6 | 13.51 | M213 | 15275781-5036016 | 15 27 57.81 | -50 36 1.60 | 13.6 | 12.86 | 12.72 |
| M115 | 15281754-5041246 | 15 28 17.54 | -50 41 24.60 | 14.23 | 13.53 | 13.35 | M222 | 15274775-5044550 | 15 27 47.74 | -50 44 55.00 | 14.4 | 13.7 | 13.53 |
| M120 | 15281471-5038457 | 15 28 14.71 | -50 38 45.70 | 13.95 | 13.27 | 13.19 | M227 | 15282965-5042205 | 15 28 29.65 | -50 42 20.50 | 14.06 | 13.48 | 13.24 |
| M126 | 15280789-5037501 | 15 28 7.89 | -50 37 50.10 | 13.97 | 13.33 | 13.19 | M232 | 15281484-5036067 | 15 28 14.84 | -50 36 6.70 | 14.27 | 13.62 | 13.49 |
| M151 | 15275290-5043446 | 15 27 52.90 | -50 43 44.60 | 14.16 | 13.4 | 13.29 | M238 | 15283233-5039196 | 15 28 32.33 | -50 39 19.60 | 14.1 | 13.53 | 13.44 |
| M152 | 15281401-5043171 | 15 28 14.02 | -50 43 17.10 | 14.1 | 13.47 | 13.3 | M240 | 15275299-5035315 | 15 27 52.99 | -50 35 31.50 | 13.67 | 12.96 | 12.9 |
| M160 | 15275246-5037111 | 15 27 52.46 | -50 37 11.10 | 14.09 | 13.49 | 13.39 | M250 | 15275112-5035252 | 15 27 51.13 | -50 35 25.20 | 13.84 | 13.21 | 13.14 |
| M193 | 15281966-5037402 | 15 28 19.67 | -50 37 40.20 | 13.73 | 13.15 | 12.95 | M253 | 15273924-5044470 | 15 27 39.24 | -50 44 47.00 | 14.01 | 13.41 | 13.33 |
| M199 | 15273464-5039364 | 15 27 34.64 | -50 39 36.40 | 13.96 | 13.36 | 13.25 | M256 | 15283486-5039461 | 15 28 34.86 | -50 39 46.10 | 14.11 | 13.4 | 13.26 |
| M204 | 15282525-5038375 | 15 28 25.25 | -50 38 37.50 | 14.13 | 13.46 | 13.42 | M264 | 15273567-5044373 | 15 27 35.67 | -50 44 37.30 | 13.72 | 12.97 | 12.83 |
| M228 | 15274983-5045114 | 15 27 49.82 | -50 45 11.40 | 14.19 | 13.5 | 13.41 | M276 | 15275546-5034378 | 15 27 55.47 | -50 34 37.80 | 14.39 | 13.64 | 13.65 |
| M230 | 15280455-5035385 | 15 28 4.55 | -50 35 38.50 | 14.32 | 13.54 | 13.48 | M285 | 15272593-5037513 | 15 27 25.93 | -50 37 51.30 | 13.99 | 13.33 | 13.22 |
| M235 | 15281153-5045171 | 15 28 11.53 | -50 45 17.10 | 13.86 | 13.22 | 13.04 | M291 | 15283744-5043066 | 15 28 37.44 | -50 43 6.60 | 13.83 | 13.2 | 13.14 |
| M244 | 15273214-5043148 | 15 27 32.14 | -50 43 14.80 | 14.17 | 13.51 | 13.45 | M295 | 15283057-5036006 | 15 28 30.57 | -50 36 0.60 | 13.68 | 12.99 | 12.87 |
| M248 | 15283429-5040506 | 15 28 34.29 | -50 40 50.60 | 14.14 | 13.45 | 13.29 | M297 | 15274935-5046549 | 15 27 49.35 | -50 46 54.90 | 13.84 | 13.19 | 13.01 |
| M252 | 15282894-5037295 | 15 28 28.94 | -50 37 29.50 | 13.86 | 13.21 | 13.03 | M303 | 15275659-5033401 | 15 27 56.58 | -50 33 40.10 | 13.78 | 13.18 | 13.05 |
| M255 | 15283059-5043177 | 15 28 30.59 | -50 43 17.70 | 14.36 | 13.64 | 13.62 | M304 | 15281049-5047189 | 15 28 10.50 | -50 47 18.90 | 13.99 | 13.25 | 13.11 |
| M258 | 15272726-5039069 | 15 27 27.26 | -50 39 6.90 | 13.89 | 13.29 | 13.12 | M320 | 15275396-5033273 | 15 27 53.96 | -50 33 27.30 | 14.4 | 13.72 | 13.53 |
| M260 | 15282799-5037075 | 15 28 27.99 | -50 37 7.50 | 14.11 | 13.47 | 13.4 | M321 | 15284225-5043270 | 15 28 42.25 | -50 43 27.00 | 14.17 | 13.54 | 13.48 |
| M263 | 15274309-5045256 | 15 27 43.09 | -50 45 25.60 | 13.98 | 13.3 | 13.16 | M322 | 15273763-5034221 | 15 27 37.63 | -50 34 22.10 | 13.96 | 13.28 | 13.1 |
| M267 | 15275749-5034515 | 15 27 57.49 | -50 34 51.50 | 13.99 | 13.36 | 13.23 | M323 | 15271949-5037310 | 15 27 19.49 | -50 37 31.10 | 13.89 | 13.18 | 13.07 |
| M270 | 15272780-5043096 | 15 27 27.80 | -50 43 9.60 | 14.11 | 13.44 | 13.34 | M327 | 15284176-5043473 | 15 28 41.76 | -50 43 47.30 | 14.36 | 13.76 | 13.7 |
| M273 | 15283082-5037019 | 15 28 30.82 | -50 37 1.90 | 14.04 | 13.44 | 13.29 | M328 | 15282266-5046563 | 15 28 22.66 | -50 46 56.30 | 14.22 | 13.5 | 13.38 |
| M284 | 15272199-5040260 | 15 27 21.99 | -50 40 26.00 | 14.01 | 13.36 | 13.28 | M330 | 15284533-5038336 | 15 28 45.34 | -50 38 33.60 | 13.87 | 13.23 | 13.02 |
| M299 | 15284050-5042394 | 15 28 40.50 | -50 42 39.40 | 14.12 | 13.45 | 13.34 | M333 | 15284603-5038547 | 15 28 46.03 | -50 38 54.70 | 14.16 | 13.51 | 13.38 |
| M300 | 15272430-5037136 | 15 27 24.30 | -50 37 13.60 | 13.79 | 13.22 | 13.11 | M335 | 15275184-5033162 | 15 27 51.84 | -50 33 16.20 | 13.89 | 13.28 | 13.19 |
| M305 | 15284385-5039233 | 15 28 43.85 | -50 39 23.30 | 13.96 | 13.24 | 13.09 | M341 | 15271362-5039331 | 15 27 13.62 | -50 39 33.10 | 14.22 | 13.57 | 13.49 |
| M308 | 15271847-5042403 | 15 27 18.48 | -50 42 40.30 | 13.98 | 13.33 | 13.18 | M349 | 15280909-5032594 | 15 28 9.09 | -50 32 59.40 | 14.36 | 13.78 | 13.54 |
| M319 | 15282577-5046327 | 15 28 25.77 | -50 46 32.70 | 14.11 | 13.42 | 13.3 | M356 | 15271166-5041490 | 15 27 11.66 | -50 41 49.10 | 13.73 | 12.98 | 12.85 |
| M326 | 15284338-5043099 | 15 28 43.38 | -50 43 9.90 | 13.7 | 13.13 | 13.05 | M360 | 15274912-5048166 | 15 27 49.12 | -50 48 16.60 | 14.25 | 13.56 | 13.4 |
| M339 | 15281136-5033166 | 15 28 11.36 | -50 33 16.60 | 13.97 | 13.38 | 13.23 | M362 | 15284867-5038134 | 15 28 48.67 | -50 38 13.40 | 14.22 | 13.54 | 13.38 |
| M342 | 15273444-5046503 | 15 27 34.44 | -50 46 50.30 | 14.4 | 13.74 | 13.59 | M383 | 15271519-5037093 | 15 27 15.19 | -50 37 9.30 | 13.82 | 13.15 | 13.02 |
| M351 | 15271434-5038173 | 15 27 14.34 | -50 38 17.30 | 13.89 | 13.26 | 13.05 | |||||||
| M354 | 15271189-5040378 | 15 27 11.89 | -50 40 37.80 | 13.7 | 13.02 | 12.9 | |||||||
| M357 | 15284217-5036124 | 15 28 42.17 | -50 36 12.40 | 14.07 | 13.41 | 13.33 | |||||||
Columns two and nine are the 2MASS identifications for target RGB stars. Columns three, four, ten and eleven give the R.A. and Dec. of the GIRAFFE fibre used to observe the star. The final columns are the 2MASS magnitudes.
The selection of targets in NGC 5927 was done for three different types of stars: horizontal branch (HB) stars, red giant branch (RGB) stars, and turn-off (TO) stars. Seven bright HB and RGB stars were observed at high resolution (R) and will be referred to as HB/RGB-UVES. The remaining RGB targets were observed at lower resolution (R) and will be referred to as RGB-GIRAFFE. Target selection was based on photometric color cuts and designed to maximize the number of fibres allocated to stars.
HB and RGB stars for high resolution fibres (HB/RGB-UVES)
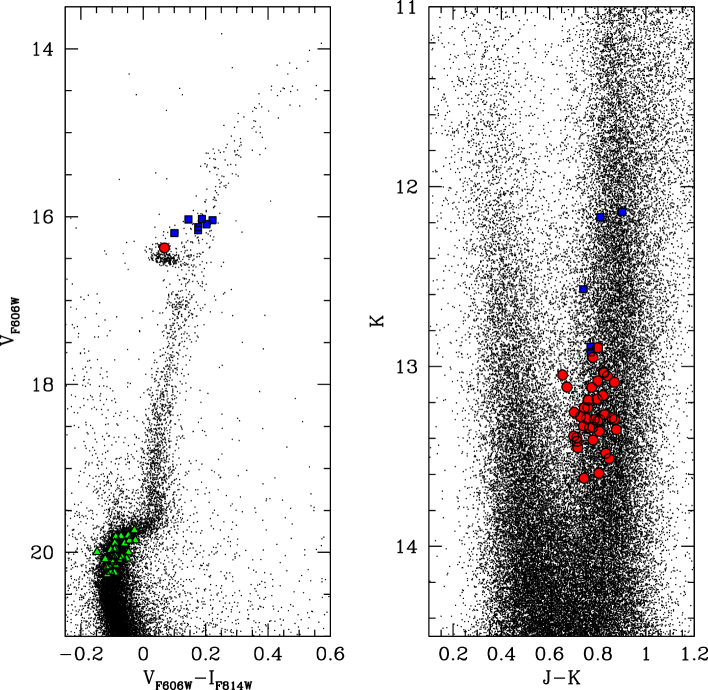
were selected using a colour-magnitude diagram (CMD) based on observations with the Advanced Camera for Surveys (ACS) on-board Hubble. The selection of HB/RGB-UVES stars was straightforward. The ACS CMD allowed us to select targets in the crowded core of the cluster, increasing our chances of observing cluster members (compare Fig. 2). 111At the time of selection this photometry was unpublished. Later a refereed publication of this data was published in (Brown et al., 2005). T. Brown has kindly provided us with both the calibrated ACS photometry and his astrometric solution. Our target cross-match was done in RA and Dec. We found target matches for every star on the HB/RGB.
The final list of HB/RGB-UVES targets is given in Table 1. These targets are bright enough to have 2MASS NIR photometry (Skrutskie et al., 2006). magnitudes are included in the table if their respective quality flag is at least “B”. NGC 5927-02 and -07 have no reliable 2MASS photometry and NGC 5927-05 and NGC 5927-06 have contamination flagged for its magnitudes.
TO stars
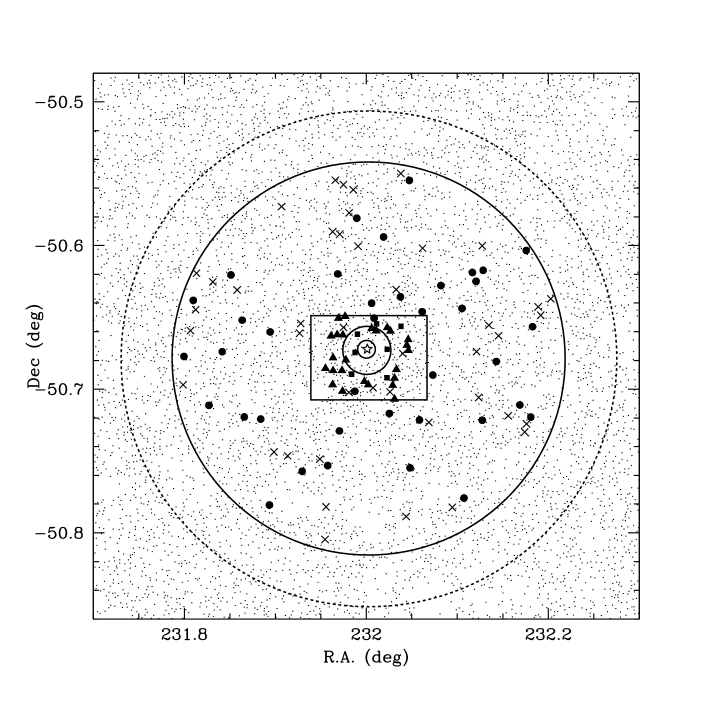
were selected from the same ACS CMD as the HB/RGB-UVES stars. A small box was placed around the TO in the CMD. In total 30 suitable TO star were selected. These are listed in Table 2 and their positions in the CMD are shown in Fig. 1. 222We also cross-matched these stars with the final photometry and astrometry from T.Brown and found that all stars apart from T051 have a unique match.
RGB stars for low-resolution fibres (RGB-GIRAFFE)
were selected from a CMD based on 2MASS photometry (Skrutskie et al., 2006). These targets were selected to be further from the core of the cluster in order facilitate the positioning of the fibres, but also to probe the cluster properties to larger radii. The stars were selected to roughly match the magnitudes of the HB/RGB-UVES stars with (compare CMD in Fig. 2). In total 75 RGB-GIRAFFE candidate stars were selected and observed. They are listed in Table 3 along with the associated fibre coordinate, the 2MASS identification, and the magnitudes.
The position of all targets on the sky is shown in Fig. 1. Since our targets are drawn from two different photometric sources, our fibre coordinate system represents a compromise between two astrometric systems. For the sake of presenting a single internally consistent coordinate system and aiding future cross-identification, we list the R.A. and Dec. for the fibre positions in Tables 1,2, and 3 rather than the astrometry used in the selection. Fibre coordinates are within 0.5′′ of the ACS coordinates (Brown et al., 2005) and within 0.13′′ (RGB-GIRAFFE targets) or 1.0′′ (HB/RGB-UVES targets) of the 2MASS coordinates.
3 Observations and data reduction
| Observing | Date | UT | JD | Exp-time | Average | Airmass | Helio-centric |
|---|---|---|---|---|---|---|---|
| Block | [s] | seeing | correction | ||||
| during obs. | [km s-1] | ||||||
| [”] | |||||||
| 281555 | 2007 05 12 | 02:48:23.543 | 2454232.62184 | 3600 | 1.160.45 | 1.22 | 5.74 |
| 281556 | 2007 05 12 | 05:43:13.406 | 2454232.74325 | 3600 | 1.270.60 | 1.13 | 5.49 |
| 281557 | 2007 05 12 | 06:50:11.231 | 2454232.78976 | 3600 | 1.230.54 | 1.22 | 5.39 |
| 281558 | 2007 05 12 | 07:52:11.744 | 2454232.83282 | 3600 | 1.240.58 | 1.37 | 5.32 |
| 281559 | 2007 05 13 | 01:32:58.649 | 2454233.56949 | 3600 | 0.920.01 | 1.42 | 5.40 |
| 281560 | 2007 05 15 | 00:05:47.728 | 2454235.50897 | 3600 | 0.590.01 | 1.88 | 4.62 |
| 281561 | 2007 05 15 | 01:11:22.661 | 2454235.55452 | 3600 | 0.420.01 | 1.48 | 4.56 |
| 281562 | 2007 05 17 | 02:03:43.510 | 2454237.59090 | 3600 | 0.860.01 | 1.28 | 3.64 |
| 281563 | 2007 05 20 | 00:49:43.705 | 2454240.53954 | 3600 | 1.150.44 | 1.49 | 2.42 |
| 281564 | 2007 05 22 | 02:53:50.236 | 2454242.62574 | 3600 | 1.470.87 | 1.16 | 1.40 |
| 281565 | 2007 05 22 | 03:58:41.221 | 2454242.67077 | 3600 | 1.540.93 | 1.11 | 1.30 |
| 281566 | 2007 06 17 | 05:09:48.056 | 2454268.71979 | 3600 | 1.240.57 | 1.31 | –9.77 |
| 281567 | 2007 06 22 | 00:38:31.127 | 2454273.53123 | 3600 | 2.131.62 | 1.17 | –11.36 |
| 281568 | 2007 06 22 | 01:45:56.216 | 2454273.57805 | 3600 | 1.581.00 | 1.12 | –11.45 |
| 281569 | 2007 06 22 | 02:52:30.930 | 2454273.62428 | 3600 | 1.260.59 | 1.13 | –11.55 |
| 281570 | 2007 06 22 | 04:04:06.944 | 2454273.67400 | 3600 | 1.240.56 | 1.21 | –11.64 |
| 281574 | 2007 07 19 | 00:37:24.431 | 2454300.52901 | 3600 | 0.720.01 | 1.11 | –20.20 |
| 281573 | 2007 07 20 | 00:40:29.476 | 2454301.53108 | 3600 | 1.360.74 | 1.12 | –20.46 |
| 281572 | 2007 07 20 | 01:42:01.361 | 2454301.57381 | 3600 | 0.890.01 | 1.16 | –20.54 |
| 281571 | 2007 07 22 | 00:48:44.083 | 2454303.53667 | 3600 | 1.240.56 | 1.12 | –20.97 |
Column one lists the name of the observing block, column two the date the observations were taken, columns three and four give the starting time of the observation (in UT) and the Julian date, column five lists the exposure time, column six the average seeing during the observation including a and column seven the airmass at which the observations were carried out. The last column lists the helio-centric corrections derived in this work and applied when combining spectra form each of the 20 OBs into one single spectrum.
For the seven high-resolution (R40,000) fibres allocated to HB/RGB-UVES targets we used the setting centered at 580 nm which covers the spectrum between 480.0 nm and 682.0 nm with a gap between 577.5 and 582.5 nm (CCD#3, filter SHP700, red arm only). For the 105 (R20,000) Medusa fibres, we selected the grating setting HR13. HR13 (612.0 – 640.5 nm) includes several astrophysically interesting elements (e.g. O, Na, and Ba) and still provides adequate throughput for the fainter TO stars.
Due to the crowding in the central part of the cluster, good seeing was imperative and therefore the observations were carried out in service mode using the FLAMES spectrograph (Pasquini et al., 2002) mounted on UT2 on Paranal. The seeing requirement was set to 1.2 for the service mode observations to minimize the loss of light due to finite fibre size and at the same time maximize the amount of useful observing time available. The explicit aim was, for each observing block (OB), to achieve S/N=11 @630nm for HB/RGB-UVES stars, S/N=4 @620nm for TO stars, and S/N=25 for HB-GIRAFFE stars. Each OB was observed for 3600 s. In total we observed 20 OBs. Observations were carried out in service mode during May and July 2007. The observing conditions for each OB are listed in Table 4. The estimated S/N were achieved.
Initially, the data were reduced as part of the ESO service mode operations using the GIRAFFE pipeline version 1.0 333See http://www.eso.org/sci/software/pipelines/ for a listing of the GIRAFFE pipeline versions.. Upon inspection it soon became clear that what is known as the “CCD glow” was a serious problem for our spectra. This glow shows itself in the form of a higher background in one corner of the CCD. In particular it affects fibres with higher numbers. It was thus necessary to undertake a re-reduction of the data. This was done using the -version of the GIRAFFE pipeline version 2.3, released specifically to deal with the CCD glow.
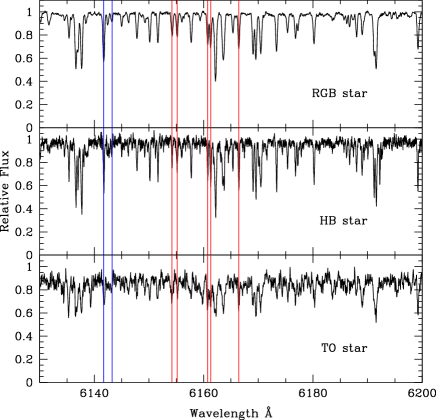
Before combining the spectra from the 20 OBs into a final spectrum with increased S/N the necessary helio-centric corrections, as calculated within iraf444IRAF is distributed by National Optical Astronomy Observatories, operated by the Association of Universities for Research in Astronomy, Inc., under contract with the National Science Foundation, USA. were applied (see Table 4). For a few RGB-GIRAFFE stars some spectra were rejected (see Table 5 and the discussion in Sect. 4.1). In some cases there were also one out of the 20 spectra that was not usable (e.g., due to a slight off-set in the placement of the fibre, resulting in a too low flux). The spectra were combined using the scombine task in IRAF, using a min-max rejection. A few example spectra are shown in Figure 3.
4 Determination of radial velocities
| Cluster members | Cluster non-members | ||||||||
|---|---|---|---|---|---|---|---|---|---|
| Star | R.V. | Comments | Star | R.V. | Comments | ||||
| [km s-1] | [km s-1] | [km s-1] | [km s-1] | ||||||
| M003 | –94.65 | 0.66 | M130 | –4.198 | 3.98 | See Sect 4.1 | |||
| M012 | –98.08 | 0.64 | M138 | +11.24 | 0.89 | ||||
| M061 | –101.4 | 0.88 | M171 | –29.01 | 0.93 | ||||
| M098 | –104.9 | 0.99 | 1 rej | M211 | –82.82 | 0.79 | |||
| M111 | –109.0 | 1.39 | M213 | –51.61 | 0.72 | ||||
| M115 | –101.8 | 0.74 | M222 | –27.92 | 1.08 | ||||
| M120 | –115.6 | 0.72 | M227 | See Sect 4.1 | 13 spectra | ||||
| M126 | –99.52 | 1.32 | 5 spectra | M232 | –30.0 | 0.94 | |||
| M151 | –95.39 | 0.79 | M238 | +70.63 | 3.25 | See Sect 4.1 | |||
| M152 | –109.9 | 0.76 | 18 spectra | M240 | –142.4 | 2.91 | See Sect 4.1 | ||
| M160 | –109.5 | 0.67 | 1 rej | M250 | –54.72 | 0.59 | |||
| M193 | –107.8 | 0.19 | M253 | –72.37 | 0.72 | 19 spectra | |||
| M199 | –102.8 | 0.47 | M256 | –69.14 | 0.73 | 19 spectra | |||
| M204 | –110.0 | 0.80 | 19 spectra | M264 | –76.72 | 0.58 | |||
| M228 | –108.2 | 1.31 | M276 | –85.43 | 1.09 | ||||
| M230 | –106.2 | 0.79 | M285 | –42.35 | 1.13 | ||||
| M235 | –103.4 | 0.95 | M291 | +61.45 | 1.05 | ||||
| M244 | –105.6 | 3.00 | See Sect 4.1 | 19 spectra | M295 | –74.93 | 0.57 | ||
| M248 | –111.5 | 0.60 | M297 | –56.41 | 0.92 | ||||
| M252 | –98.51 | 0.76 | 18 spectra | M303 | –47.3 | 0.77 | |||
| M255 | –104.8 | 1.11 | M304 | +8.44 | 0.69 | ||||
| M258 | –99.11 | 0.63 | M320 | –17.7 | 0.55 | ||||
| M260 | –99.67 | 0.75 | M321 | –138.0 | 0.76 | 1 rej | |||
| M263 | –100.9 | 0.84 | M322 | –49.1 | 2.14 | 18 spectra | |||
| M267 | –101.8 | 1.04 | M323 | –130.6 | 0.66 | 19 spectra | |||
| M270 | –108.6 | 0.84 | M327 | –54.9 | 0.66 | 19 spectra | |||
| M273 | –105.6 | 0.73 | M328 | –45.3 | 1.46 | 17 spectra | |||
| M284 | –106.5 | 1.24 | M330 | –27.1 | 0.59 | 19 spectra | |||
| M299 | –105.8 | 1.01 | M333 | +20.3 | 0.66 | 1 rej | |||
| M300 | –106.1 | 1.18 | 19 spectra | M335 | –65.1 | 0.82 | |||
| M305 | –97.61 | 0.56 | M341 | –36.5 | 1.96 | See Sect 4.1 | |||
| M308 | –110.3 | 0.71 | 19 spectra | M349 | –53.0 | 9.11 | See Sect 4.1 | ||
| M319 | –106.6 | 0.84 | M356 | –20.4 | 0.69 | ||||
| M326 | –107.1 | 1.31 | M360 | –141.6 | 0.28 | ||||
| M339 | –101.8 | 0.89 | 19 spectra | M362 | –8.8 | 0.42 | |||
| M342 | –102.9 | 0.70 | M383 | –61.0 | 0.62 | ||||
| M351 | –106.4 | 0.74 | |||||||
| M354 | –93.3 | 0.92 | |||||||
| M357 | –101.5 | 0.87 | 1 rej | ||||||
The first and fifth columns list the ID for the star. The second and sixth columns give our final radial velocity for the star and the third and seventh column lists the sigma of the 20 individual measurements that the radial velocity is based on. For some stars one spectrum were rejected from the final averaged spectrum. For some stars less than 20 spectra were available (e.g., due to faulty fibres or miss-placements). The number of available spectra is noted in case it less than 20. Stars discussed individually in Sect 4.1 are also indicated.


Radial velocities were derived using the task fxcor in IRAF. The task cross-correlates a template spectrum with the target spectrum and reports the velocity difference between the two. Given the wide range of stellar evolutionary states in the data set, no single template would adequately serve for all the stars. Both the RGB-UVES and RGB-GIRAFFE spectra were matched to the observed high-resolution spectrum of NGC 5927-01 shifted onto a rest wavelength scale. We attempted the same procedure for the TO stars, but the very low S/N in these spectra and the intrinsically greater template spectrum mismatch made this impractical. Instead we synthesized a template spectrum with =6000 K, log g=4.0, and [Fe/H]=0.25.
The radial velocities of the TO targets may be expected to be more uncertain than the other velocities because the synthetic template contains errors and line omissions due to our imperfect knowledge of the atomic parameters of all the lines in this region of the optical spectrum. Also, the synthetic template does not have exactly the same wavelength scale. However, Griffin et al. (2000) indicate that radial velocity errors are greatest when the line broadening in the template spectrum does not match the target spectrum. Griffin et al. (2000) find that radial velocity errors introduced by target-template mismatches are km s-1 or less.
The procedure to measure the mean radial velocity for a given star differs depending on the type of star. For the HB and RGB candidates stars we determine the radial velocities in two ways – first by cross-correlating a template spectrum with the final, combined spectrum for the stars and secondly by measuring the radial velocity for each of the individual 20 OBs, from which we can calculate a mean and standard deviation. The two methods give extremely similar final radial velocities but the latter method indicates a larger, and we would argue more realistic, (error). Figure 4 shows a comparison between the resulting error-estimates for the two methods. We note that deriving radial velocities from individual spectra has the advantage of highlighting stars with variable radial velocities (see section 4.1). We adopt the average over individually measured OBs as our final radial velocity value.
Table 1 gives the final radial velocities and error estimates for the HB/RGB-UVES stars. Table 5 lists our final radial velocities and error estimates for the RGB-GIRAFFE stars. Some RGB-GIRAFFE stars were not observed across all 20 OBs. For those stars observed in every OB, not all stars have 20 spectra for which fxcor would give satisfactory results (e.g., strong cosmic ray features in a single OB that averaged out in the combined spectrum). A 3 clipping was applied in the final calculation of the radial velocities for the RGB and HB stars. For eight RGB-GIRAFFE stars (M098, M160, M211, M232, M248, M321, M333, and M357) one measurement was rejected thanks to this clipping scheme (see also Table 5). In most cases, once the deviating individual spectrum was removed the remaining measurements fell within 1.
For the TO stars the individual spectra are too noisy to yield satisfactory results and we thus only measured their radial velocities using the final, combined spectra. The results are listed in Table 2. The error reported by IRAF is typically between 1.0 and 1.5 km s-1 for the combined TO spectra and between 0.20 and 0.5 km s-1 for the RGB-GIRAFFE and HB/RGB-UVES stars. Our tests with the RGB-GIRAFFE stars indicate that those errors do not reflect the true uncertainty in the radial velocity measurement over several OBs for stars observed with the Medusa fibres (see Table 5). However, the IRAF error is consistent with the (OB) for the UVES stars, where the higher resolving power affords us greater accuracy (see Table 1). An additional source of error is the decreasing S/N. Even for the combined TO spectra the S/N is low, perhaps resulting in a slightly worse determination of the radial velocity. Fortunately, the turn-off velocity distribution is very clean: the member and non-member stars are very distinctly separated in radial velocity (see Table 2 and Fig. 7). Therefore the precise value of the uncertainty in radial velocity makes no practical difference for the TO candidates.
4.1 Comments on individual stars


M227
This star was selected as a potential RGB star. Instead of a relatively clean RGB spectrum we have a very rich spectrum full of molecular band-heads. Figure 5 shows a section of the spectrum of M227 and the cluster member star M151 for comparison. It was not possible to determine a radial velocity for M227 with either of our templates. Given the position of M227 in the 2MASS CMD, it is unlikely that it is an M giant (or that it is behind the same interstellar extinction as NGC 5927). M227 is most probably an intrinsically red foreground dwarf star.
M238
This star was selected as a potential RGB star. We note, based on visual inspection of the spectrum, that this star most likely is quite a bit more metal-poor than the majority of the stars observed. In Fig. 5 we show a section of the spectrum of M238 and the cluster member M151 for comparison. M238 is not a radial velocity member of NGC 5927.
M130, M238, M240, M244, and M349
These five stars were selected as potential RGB stars. They all show temporal variability in their radial velocities, as illustrated in Fig. 6. Our observations are clumped in time. For M130, M238, and M244 there is not much variation within each group of observations carried out close in time, but the variability shows up on longer timescales. M349 and M240 have the potential for variability on a much shorter time scale. The difference between maximum and minimum velocity is around 10 km s-1 for all stars but M349, where the difference is as large as 20 km s-1. All five stars show a radial velocity variation at least 2.5 times larger than the average standard deviation across all 20 OBs for all our RGB-GIRAFFE targets (km s-1).
Since the fibre configuration was not constant across all 20 OBs we have investigated the possibility that stars were misidentified, either through improper fibre positioning or faulty fibre-star matching. In all cases fibre coordinates were well matched to the correct stellar coordinates. Furthermore, fibre configuration changes do not correlate with the observed radial velocity variations. Radial velocity variations as large as these typically indicate stellar companions. There is no indication of a secondary spectrum in any of these cases. We note that of these five potential binary systems only M244 is a radial velocity member of NGC 5927 (see Table 5).
M341 and M322
These stars were selected as potential RGB stars. They have a very large for the radial velocities when all OBs are considered, but radial velocity measurements from individual OBs fall within 3 of the final value. We have not been able to identify anything that might explain the large . Neither star is a radial velocity member.
5 Cluster membership and the radial velocity of NGC 5927
| Radial velocity | No. of objects | Type of obs. | Reference | ||
|---|---|---|---|---|---|
| [km s-1] | [km s-1] | ||||
| –96 | 28 | Integrated light | Kinman (1959) | ||
| –78 | =12 | 7 | Compilation | Webbink (1981) | |
| –74 | 15 | 6 | Individual stars | Cohen (1983) | |
| –93 | 14 | Integrated light | Zinn & West (1984) | ||
| –106 | 7 | Integrated light | Hesser et al. (1986) | ||
| –113 | Integrated light | Armandroff & Zinn (1988) (no error) | |||
| –106.6 | 5.2 | 8 | Individual stars | Suntzeff et al. (1993) | |
| –118.6 | 8.8 | 5 | Individual stars | Da Costa & Armandroff (1995) | |
| –123.8 | 8.8 | 19 | Individual stars | Rutledge et al. (1997b) | |
| –84 | 5 | 20 | Individual stars | Carrera et al. (2007) | |
| –110.3 | 21.5 | 43 | Individual stars | Pancino et al. (2010) | |
| –104.03 | 5.03 | 70 | Individual stars | This work |
The first column lists the heliocentric radial velocity. The second
column lists the number of stars used in the derivation of the mean
velocity of the cluster. For four studies integrated light has been
used instead, as indicated. Column three lists the reference for
the measurement. Any additional comments are given in column four.
For a description of the calculation of the total error, including
stellar variability, see Webbink (1981).
Average excludes star M468 and star A.
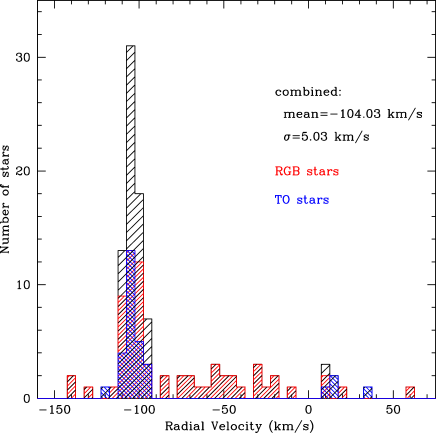
Figure 7 shows our derived velocity histograms for the heliocentric radial velocities of the targeted stars. Stars showing radial velocity variability have been excluded (see section 4.1). It is clear that the RGB-GIRAFFE sample in the outer part of the cluster contributes most of the background/foreground contamination. The majority of the TO candidates are members of the cluster.
The relatively large number of RGB-GIRAFFE candidates and the relatively high fraction of non-members make an iterative rejection necessary. First, we considered only stars with –150 km sv km s-1, since it is clear that the systemic velocity for the cluster must be in this range. Next, we calculated the mean and standard deviation () of the radial velocities for all target stars with measured radial velocities in that range. Then, we excluded stars more than 3 from the initial mean value. Finally, we re-calculated the mean velocity from the culled sample. We iterated in this way until we could exclude no more stars with a 3-clipping. We need 4 further iterations to reach the final value. In this way we derive a mean velocity for NGC 5927 of –104.03 km s-1 with =5.03 km s-1.
This resulted in the 72 stars (RGB-UVES, RGB-GIRAFFE, and TO) that satisfy the membership criteria. All of our RGB-UVES targets are radial velocity members and 26 of our 30 TO candidates are radial velocity members. Our RGB-GIRAFFE candidate success rate is much lower: only 39 of our 75 target stars are 3 members of NGC 5927, i.e. a 50%.
Since NGC 5927 lies in the plane of the Milky Way foreground contamination in the cluster outskirts is quite likely. We have much greater success in the inner 5”. Radial velocity studies with small numbers of stars or limited to the outer regions of the cluster thus may suffer from a large number of non-member stars. If we had been limited to target selection from ground-based photometry (i.e. not accessing the crowded core) and/or had had fewer targets overall, it is quite likely our systemic radial velocity would have skewed to lower values, where the bulk of the foreground contamination lies.
There are several determinations for the radial velocity for NGC 5927 in the literature (see Table 6). One third of the available estimates are based on integrated light rather than single stars.
The spread in radial velocities within a single study can be quite large. For example, although Kinman (1959) reports an average radial velocity of –96 km s-1 (based on 6 stars) individual measurements range from –204 km s-1 to +3 km s-1. Two stars fall at –118 km s-1 and two close to –70 km s-1. We suspect that their sample is heavily contaminated with foreground and background stars. Webbink (1981) is a compilation based primarily on Kinman (1959) but with the addition of a single Mira variable from Andrews et al. (1974). Webbink (1981) reports a weighted average of radial velocity values but contamination can not be excluded.
Cohen (1983) reports radial velocities from individual stars. Her mean velocity is low compared to almost all other determinations. However, Cohen (1983) does report instrument difficulties that limited the internal measurement accuracy to 15 km s-1. The scatter around the mean value is large, 15 km s-1.
We note that the value from Carrera et al. (2007) differs the most (when considering results based on individual stars). A likely explanation is that these observations were taken with FORS2 on the VLT, i.e., a low resolution (), multi-slit spectrograph where misalignments between stars and slits hampered the determination of the radial velocities. This offset can produce differences in radial velocities of about 15 km s-1 (the quoted in Table 6 is the scatter around the mean value). A realistic error in the radial velocity would be 10 – 15 km s-1 (Carrera, priv. com.). Carrera et al. (2007) were primarily concerned with measuring the strength of the Ca ii triplet lines and hence this was not problematic for their science case.
The difference can likely be traced to that the observations in Carrera et al. (2007) were obtained in MXU mode (multi-slit) and not long-slit. Since the masks are created prior to the actual observations it can be difficult to ensure that all stars are properly placed on the slits resulting in decreased accuracy for the radial velocities and can account for the observed discrepancies (Carrera, priv. com.). This can become a significant problem, e.g., if the seeing is smaller than the actual slit width. That this is a potential problem for observations with the FORS instruments has been previously reported in the literature (e.g., Irwin & Tolstoy, 2002). We note that for NGC 6532 Feltzing et al. (2009) derive a radial velocity 20 k ms-1 larger than the value from Carrera et al. (2007). Again, likely resulting from the same cause.
Pancino et al. (2010) obtained velocities for a large number of stars in NGC 5927. Our value agrees well with theirs within the error-bars. Finally, we note that of all the single-star radial velocity measurements in the literature, only Suntzeff et al. (1993) reports having observed stars that are not radial velocity members and we have excluded those from the average in Table 6. Our average radial velocity agrees very well their value.
6 Summary
We have obtained spectra of 105 stars in the direction of the metal-rich globular cluster NGC 5927 using the UVES and GIRAFFE fibres in the FLAMES spectrograph. Based on the measured radial velocities we identified the following members of NGC 5927:
-
•
7 HB and RGB stars with high-resolution spectra
-
•
39 HB and RGB stars with medium-resolution spectra
-
•
26 TO stars with medium-resolution spectra
We also found:
-
•
one foreground cool dwarf star,
-
•
one likely very metal-poor, giant or subgiant star,
-
•
five radial velocity variables with no companion star visible in the spectrum of the primary. One of these variables is a radial velocity member of NGC 5927.
Our final radial velocity, vr=–104.035.03 km s-1, agrees well with the majority of most recently published values, but is based on a much larger sample of high-quality spectra.
Acknowledgements.
We thank the referee, R. Carrera, for a careful read of the manuscript and valuable suggestions that increased the readability of the paper. We would in particular like to thank him for the useful information on the FORS2 observations (Carrera et al. 2007) which gives a likely explanation to the discrepancy between our and their values for the radial velocities. We would like to thank Rachel A. Johnson for her work in the identification of target stars for this observing program. We would also like to thank Thomas Brown for providing the ACS data. JS acknowledges the support of an Incoming International Marie Curie Fellowship. SF is a Royal Swedish Academy of Sciences Research Fellows supported by a grant from the Knut and Alice Wallenberg Foundation. SF acknowledges support from grant number 2008-4095 from the Swedish Research Council. This work has made use of the NED, SIMBAD, and VALD databases. This publication makes use of data products from the Two Micron All Sky Survey, which is a joint project of the University of Massachusetts and the Infrared Processing and Analysis Center/California Institute of Technology, funded by the National Aeronautics and Space Administration and the National Science Foundation.References
- Andrews et al. (1974) Andrews, P. J., Feast, M. W., Lloyd Evans, T., Thackeray, A. D., & Menzies, J. W. 1974, The Observatory, 94, 133
- Armandroff (1989) Armandroff, T. E. 1989, AJ, 97, 375
- Armandroff & Zinn (1988) Armandroff, T. E. & Zinn, R. 1988, AJ, 96, 92
- Bedin et al. (2005) Bedin, L. R., Cassisi, S., Castelli, F., et al. 2005, MNRAS, 357, 1038
- Bica et al. (2006) Bica, E., Bonatto, C., Barbuy, B., & Ortolani, S. 2006, A&A, 450, 105
- Brown et al. (2005) Brown, T. M., Ferguson, H. C., Smith, E., et al. 2005, AJ, 130, 1693
- Brown et al. (2004) Brown, T. M., Ferguson, H. C., Smith, E., et al. 2004, ApJ, 613, L125
- Carrera et al. (2007) Carrera, R., Gallart, C., Pancino, E., & Zinn, R. 2007, AJ, 134, 1298
- Casetti-Dinescu et al. (2007) Casetti-Dinescu, D. I., Girard, T. M., Herrera, D., et al. 2007, AJ, 134, 195
- Casetti-Dinescu et al. (2010) Casetti-Dinescu, D. I., Girard, T. M., Korchagin, V. I., van Altena, W. F., & López, C. E. 2010, AJ, 140, 1282
- Cohen (1983) Cohen, J. G. 1983, ApJ, 270, 654
- Da Costa & Armandroff (1995) Da Costa, G. S. & Armandroff, T. E. 1995, AJ, 109, 2533
- Dinescu et al. (1999a) Dinescu, D. I., Girard, T. M., & van Altena, W. F. 1999a, AJ, 117, 1792
- Dinescu et al. (2003) Dinescu, D. I., Girard, T. M., van Altena, W. F., & López, C. E. 2003, AJ, 125, 1373
- Dinescu et al. (1999b) Dinescu, D. I., van Altena, W. F., Girard, T. M., & López, C. E. 1999b, AJ, 117, 277
- Feltzing et al. (2009) Feltzing, S., Primas, F., & Johnson, R. A. 2009, A&A, 493, 913
- Griffin et al. (2000) Griffin, R. E. M., David, M., & Verschueren, W. 2000, A&AS, 147, 299
- Harris (1996) Harris, W. E. 1996, AJ, 112, 1487
- Hesser et al. (1986) Hesser, J. E., Shawl, S. J., & Meyer, J. E. 1986, PASP, 98, 403
- Irwin & Tolstoy (2002) Irwin, M. & Tolstoy, E. 2002, MNRAS, 336, 643
- Kinman (1959) Kinman, T. D. 1959, MNRAS, 119, 157
- Kraft & Ivans (2003) Kraft, R. P. & Ivans, I. I. 2003, PASP, 115, 143
- Law & Majewski (2010) Law, D. R. & Majewski, S. R. 2010, ApJ, 718, 1128
- Pancino et al. (2010) Pancino, E., Rejkuba, M., Zoccali, M., & Carrera, R. 2010, A&A, 524, A44
- Pasquini et al. (2002) Pasquini, L., Avila, G., Blecha, A., et al. 2002, The Messenger, 110, 1
- Rutledge et al. (1997a) Rutledge, G. A., Hesser, J. E., & Stetson, P. B. 1997a, PASP, 109, 907
- Rutledge et al. (1997b) Rutledge, G. A., Hesser, J. E., Stetson, P. B., et al. 1997b, PASP, 109, 883
- Santos & Piatti (2004) Santos, Jr., J. F. C. & Piatti, A. E. 2004, A&A, 428, 79
- Skrutskie et al. (2006) Skrutskie, M. F., Cutri, R. M., Stiening, R., et al. 2006, AJ, 131, 1163
- Suntzeff et al. (1993) Suntzeff, N. B., Mateo, M., Terndrup, D. M., et al. 1993, ApJ, 418, 208
- Thomas et al. (2003) Thomas, D., Maraston, C., & Bender, R. 2003, MNRAS, 339, 897
- Webbink (1981) Webbink, R. F. 1981, ApJS, 45, 259
- Zinn (1985) Zinn, R. 1985, ApJ, 293, 424
- Zinn & West (1984) Zinn, R. & West, M. J. 1984, ApJS, 55, 45