A SCUBA-2 m survey of protoplanetary discs in the Orionis cluster
Abstract
We present the results from a large m survey of the Orionis cluster using the SCUBA-2 camera on the James Clerk Maxwell Telescope. The diameter circular region we surveyed contains 297 young stellar objects with an age estimated at about 3 Myr. We detect 9 of these objects, 8 of which have infrared excesses from an inner disc. We also serendipitously detect 3 non-stellar sources at that are likely background submillimetre galaxies. The 9 detected stars have inferred disc masses ranging from 5 to about , assuming similar dust properties as Taurus discs and an ISM gas-to-dust ratio of 100. There is a net positive signal toward the positions of the individually undetected infrared excess sources indicating a mean disc mass of . Stacking the emission toward those stars without infrared excesses constrains their mean disc mass to less than , or an equivalent Earth mass in dust. The submillimetre luminosity distribution is significantly different from that in the younger Taurus region, indicating disc mass evolution as star forming regions age and the infrared excess fraction decreases. Submillimeter Array observations reveal CO emission toward 4 sources demonstrating that some, but probably not much, molecular gas remains in these relatively evolved discs. These observations provide new constraints on the dust and gas mass of protoplanetary discs during the giant planet building phase and provide a reference level for future studies of disc evolution.
keywords:
protoplanetary discs – submillimetre: planetary systems1 Introduction
The ever growing number of exoplanet discoveries and their detection statistics illustrate that the natural endpoint of a circumstellar disc is a planetary system (Howard, 2013). Infrared observations of young stellar objects (YSOs) are highly sensitive to small amounts of dust and numerous surveys have now established that discs are almost ubiquitous at early times and have a median lifetime of a few Myr (Mamajek, 2009). This timescale provides a critical constraint on planet formation theories (Alibert et al., 2005), but it is equally important to measure the dust and gas content of the discs in order to understand the diversity of exoplanetary systems.
Millimeter wavelength observations are the best way to measure disc dust masses as the continuum emission is optically thin and only mildly dependent on temperature. Gas masses are harder to determine but the bulk of the disc mass is cold and molecular and is therefore best traced by rotational lines in the same wavelength range. The emission is weak at these long wavelengths, however, and the number of discs that have been detected is relatively small compared to infrared surveys. The situation is particularly acute for discs in regions that are older than Myr, which severely limits our understanding of disc evolution (Williams & Cieza, 2011).
The SCUBA-2 camera on the 15 m James Clerk Maxwell Telescope (JCMT) provides a unique combination of high sensitivity and large field of view at submillimetre (m and m) wavelengths that makes possible, for the first time, unbiased surveys of young stellar clusters for faint emission from protoplanetary discs on a comparable scale to Spitzer Space Telescope surveys (Holland et al., 2013). Here, we present the observations and analysis of a SCUBA-2 survey of the Orionis cluster at m.
The cluster is named after its brightest member, an O9V star in a quadruple system and a member of the Orion OB1b association. Walter et al. (2008) provide a detailed summary of its properties in the Handbook of Star Forming Regions. The salient features of the region for this work are as follows: it consists of several hundred YSOs from substellar to over , with a distribution that is consistent with the Salpeter IMF, amounting to a total stellar mass of about (Sherry, Walter, & Wolk, 2004). There is little nebulosity around the cluster and the reddening along the line of sight is small, E(B-V) mag (Sherry et al., 2008) both suggesting that the natal molecular cloud has almost entirely dispersed.
The cluster is too distant for a reliable Hipparcos parallax and, as protostellar luminosity depends both on age and distance, both these quantities are uncertain and inversely correlated. In this work, we adopt the values from Walter et al. (2008) for the cluster age, Myr, and distance 420 pc. Based on the tightness of the cluster locus on a colour-magnitude diagram, the YSO age spread is fairly small, Myr.
Although Orionis is considerably more distant than the younger, well studied Taurus and Ophiuchus star forming regions, it is one of the closest clusters in an intermediate evolutionary phase when discs are dispersing. Further, as a member of the Orion complex, it comprises part of the closest massive star forming region. Indeed, for a range of reasons from the distribution of stellar associations to cosmochemistry, Orion is considered a better analog of the Solar birthplace (Adams, 2010; Gounelle & Meynet, 2012). The relatively high stellar density partly mitigates the greater distance as most of the cluster sources lie within (3.5 pc) of each other and can be observed within a single SCUBA-2 field.
We use the cluster membership as defined by Hernández et al. (2007, hereafter H07) who surveyed the region with Spitzer to identify point sources with characteristic optical-infrared colour of protostars. This list of 336 sources is complete to about . The fraction of stars with optically thick discs is %, which is consistent for its estimated Myr age with the well characterised infrared disc lifetime plot (Mamajek, 2009). There is no significant difference in the spatial distribution of bright, higher mass stars or disc bearing stars relative to fainter, lower mass stars and discless stars. Thus our SCUBA-2 map provides an essentially unbiased measure of the dust mass for a large sample of discs as they evolve from primordial to debris through the process of planet formation.
The SCUBA-2 observations and followup interferometry are described in §2. The results are presented in §3. Although only a handful of discs are detected, several of these exhibit molecular line emission which suggests that the evolution of the dust and gas content are broadly correlated. We compare our data with millimetre surveys of other regions and discuss the implications for disc evolution and planet formation timescales in §4. Finally, we summarise the paper in §5.
2 Observations
2.1 SCUBA-2
We observed a circular region with diameter (about the diameter of the full Moon) toward the Orionis cluster at m. The data were taken in queue mode over numerous observing runs from October 2011 to January 2013 (program IDs: M11BH02A, M12AH02A, M12BH47A; see Table 1) in median (JCMT band 3) weather conditions, defined by the zenith optical depths at 225 GHz lying between 0.08 and 0.12. This corresponds to precipitable water vapor levels mm and zenith optical depths at m . The total on-source integration time was 31 hours.
The pointing center, RA=05:39:00.0, Dec=-02:33:00.0, lies a couple of arcminutes northeast of the brightest cluster member, Orionis, and was chosen to maximize the number of infrared identified YSOs in the map. The pong-1800 mapping mode was used to provide nearly uniform sensitivity over the large circular field. The data reduction was carried out at the Joint Astronomy Center using the Dynamic Iterative Map Maker in the STARLINK/SMURF software package (Chapin et al., 2013). As there was expected to be little extended m emission and because we were most interested in discs around YSOs, which would be point sources at the SCUBA-2 resolution, we used the blank field configuration for the map maker that is most commonly used for deep field extragalactic surveys.
Each night was reduced individually and the maps were then co-added with
weights proportional to the inverse square of the map noise.
The flux density scale was determined through regular observations of bright
point sources, most commonly Uranus, Mars, and protoplanetary nebulae
CRL 618 and CRL 2688. Following the recommended procedure in online
documentation111http://www.jach.hawaii.edu/JCMT/continuum/scuba2/
scuba2_relations.html,
we reduced these sources with the
same (blank field) map maker configuration file to derive the
flux calibration factor (FCF). These produced a range of values,
FCF Jy pW-1 beam-1.
with no clear trend on observation date, weather, or elevation.
We therefore simply multipled the co-added map by the mean value,
715 Jy pW-1 beam-1, and consider the derived flux densities to
have a calibration uncertainty of 10%.
This FCF is about 30% higher than the value derived for observations
of bright or extended sources by Dempsey et
al. (2013)
due to the additional filtering that is carried out for blank fields.
Finally, we applied a matched beam filter
to smooth the data and maximize the sensitivity to point sources.
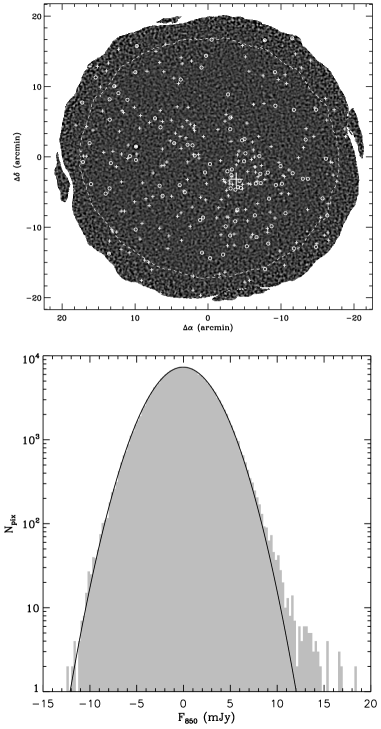
Figure 1 shows the final map and a histogram of
flux densities. The rms of the central region of the map, covering a
total of 938 square arcminutes is 2.9 mJy beam-1.
The noise increases toward the edges but has a usable area, within
which we could make reliable detections, of 1329 square arcminutes
and contains 297 known cluster members.
The weather conditions were too poor for sensitive m observations and we do not use the data from those subarrays in our analysis.
2.2 Submillimeter Array
A handful of detections were apparent once the first set of SCUBA-2 data were analyzed. We followed these up with interferometric observations on the Submillimeter Array (SMA) in the m band. These provided a confirmation of the SCUBA-2 detections and extended the SED to slightly longer wavelengths. Furthermore, the correlator was configured to observe the 230 GHz transition of CO (and its isotopologues) so we could also search for molecular gas emission.
The first set of observations were short “filler” tracks that were carried out between queue scheduled programs. The second set were dedicated tracks (program 2012A-H002) to observe four sources together, observed in excellent weather conditions, and produced much better visibility plane coverage and sensitivity. The dates, observed sources, and atmospheric opacity are listed in Table 1. All observations were carried out in the compact configuration (20–70 meter baselines) providing an angular resolution . The observational setup was typical for the SMA, consisting of a long integration on a passband calibrator (3C84 or 3C279) and interleaving 20 minute integrations on the targets with minute integrations on one or two gain calibrators (J0607-085, J0501-019). Flux calibration was carried out through observations of bright solar system targets (Callisto or Uranus). The data reduction also followed standard practice, using the MIR software package to calibrate the visibilities and MIRIAD for final imaging.
| Date | Source | ||
|---|---|---|---|
| JCMT | |||
| 20111025 | Ori | 3.8 | 0.10 |
| 20111109 | Ori | 1.0 | 0.13 |
| 20111110 | Ori | 2.1 | 0.12 |
| 20111218 | Ori | 0.5 | 0.11 |
| 20111227 | Ori | 2.4 | 0.08 |
| 20120121 | Ori | 2.8 | 0.10 |
| 20120203 | Ori | 1.5 | 0.08 |
| 20121224 | Ori | 3.1 | 0.11 |
| 20130105 | Ori | 3.4 | 0.11 |
| 20130106 | Ori | 3.0 | 0.11 |
| 20130107 | Ori | 3.5 | 0.09 |
| 20130108 | Ori | 4.5 | 0.09 |
| SMA | |||
| 20111204 | V510 Ori | 2.0 | 0.15 |
| 20120324 | J0539-0230 | 0.7 | 0.12 |
| 20121112 | HD294268, V2731 Ori, V602 Ori, V606 Ori | 5.2 | 0.07 |
| 20121114 | HD294268, V2731 Ori, V602 Ori, V606 Ori | 4.0 | 0.05 |
| 20121115 | HD294268, V2731 Ori, V602 Ori, V606 Ori | 2.0 | 0.05 |
| aOn-source integration time in hours. | |||
3 Results
3.1 Continuum emission
3.1.1 SCUBA-2
297 of the 336 total cluster members identified by H07 lie within the SCUBA-2 map boundary. The m flux densities were determined from a beam-weighted average within a diameter circular region centered on their 2MASS positions. The local noise level was measured from the rms within the annulus between to in radius. In general the cluster members are sufficiently separated that there is no confusion in these measurements. A few sources lie within of each other which could produce a slight increase in their noise estimates. Only one source, ID 1005, lies this close to a detected source (J0539-0230), and the local noise was therefore measured manually. The results are tabulated in Table 2.
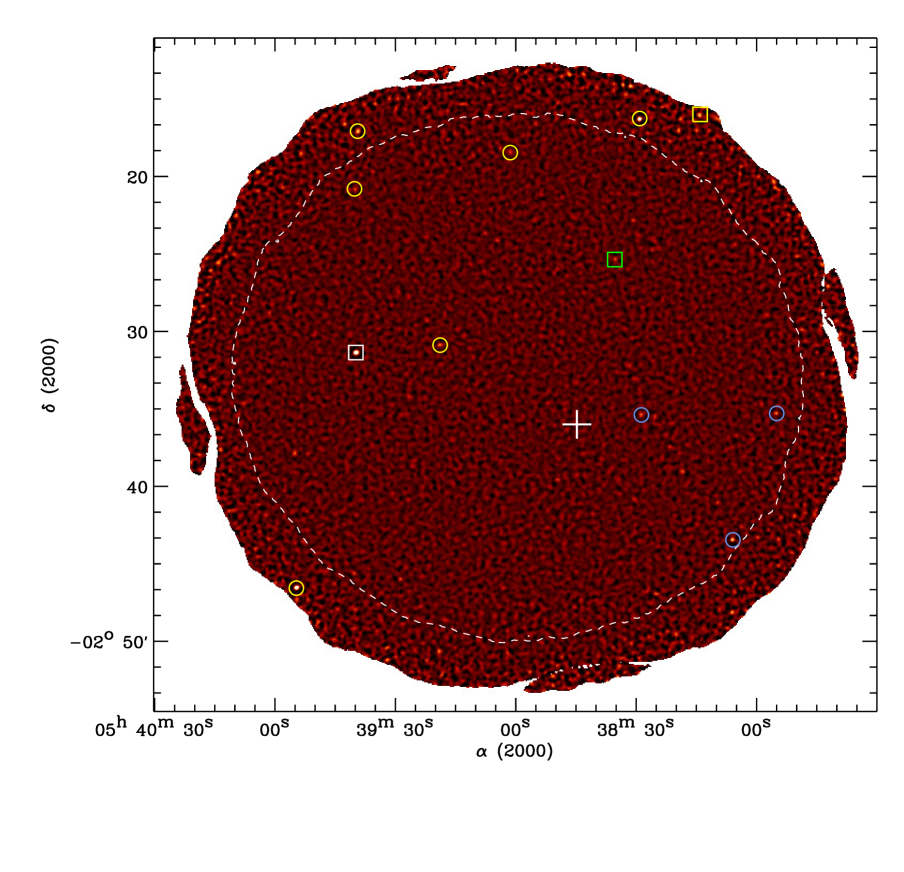
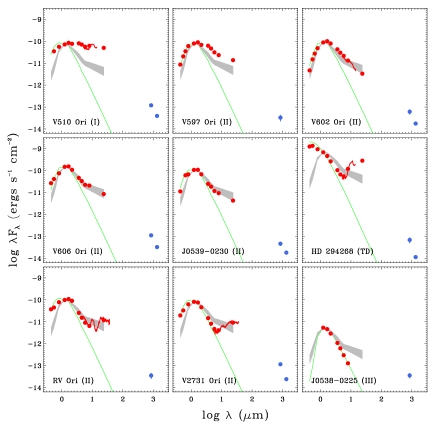
9 sources were detected at significance. They are listed in Table 3 and plotted in Figure 2. All but one of the detections have strong infrared excesses. H07 characterised the YSO evolutionary states by the mid-infrared SED slope across the IRAC bands, m, a shorter wavelength range than is typical. The breakdown of detections in each classified group is as follows: 1 out of 2 Class I; 6 out of 83 Class II; 1 out of 6 transition discs (TD); 0 out of 13 evolved discs (EV); 1 out of 191 Class III; and 0 out of 2 debris discs (DD). Due to the inherent fuzziness of the single parameter SED slope categorization, we follow H07 and group Class I, II, and TD together as optically thick discs from here on. The SEDs of the detected YSOs are shown in Figure 3 with photospheres that correspond to the spectral types in Table 3 or, where unknown, that best match the optical colour. IRS spectra from the Spitzer Archive are plotted when available. For reference, the lower to upper quartile range of the infrared SED for optically thick discs (from Table 4 of H07, scaled to the J band for each source) is also over-plotted. There is a wide range of SED types, from the flat spectrum source V510 Ori (labeled Class I by H07), to the apparently discless Class III source J0538-0225. Three sources have a pronounced mid-infrared dip with little or no excess at short wavelengths, and strong emission at m. H07 labels only one of these, HD 294268, a transition disc.
With the exception of the Class III source, J0538-0225, the SCUBA-2 detections are optically brighter than the median. This is not surprising given that more massive stars tend to have more massive discs, at least initially (Andrews et al., 2013). We do not find a similar demarcation between detected and undetected discs in terms of infrared colour, however. The diversity of SED types suggests that there is no detailed correlation between the inner disc geometry and bulk dust mass, as noted before by Cieza et al. (2008) and attributed to a range of evolutionary pathways as the mass in small grains diminishes.
| IDb | Classb | R.A. (J2000) | Dec. (J2000) | ||
|---|---|---|---|---|---|
| (deg) | (deg) | (mJy) | (mJy) | ||
| 164 | III | 84.43706 | -2.49920 | 3.57 | 4.76 |
| 165 | III | 84.43856 | -2.48111 | -7.17 | 4.48 |
| 194 | III | 84.45671 | -2.60506 | -0.89 | 3.06 |
| 209 | III | 84.46288 | -2.43542 | -2.17 | 3.76 |
| 214 | III | 84.46497 | -2.59045 | 3.95 | 3.55 |
| aOnly the first few rows of this table are shown, the rest | |||||
| will be made available electronically. | |||||
| bSource identification and class from H07. | |||||
| Name | IDa | SpT | Classa | R.A. (J2000) | Dec. (J2000) | |||
| (deg) | (deg) | (mJy) | (mJy) | (Jy km s-1) | ||||
| V510 Ori | 1153 | … | I | 84.91600 | ||||
| V2731 Ori | 540 | … | II | 84.62143 | ||||
| V606 Ori | 1274 | … | II | 84.97777 | ||||
| HD 294268 | 411 | F8 | TD | 84.55875 | ||||
| V602 Ori | 1152 | M3 | II | 84.91411 | ||||
| J0539-0230 | 984 | K9 | II | 84.82854 | ||||
| J0538-0225 | 609 | M6 | III | 84.64726 | … | … | ||
| RV Ori | 1156 | … | II | 84.91740 | … | … | ||
| V597 Ori | 844 | … | II | 84.75575 | … | … | ||
| a Source identification number and class from H07. | ||||||||
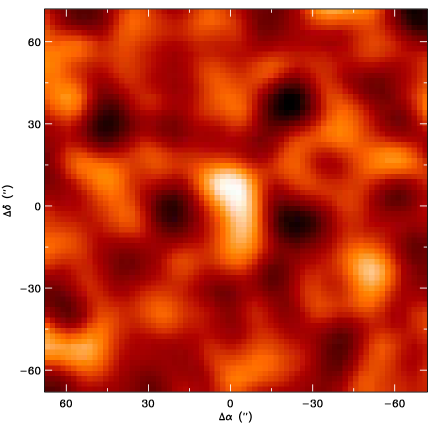
3.1.2 Stacking analysis
Most of the cluster members, including those with infrared excesses from optically thick discs, are not detected in the SCUBA-2 map. However, by analyzing the statistics of the measured flux densities toward their positions in the map (as listed in Table 2), we can constrain average properties of the ensemble. There are 288 sources that were not individually detected at significance. Based on the H07 classification, 83 of these are optically thick discs (mostly Class II but including one Class I and 5 TD) and 190 are Class III, the remainder being 13 optically thin “evolved discs” (also termed anemic discs by Lada et al. (2006)) and 2 debris discs. The mean flux density and standard error of the mean for the two main subgroups are listed in Table 4. There is a positive mean flux density toward the optically thick discs, significant at the level. We directly verified this result by shifting the map to each source location and adding to produce the stacked map in Figure 4. The peak flux density of this map is 1.3 mJy beam-1, which is slightly higher than (but consistent with) the statistical mean of the photometry.
There is no significant detection in the stacked map or in the statistics of the photometry of the Class III sources. As these lack an infrared excess, it may not be surprising that we do not detect these sources, but these data provide a stringent limit to their average m flux density and therefore dust mass (see §4). These results on the collective properties of the discs provide a useful reference point for evolutionary studies in this relatively evolved cluster where 74% of discs have dispersed.
| Type | |||
|---|---|---|---|
| (mJy) | (mJy) | ||
| Optically thick | 83 | 1.03 | 0.30 |
| Class III | 190 | 0.10 | 0.15 |
3.1.3 Submillimeter Array
Six of the SCUBA-2 sources were observed with the SMA at m and all were clearly detected (column 8 of Table 3). The resolution of these data, AU, was too coarse to resolve the discs. However, it verifies the continuum detection and allows us to measure the SED slope, , where . The six discs have similar, very shallow slopes with mean value . This is close to the blackbody value of 2 which suggests significant grain growth, at least several millimetres in size (Draine, 2006). To go beyond suggestion, however, requires longer wavelength observations (e.g., Ricci et al., 2010) and, ideally, resolved multi-wavelength data (Pérez et al., 2012).
The SMA target list was defined from the early SCUBA-2 maps and therefore biased toward what turned out to be the strongest sources. Unfortunately, we are not yet able to independently verify the three faintest m sources. These each lie within the central region of the map where the noise variations are small but, nevertheless, there is a non-negligible probability of a chance alignment of a noise spike with the location of a cluster member. In particular, there is about a 25% chance that a false detection would be found toward one of the 191 Class III sources. Whereas the detection of J0538-0225 is potentially very interesting, it requires independent confirmation.
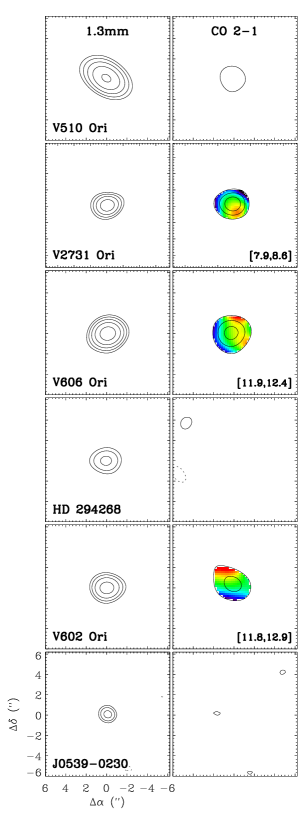
3.2 CO emission
We detected CO 2–1 emission toward 4 of the 6 SMA sources (column 9 of Table 3). In three cases, the emission was strong enough to make a first moment map and reveal a velocity gradient across the (unresolved) disc. Figure 5 shows the m continuum and CO maps. There is no clear correlation between the presence of detectable CO and other properties of the sources although the sample is obviously very small. The CO emission is almost surely optically thick and its strength depends more on the disc temperature than the gas mass. However, the simple fact of its detection tells us that some molecular gas remains in these relatively old discs. The lower sideband of the SMA included the same transition of the isotopologues, 13CO and C18O, which could provide a more accurate measure of the disc gas mass, but these were not detected in any source.
3.3 Background sources
With a depth of 2.9 mJy beam-1 over an area of 938 square acrminutes (within the dashed contour of Figure 2), our SCUBA-2 map of the Orionis cluster can also be considered a moderately deep large field to search for submillimetre galaxies (SMGs). First detected with the original SCUBA camera (e.g., Smail, Ivison, & Blain, 1997; Barger et al., 1998; Hughes et al., 1998), and also seen in the new SCUBA-2 surveys (Chen et al., 2013; Casey et al., 2013; Geach et al., 2013), these prodigious star forming, dusty galaxies contribute significantly to the star formation rate density at high redshifts and are likely a key evolutionary phase in the buildup of massive galaxies.
There are about 13000 independent elements in our map so a blind cutoff will have many false positives and we even expect one noise spike. We therefore conservatively choose a threshold away from known cluster members to search for background sources. Three such objects are identified, shown by the blue circles in Figure 2 and tabulated in Table 5. We have not found any counterparts within of these sources at any other wavelength and consider them to be SMGs.
The latest SCUBA-2 m number counts model from Chen et al. 2013 (submitted) predict sources greater than 15 mJy within the area of our map which is entirely consistent with our observations.
| Name | R.A. (J2000) | Dec. (J2000) | |
|---|---|---|---|
| (deg) | (deg) | (mJy) | |
| SMG J053805.9-024327 | 84.52458 | ||
| SMG J053755.0-023518 | 84.47917 | ||
| SMG J503828.7-023523 | 84.61958 |
4 Discussion
The wide-field mapping capability of SCUBA-2 has allowed us to make sensitive m measurements toward almost 300 members of the Orionis cluster. We were able to follow up the brightest sources with SMA interferometry and search for gas. Here we convert the measured flux densities to physical quantities and compare with other surveys to learn about disc evolution.
4.1 Disc masses
With limited information about the stellar luminosity and temperature, and unresolved disc images, we cannot carry out detailed modeling of the discs. Rather, we use a constant dust temperature, K, which is the average found for Taurus discs by Andrews & Williams (2005) and assume a dust grain opacity, , which follows Beckwith et al. (1990) but excludes the gas-to-dust ratio. At the assumed distance, pc, we therefore derive the following approximate relation between SCUBA-2 flux density, in mJy, and dust mass,
where is the Planck function. We refer to a disc mass, , through the explicit inclusion of an ISM gas-to-dust ratio of 100. The reason for factoring this out from is that, ultimately, we hope to be able to measure disc gas masses independently.
Under these assumptions, the rms level of 2.9 mJy beam-1 within the central region of the map translates to a detection limit of . For the 9 detections, the inferred disc masses range from , which lie at the lower end of the estimates for the minimum mass necessary to form the solar system determined by Weidenschilling (1977) and less than the more recent determination of by Davis (2005). The 83 YSOs with infrared excesses that were not individually detected have an average (stacked) flux density of 1.0 mJy beam, which corresponds to a disc mass of . We therefore conclude that, despite their large infrared excesses, Jupiter scale giant planet formation must be largely complete in these objects. For the 190 Class III YSOs, the non-detection of the mean emission provides a limit to the disc mass of less than , or in terms of dust only, .
As we only observed the 6 brightest SCUBA-2 discs in the cluster with the SMA, we can draw only very limited conclusions about their gas content. However, the fact that we detect CO in four of these discs demonstrates that at least some molecular gas remains in these systems. The CO emission is almost certainly optically thick so it is not possible to estimate the gas mass from this line alone. However, the existence of CO requires a minimum molecular hydrogen column density, cm-2 (Qi et al., 2011), which implies a lower limit to the gas mass, , for a disc with radius . The lack of a 13CO detection, which we might expect to have a lower opacity, at a sensitivity of Jy translates to a limit on the average column density, cm-2 in the SMA beam, for a range of excitation temperatures K. Assuming abundances [H2]/[CO] = and [CO]/[13CO] = 70, consistent with recent measurements in star forming regions by Ripple et al. (2013), implies an upper limit to the gas mass, . This is an order of magnitude lower than the disc masses inferred from the dust continuum and may indicate that the gas-to-dust ratio in these discs is substantially less than the ISM value of 100 or that most of the CO is frozen-out. Actual detections of the CO isotopologues, however, and detailed modeling are required to be definitive.
4.2 Comparisons with other regions
Although there were few detections, this submillimetre survey of protoplanetary discs is the largest of its kind. We only detect the peak of the mass distribution in Orionis, finding it to be about an order of magnitude lower than that in the younger Trapezium Cluster in the same Orion star forming complex (Mann & Williams, 2010), and the Taurus and Ophiuchus star forming regions (Andrews & Williams, 2005, 2007).
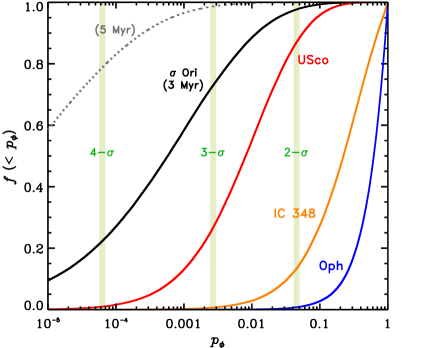
Statistical comparisons between different regions are complicated by the strong dependence of disc masses on their host stellar properties, particularly mass and binarity (Andrews et al., 2013). Unfortunately, little information about either of these is available for most members of Orionis. To compensate as best as we can, we use the 2MASS J band magnitudes to estimate spectral types by comparing to pre-main-sequence tracks (Siess, Dufour, & Forestini, 2000) at an assumed age of 3 Myr and distance of 420 pc. To remove an additional model dependent step, we directly compare m luminosities rather than inferred disc masses, scaling Taurus measurements with the average millimetre SED slope for that region (Andrews & Williams, 2005). Most of the Taurus measurements used here are at m so the uncertainty introduced by this extrapolation is minor. Following the methodology in Andrews et al. (2013), we then sample from the Taurus disc luminosity distribution at each spectral type to create synthetic distributions compatible with the stellar properties of Orionis. These are then compared to the actual SCUBA-2 observations using a standard two-sample test for censored datasets (Feigelson & Nelson, 1985), yielding a null probability that they are not drawn from the same parent distribution, . The cumulative probability distribution, , plotted in Figure 6, indicates that the Orionis m disc luminosity distribution is different from Taurus at significance.
The significance decreases slightly if the Baraffe et al. (1998) pre-main-sequence tracks are used, since these predict lower effective temperatures for a given J band absolute magnitude at 3 Myr, and the Monte Carlo simulations therefore sample from a lower set of Taurus disc masses. On the other hand, the significance increases if the cluster is older since the inferred effective temperatures are now higher and the synthetic disc flux densities generally higher. The dashed line in Figure 6 shows the probability distribution if Orionis is 5 Myr old and 350 pc distant.
The ages of star forming regions at early times, Myr, are not well determined as they depend on the uncertain initial conditions of protostellar birth models. However, the general decline of the infrared disc fraction with time is well characterised and can serve as a benchmark for the evolutionary state of different regions. Based on this simple observable, therefore, it is clear that Orionis, with a disc fraction of 27%, is more evolved than Taurus, with a disc fraction of 63% (Hartmann et al., 2005).
Millimeter surveys toward other other moderately evolved star forming regions, IC 348 (Lee, Williams, & Cieza, 2011) and Upper Scorpius (Mathews et al., 2012), also found very low disc masses which were interpreted as signatures of evolution. At face value, the disc luminosity distributions are similar to Orionis (and very different from Taurus). These surveys, and that of the younger Ophiuchus from Andrews & Williams (2007) are included in Figure 6 following the same Monte Carlo sampling comparison with the Taurus distribution. Ophiuchus and IC 348 with disc fractions % (Evans et al., 2009) and % (Lada et al., 2006) respectively, are statistically indistinguishable from Taurus. The low observed disc masses in IC 348 is attributable to the generally low stellar masses in this region (Luhman et al., 1998). Upper Scorpius, with a disc fraction of only 19% (Carpenter et al., 2006), is also not formally statistically different from Taurus. In this case, because the intrinsic dispersion of disc masses at any given stellar mass is a factor of 40 (Andrews et al., 2013), the survey size of 37 sources is too small to rule out the observed low disc masses being due to sampling.
The combination of sensitivity and large sample size of this SCUBA-2 survey, covering a wide range of stellar masses, is essential to the statistical significance of what might seem an intuitively obvious result: as a young stellar region evolves and discs dissipate, the dust mass of the remaining discs with infrared excesses decreases. Quantitatively, for our assumed distance and the standard disc dust opacity and gas-to-dust ratio described above, the average Class II disc mass decreases to about by about 3 Myr. Such low masses can only be reconciled with exoplanet statistics if much of the (solid) material has been locked away in large bodies with a relatively small surface area (Greaves & Rice, 2010).
4.3 Future directions
With the exception of the Class III YSO, J0538-0225, which requires independent verification, all the SCUBA-2 detected sources have infrared excesses. However, there is no particular signature that correlates with the strength of the m emission. Only 2 SCUBA-2 YSOs have IRAC excesses that are greater than the median for Class II discs. Furthermore, it is intriguing that the SEDs of 3 out of the 8 optically thick discs exhibit dips between m and m (or more specifically a rising slope from m to m; Figure 3). These transition disc signatures are generally quite rare, comprising about 15% of SED types in most clusters (Williams & Cieza, 2011). Other examples of massive discs with depleted inner regions in several Myr-old star forming regions are J1604-2130 in Upper Scorpius (Mathews, Williams, & Ménard, 2012), and the famous TW Hya (Hughes et al., 2007). The numbers are, as yet, too small to be statistically significant but it is tempting to speculate that the reasons for the gap and large outer disc reservoir are related. One possibility is a massive planet that produces enough torque on the outer disc to slow down disc accretion (Zhu et al., 2012).
Looking ahead, the recently commissioned Atacama Large Millimeter Array (ALMA) provides the capability to survey hundreds of discs in many different star forming regions at an order of magnitude higher sensitivity in the line and continuum than the data presented here. The statistical positive signal of about 1 mJy toward the Class II non-detections is well within ALMA’s sensitivities, even for snapshot integrations. Unless the mass distribution is bimodal, therefore, it should be able to detect most, if not all, Class II discs in Orionis. Moreover, it provides subarcsecond imaging and therefore the ability to determine not only bulk masses but surface densities. Ultimately such ALMA surveys of different regions will reveal the evolution of the solid and gas components of discs as a function of radius, stellar mass, and environment. These will provide the key inputs required for population synthesis models and understanding the diversity of exoplanetary systems.
5 Summary
We have mapped 297 (88%) of the known members of the Orionis cluster at m. Only 9 YSOs were detected with inferred masses ranging from 5 to . The infrared SEDs of these sources exhibit a wide diversity suggesting that the evolution of their structural properties such as inner holes and flaring is largely independent of their bulk dust mass. Based on a stacking analysis, the mean mass of the 83 Class II YSOs that were not individually detected is . We followed up 6 sources with spectroscopic observations and detected CO emission toward 4 of them, suggesting that the gas remains broadly coupled with the dust as the discs dissipate.
The general weakness of the emission in the Myr Orionis discs illustrates how rapidly the amount of raw material available for planet formation decreases with time. Whereas 27% of the cluster members have optically thick discs, the average mass of 90% of these discs is only about half a Jupiter mass. This suggests a yet faster timescale for giant planet formation than the oft-used infrared lifetime plot. SCUBA-2 has proven to be an efficient survey instrument for large clusters to learn about the collective evolution of discs and as a finder telescope for followup interferometry. As ALMA begins millimetre wavelength surveys of the dust and gas content of protoplanetary discs we can expect more precise constraints on planet formation models.
Acknowledgments
This work is supported by funding from the NSF through grant AST-1208911. We thank Remo Tilanus for advice with the data reduction and the referee, Jane Greaves, for her comments. The James Clerk Maxwell Telescope is operated by the Joint Astronomy Centre on behalf of the Science and Technology Facilities Council of the United Kingdom, the Netherlands Organisation for Scientific Research, and the National Research Council of Canada. Additional funds for the construction of SCUBA-2 were provided by the Canada Foundation for Innovation. The Submillimeter Array is a joint project between the Smithsonian Astrophysical Observatory and the Academia Sinica Institute of Astronomy and Astrophysics and is funded by the Smithsonian Institution and the Academia Sinica. This research has made use of the SIMBAD database, operated at CDS, Strasbourg, France and the Two Micron All Sky Survey, which is a joint project of the University of Massachusetts and the Infrared Processing and Analysis Center/California Institute of Technology, funded by NASA and NSF.
References
- Adams (2010) Adams F. C., 2010, ARA&A, 48, 47
- Alibert et al. (2005) Alibert Y., Mordasini C., Benz W., Winisdoerffer C., 2005, A&A, 434, 343
- Andrews et al. (2013) Andrews S. M., Rosenfeld K. A., Kraus A. L., Wilner D. J., 2013, ApJ, 771, 129
- Andrews & Williams (2007) Andrews S. M., Williams J. P., 2007, ApJ, 671, 1800
- Andrews & Williams (2005) Andrews S. M., Williams J. P., 2005, ApJ, 631, 1134
- Baraffe et al. (1998) Baraffe I., Chabrier G., Allard F., Hauschildt P. H., 1998, A&A, 337, 403
- Barger et al. (1998) Barger A. J., Cowie L. L., Sanders D. B., Fulton E., Taniguchi Y., Sato Y., Kawara K., Okuda H., 1998, Natur, 394, 248
- Beckwith et al. (1990) Beckwith S. V. W., Sargent A. I., Chini R. S., Guesten R., 1990, AJ, 99, 924
- Caballero (2008) Caballero J. A., 2008, A&A, 478, 667
- Carpenter et al. (2006) Carpenter J. M., Mamajek E. E., Hillenbrand L. A., Meyer M. R., 2006, ApJ, 651, L49
- Casey et al. (2013) Casey C. M., et al., 2013, arXiv, arXiv:1302.2619
- Chapin et al. (2013) Chapin E. L., Berry D. S., Gibb A. G., Jenness T., Scott D., Tilanus R. P. J., Economou F., Holland W. S., 2013, MNRAS, 430, 2545
- Chen et al. (2013) Chen C.-C., Cowie L. L., Barger A. J., Casey C. M., Lee N., Sanders D. B., Wang W.-H., Williams J. P., 2013, ApJ, 762, 81
- Cieza et al. (2008) Cieza L. A., Swift J. J., Mathews G. S., Williams J. P., 2008, ApJ, 686, L115
- Davis (2005) Davis S. S., 2005, ApJ, 627, L153
- Dempsey et al. (2013) Dempsey J. T., et al., 2013, MNRAS, 430, 2534
- Draine (2006) Draine B. T., 2006, ApJ, 636, 1114
- Evans et al. (2009) Evans N. J., II, et al., 2009, ApJS, 181, 321
- Feigelson & Nelson (1985) Feigelson E. D., Nelson P. I., 1985, ApJ, 293, 192
- Geach et al. (2013) Geach J. E., et al., 2013, MNRAS, 432, 53
- Gounelle & Meynet (2012) Gounelle M., Meynet G., 2012, A&A, 545, A4
- Greaves & Rice (2010) Greaves J. S., Rice W. K. M., 2010, MNRAS, 407, 1981
- Hartmann et al. (2005) Hartmann L., Megeath S. T., Allen L., Luhman K., Calvet N., D’Alessio P., Franco-Hernandez R., Fazio G., 2005, ApJ, 629, 881
- Hernández et al. (2007) Hernández J., et al., 2007, ApJ, 662, 1067
- Holland et al. (2013) Holland W. S., et al., 2013, MNRAS, 430, 2513
- Howard (2013) Howard A. W., 2013, Sci, 340, 572
- Hughes et al. (2007) Hughes A. M., Wilner D. J., Calvet N., D’Alessio P., Claussen M. J., Hogerheijde M. R., 2007, ApJ, 664, 536
- Hughes et al. (1998) Hughes D. H., et al., 1998, Natur, 394, 241
- Lada et al. (2006) Lada C. J., et al., 2006, AJ, 131, 1574
- Lee, Williams, & Cieza (2011) Lee N., Williams J. P., Cieza L. A., 2011, ApJ, 736, 135
- Luhman et al. (1998) Luhman K. L., Rieke G. H., Lada C. J., Lada E. A., 1998, ApJ, 508, 347
- Mamajek (2009) Mamajek E. E., 2009, AIPC, 1158, 3
- Mann & Williams (2010) Mann R. K., Williams J. P., 2010, ApJ, 725, 430
- Mathews, Williams, & Ménard (2012) Mathews G. S., Williams J. P., Ménard F., 2012, ApJ, 753, 59
- Mathews et al. (2012) Mathews G. S., Williams J. P., Ménard F., Phillips N., Duchêne G., Pinte C., 2012, ApJ, 745, 23
- Pérez et al. (2012) Pérez L. M., et al., 2012, ApJ, 760, L17
- Qi et al. (2011) Qi C., D’Alessio P., Öberg K. I., Wilner D. J., Hughes A. M., Andrews S. M., Ayala S., 2011, ApJ, 740, 84
- Ricci et al. (2010) Ricci L., Testi L., Natta A., Neri R., Cabrit S., Herczeg G. J., 2010, A&A, 512, A15
- Ripple et al. (2013) Ripple F., Heyer M. H., Gutermuth R., Snell R. L., Brunt C. M., 2013, MNRAS, 431, 1296
- Sherry, Walter, & Wolk (2004) Sherry W. H., Walter F. M., Wolk S. J., 2004, AJ, 128, 2316
- Sherry et al. (2008) Sherry W. H., Walter F. M., Wolk S. J., Adams N. R., 2008, AJ, 135, 1616
- Siess, Dufour, & Forestini (2000) Siess L., Dufour E., Forestini M., 2000, A&A, 358, 593
- Smail, Ivison, & Blain (1997) Smail I., Ivison R. J., Blain A. W., 1997, ApJ, 490, L5
- Walter et al. (2008) Walter F. M., Sherry W. H., Wolk S. J., Adams N. R., 2008, hsf1.book, 732
- Weidenschilling (1977) Weidenschilling S. J., 1977, MNRAS, 180, 57
- Williams & Cieza (2011) Williams J. P., Cieza L. A., 2011, ARA&A, 49, 67
- Zhu et al. (2012) Zhu Z., Nelson R. P., Dong R., Espaillat C., Hartmann L., 2012, ApJ, 755, 6