Strong UV and X-ray variability of the Narrow Line Seyfert 1 Galaxy WPVS 007 – on the nature of the X-ray low state
Abstract
We report on multi-wavelength observations of the X-ray transient Narrow Line Seyfert 1 (NLS1) galaxy WPVS 007. The galaxy was monitored with Swift between October 2005 and July 2013, after it had undergone a dramatic drop in its X-ray flux earlier. For the first time, we are able to repeatedly detect this NLS1 in X-rays again. This increased number of detections in the last couple of years may suggest that the strong absorber that has been found in this AGN is starting to become leaky, and may eventually disappear. The X-ray spectra obtained for WPVS 007 are all consistent with a partial covering absorber model. A spectrum based on the data during the extreme low X-ray flux states shows that the absorption column density is of the order of cm-2 with a covering fraction of 95%. WPVS 007 also displays one of the strongest UV variabilities seen in Narrow Line Seyfert 1s. The UV continuum variability anti-correlates with the optical/UV slope which suggests that the variability primarily may be due to reddening. The UV variability time scales are consistent with moving dust ‘clouds’ located beyond the dust sublimation radius of 20 ld. We present for the first time near infrared JHK data of WPVS 007, which reveal a rich emission-line spectrum. Recent optical spectroscopy does not indicate significant variability in the broad and FeII emission lines, implying that the ionizing continuum seen by those gas clouds has not significantly changed over the last decades. All X-ray and UV observations are consistent with a scenario in which an evolving Broad Absorption Line (BAL) flow obscures the continuum emission. As such, WPVS 007 is an important target for our understanding of BAL flows in low-mass active galactic nuclei (AGN).
1 Introduction
Outflows are a ubiquitous property of AGN. For example, blue-shifted emission lines like [OIII]5007 (e.g., Komossa et al., 2008a), or blue shifted absorption lines in the UV and in X-rays (e.g., Crenshaw et al., 2004) are typically interpreted as signs of outflowing gas. Outflows can be driven in principle magnetically, thermally, and through radiation (e.g., Kurasawa & Proga, 2009a, b; Proga & Kallman, 2004). With the kinetic energy and angular momentum transported outwards, outflows have strong influences on the AGN environment. As a consequence, many AGN parameters are driven by the Eddington ratio (e.g., Boroson, 2002; Sulentic et al., 2000; Grupe, 2004; Xu et al., 2012). The class of AGN that shows the strongest outflows (besides jets) are Broad Absorption Line Quasars (BAL QSOs, e.g., Weymann et al., 1991) which can reach outflow velocities of more than 20000 km s-1 (e.g., Hamann et al., 2008). Roughly 10-20% of optically-selected quasars belong to this class (e.g., Dai et al., 2008; Elvis, 2000) with increasing percentage among infrared selected samples, which is often interpreted as an inclination effect. However, it has also been suggested that the occurrence of BALs may mark a specific time in the life of a quasar (Mathur, 2000; Becker et al., 2000). Because the strength of radiation driven outflows directly depends on , BAL QSOs are at one extreme end of the distribution (e.g., Boroson, 2002). In the local Universe the AGN with the highest are Narrow Line Seyfert 1 galaxies (NLS1s; Osterbrock & Pogge, 1985).
NLS1s have drawn a lot of attention over the last two decades due to their extreme properties, such as, on average, steep X-ray spectra, strong Fe II emission and weak emission from the Narrow Line Region (e.g., Boroson & Green, 1992; Grupe, 2004; Komossa, 2008). All these properties are linked, and are most likely driven primarily by the mass of the central black hole and the Eddington ratio . Generally speaking, NLS1s are AGN with low black hole masses and high . NLS1s have also been considered to be AGN in an early stage of their evolution (Grupe et al., 1999; Mathur, 2000).
It has been suggested by Brandt & Gallagher (2000) and Boroson (2002) that BAL QSOs and NLS1s are similar with respect to their high . However, they differ in their black hole masses and appear to be at opposite ends of the spectrum. It has also been found that the rest-frame optical spectra of at least some BAL QSOs look very much like low-redshift NLS1s (e.g., Marziani et al., 2009; Dietrich et al., 2009). While all these results seem to support the connection between BAL QSO and NLS1s, what is missing is a direct link between them: an AGN that shows properties of a typical NLS1 as well as those of BAL QSOs. Such a link is the NLS1 WPVS 007.
When the NLS1 WPVS 007 (RBS 0088; 1RXS J003916.6; = , = , z=0.02861; Wamsteker et al., 1985; Grupe et al., 1995; Schwope et al., 2000) was discovered in X-rays during the ROSAT All Sky Survey (RASS; Voges et al., 1999) it appeared to be a normal X-ray bright AGN, although its X-ray spectrum was unusually soft (Grupe et al., 1995). However, when it was observed again three years later with the ROSAT Position Sensitive Proportional Counter (PSPC; Pfeffermann et al., 1986) it appeared to have almost vanished in X-rays, with a factor of more than 400 drop in its X-ray flux (Grupe et al., 1995). In the following years it was observed several times by ROSAT (Grupe et al., 1995) and Chandra in 2002 (Vaughan et al., 2004). During all these observations, WPVS 007 was extremely X-ray faint. We started monitoring WPVS 007 with the NASA Gamma-Ray Burst Explorer mission Swift (Gehrels et al., 2004) in October 2005 (Grupe et al., 2007a) and were able to finally detect it with Swift in a 50 ks observation in September 2007 (Grupe et al., 2008b). This observation led to the detection of hard X-ray photons in the X-ray spectrum of WPVS 007 for the first time. The hard X-ray spectrum suggested the presence of a strong partial covering absorber.
The strongest clue that the X-ray transience is due to absorption, however, came from UV spectroscopy. In 1996, WPVS 007 was observed by HST (Goodrich, 2000) and low-velocity broad absorption troughs (mini BALs) were present in the UV resonance lines. As suggested by Hamann et al. (2008) mini BALs may be the early (or late) states of BALs. When WPVS 007 was observed again in the UV by FUSE in 2003 it had developed a very strong broad absorption line flow (Leighly et al., 2009). HST COS UV spectra obtained in 2010 June showed a dramatic increase in the UV SiIV and CIV absorption lines (Cooper et al., 2013) compared with the 1996 HST observation.
WPVS 007 is special because BALs are rare in such low-luminosity systems as WPVS 007 (e.g., (Laor & Brandt, 2002), and because it allows us to study properties which otherwise can not be studied easily in BAL QSOs. Due to their large black hole masses, the time scales observed in BAL QSOs are very long, and at least on the order of years (e.g., Capellupo et al., 2011; Saez et al., 2012). In WPVS 007, however, time scales are shorter, as it is 100 times less luminous than a typical BALQSO and with a similarly smaller black hole mass and typical size scales (Leighly et al., 2009).
The outline of this paper is as follows: in § 2 we describe the observations by Swift, in the near infrared, and in the optical, as well as the data reduction. In § 3 we present the results from the analysis of the light curves and X-ray spectroscopy of the Swift XRT data and the optical and near infrared spectroscopy. In § 4 we discuss the results. Throughout the paper spectral indices are denoted as energy spectral indices with . Luminosities are calculated assuming a CDM cosmology with =0.27, =0.73 and a Hubble constant of =75 km s-1 Mpc-1. This results in a luminosity distances =118 Mpc using the cosmology calculator by Wright (2006). All errors are 1 unless stated otherwise.
2 Observations and data reduction
2.1 Swift Observations
Table 1 presents the Swift observations of WPVS 007 starting on 2008 January 15, including the start and end times and the total exposure times. The lists of the previous Swift observations between 2005 October and 2007 December can be found in Grupe et al. (2007a) and Grupe et al. (2008b). The Swift X-ray telescope (XRT; Burrows et al., 2005) was operating in photon counting mode (Hill et al., 2004) and the data were reduced by the task xrtpipeline version 0.12.6., which is included in the HEASOFT package 6.12. Source counts were selected in a circle with a radius of 24.8 and background counts in a nearby circular region with a radius of 247.5. The 3 upper limits and the count rates of the detections were determined by applying the Bayesian method by Kraft et al. (1991). For these detections, due to the low number of counts, we applied Bayesian statistics to determine the hardness ratios as described by Park et al. (2006). Some of the detections allowed a spectral analysis using Cash statistics (Cash, 1979). In some cases, like in the already published observation from September 2007, the data from several segments when WPVS 007 was detected were merged. For this purpose we created auxiliary response files (ARF) for each segment and then combined these into one arf by using the FTOOL addarf. For all spectra we used the most recent response file swxpc0to12s6_20010101v013.rmf. Due to the small number of counts used in the spectra, the counts were not binned.
The UV-optical telescope (UVOT; Roming et al., 2005) data of each segment were coadded in each filter with the UVOT task uvotimsum. Source counts in all 6 UVOT filters were selected in a circle with a radius of 5 and background counts in a nearby source free region with a radius of 20. UVOT magnitudes and fluxes were measured with the task uvotsource based on the most recent UVOT calibration as described in Poole et al. (2008) and Breeveld et al. (2010). The UVOT data were corrected for Galactic reddening (; Schlegel et al., 1998). The correction factor in each filter was calculated with equation (2) in Roming et al. (2009) who used the standard reddening correction curves by Cardelli et al. (1989). Due to new UVOT calibration files (Breeveld et al., 2010) also observations that were previously published in Grupe et al. (2007a) and Grupe et al. (2008b) were reanalyzed in order to have a consistent data set. All these UVOT data starting in October 2005 are listed with their magnitudes corrected for Galactic reddening and the optical/UV spectral slope in Table 2. This optical/UV spectral slope was determined from a power law fit to the UVOT data. Note that although we generally observed WPVS 007 with the Swift UVOT in all 6 filters since the beginning of the monitoring campaign in 2005, we switched to the uv m2 filter only after the end of the Swift guest investigator program in March 2012 in order to save on UVOT filter wheel rotations. The uv m2 filter was picked because it is the cleanest UV filter with no broad wings in the filter response (Breeveld et al., 2010).
In order to obtain spectral energy distributions, a source and background spectral file was created for each filter using the UVOT task uvot2pha. Also here the latest UVOT response files for each filter were used.
2.1.1 Near Infrared (NIR) Observations
We observed WPVS 007 as part of an observing program using the NIR imaging spectrograph SofI at the 3.5 m NTT at La Silla/ESO, to study the rest-frame optical spectra of a sample of BAL QSOs (Dietrich et al., 2009). The observation was performed on 2004 September 12 (MJD 53260.112) for s in the J plus H, and s in the H plus K band wavelength ranges under photometric conditions with 1 seeing. A 1 long slit was used for the observation. We used an pixel2 Rockwell HAWAII HgCdTe detector. The data were reduced with ESO’s Munich Imaging and Data Analysis System, MIDAS. The data reduction was carried out the same way as in Dietrich et al. (2009), and a full description can be found in that work.
2.1.2 Optical Spectroscopy
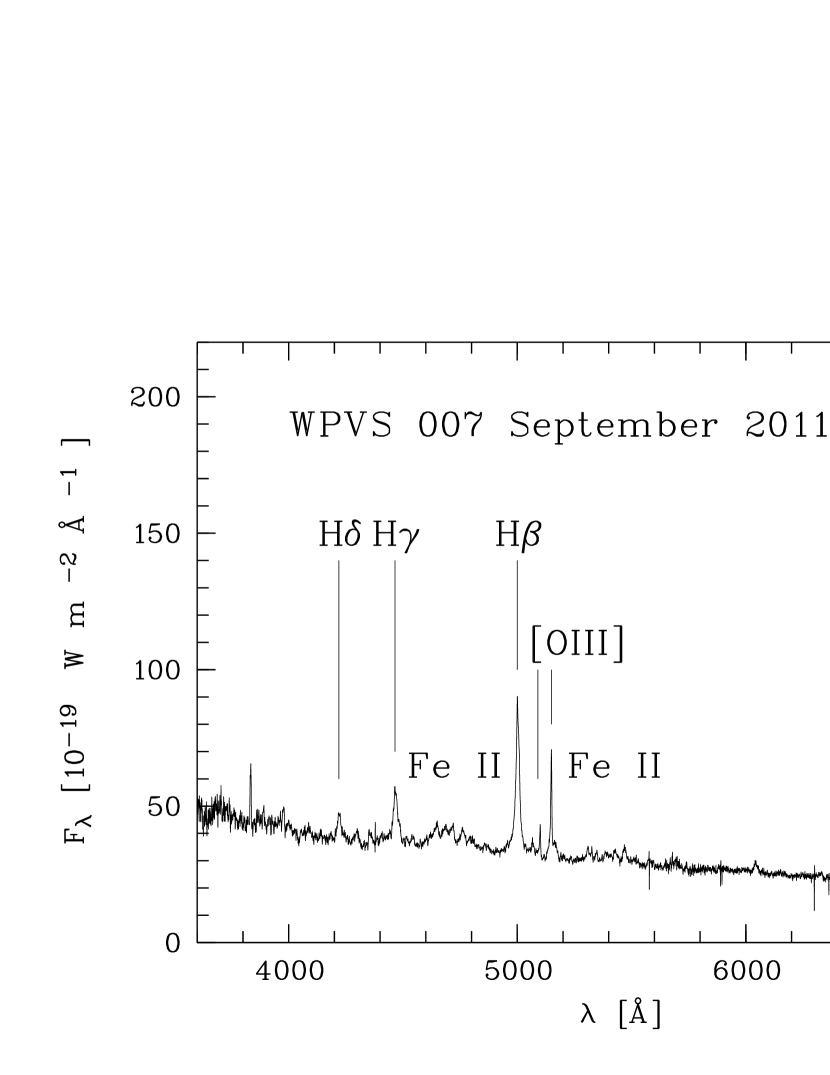
An optical spectrum of WPVS 007 was obtained on 30 September 2011 using the Wide Field Spectrograph WiFeS (Dopita et al., 2007, 2010) at the ANU 2.3m telescope at Siding Spring Observatory (Australia). WiFeS is an integral field spectrograph with a field of view of produced by 25 slitlets of . The instrument provides a wide wavelength coverage via simultaneous observations in a blue and red arm at spectral resolutions of 3000 or 7000. WPVS 007 was observed using the B3000 grating in the blue arm and the R7000 grating in the red arm. The data presented here are the median average of five exposures of 600 s each. The observations were performed in nod-and-shuffle mode for sky-subtraction, using 100 s integrations on the object and the sky. A bias frame and a Ne-Ar lamp exposure were taken between the object exposures in order to be able to account for variations in the bias level and the wavelength solution during the night. The data reduction is based on the reduction recipes implemented in the IRAF reduction package for WiFeS (see Dopita et al., 2010). A B4V star, observed shortly before WPVS 007, is used as a template star for correcting telluric features in the red part of the spectrum. The spectrophotometric calibration is based on observations of CD-30 18140 obtained during the same observing night. Since the night was partly cloudy, the absolute flux calibration is uncertain. In this paper, we present the integrated nuclear spectrum of WPVS 007 obtained for a spatial aperture of 1 arcsec.
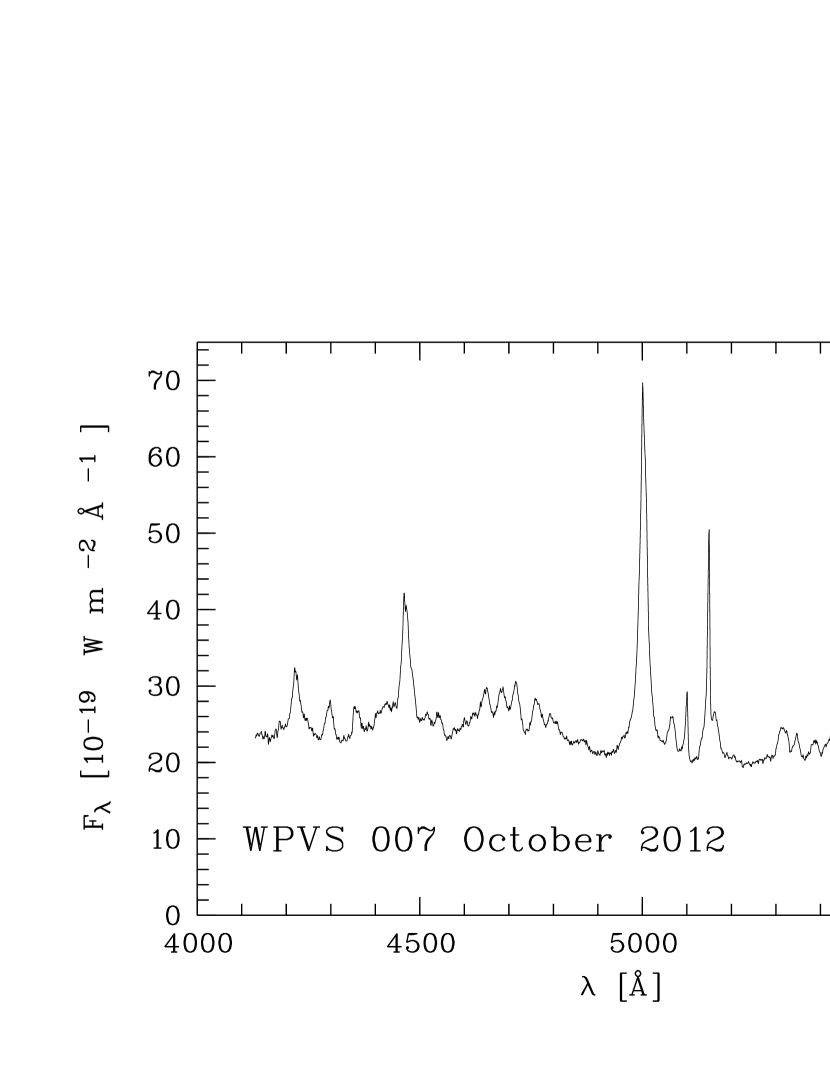
On 23 October 2012, we obtained multiple spectra of WPVS 007 with a total integration time of 1800 s using the Goodman High Throughput Spectrograph on the 4.1-m SOuthern Astrophysical Research (SOAR) telescope (Clemens et al., 2004). We used the 0”.84 long slit in conjunction with the 930 1/mm VPH grating, which has a dispersion of 0.417 per unbinned pixel. This setup allowed us to cover the spectral range 4130-5830 Åwith a resolution of 2.3 Å (R=2100); the mean signal-to-noise ratio in the combined spectrum was approximately 110 per resolution element. Standard IRAF routines were used to bias-subtract, flat-field, and wavelength-calibrate (using FeAr lamp spectra) the spectral frames. Flux calibration was achieved using observations of the spectro-photometric standard star LTT 3218 (spectral type: DA) obtained using the same instrumental configuration as WPVS 007.
3 Results
3.1 X-ray Variability
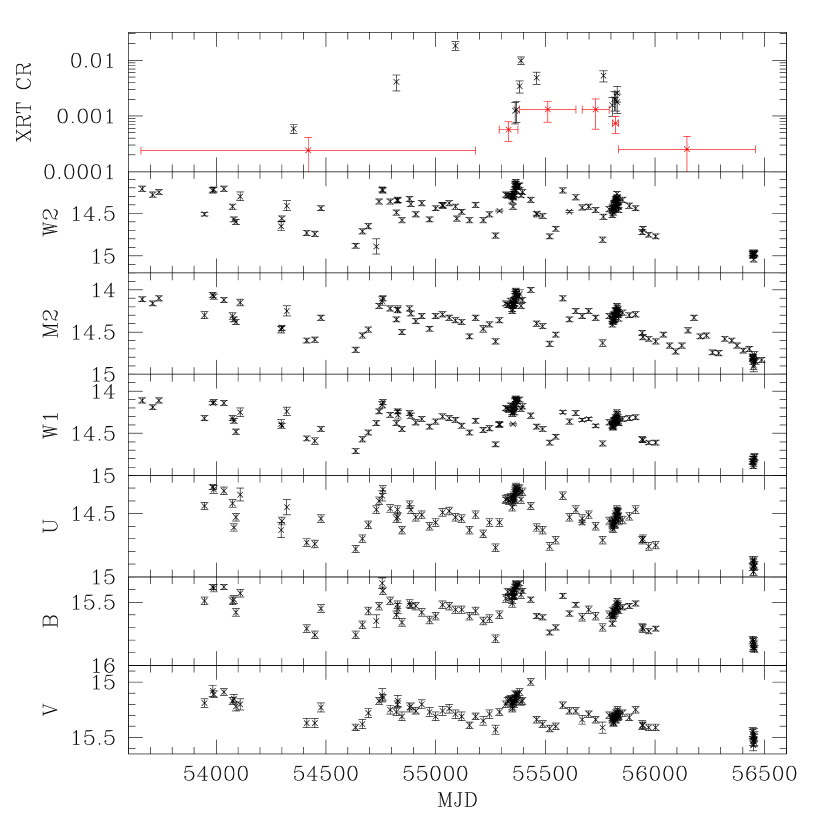
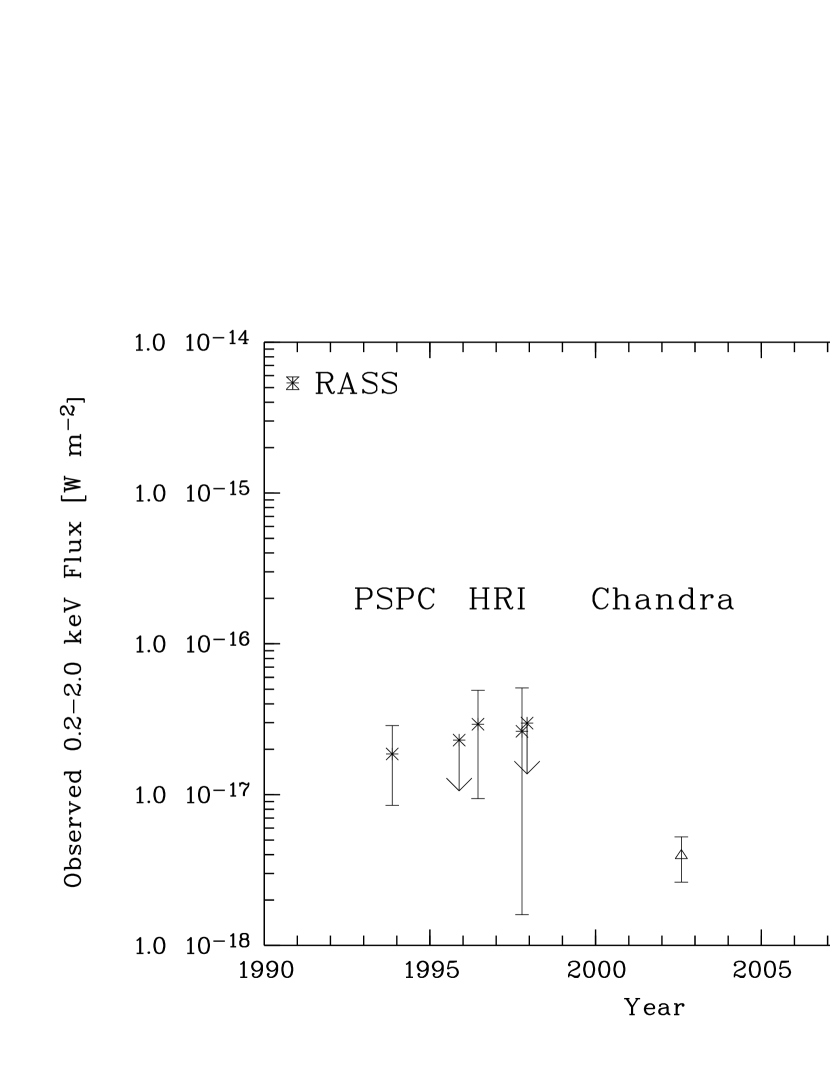
Table 4 lists the Swift detections of WPVS 007. The Swift X-ray light curve with these detections is displayed in Figure 1 which also shows the light curves in each of the 6 UVOT filters. The first detection of WPVS 007 by Swift was obtained in 2007 September when Swift collected more than 50 ks of data on the source (Grupe et al., 2008b). The X-ray light curve of the top panel of Figure 1 also shows the count rates determined from the data when WPVS 007 is not detected in a single observation with the Swift XRT. These data points are displayed as red crosses. The entire long-term X-ray 0.2-2.0 keV flux light curve starting with the discovery during the RASS is displayed in Figure 2.
The strongest Swift detection was found on 2009 September 17 when WPVS 007 was at a level of W m-2 (equivalent to erg s-1 cm-2) which was just a factor of 3.5 fainter than during the detection during the RASS. This ‘high state’ however, lasted only for a few days.
When we observed WPVS 007 again with Swift a week later in a ToO observation, we did not detect the AGN anymore. The 3 upper limit at the position of WPVS 007 was counts s-1 which converts to W m-2 assuming the spectrum of the 2009 September 17 (MJD 55091) observation.
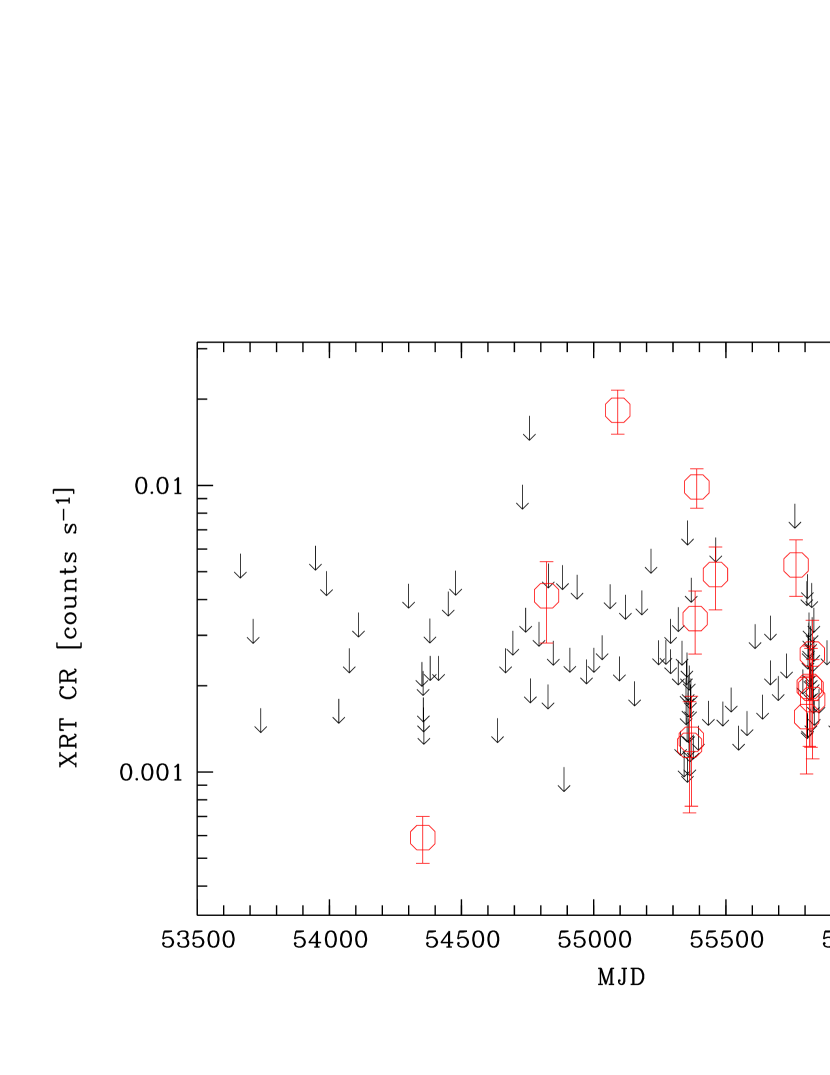
We note that Figure 2 only displays the X-ray detections of WPVS 007, except for two upper limits in the ROSAT HRI. However, typically WPVS 007 is not detected by the Swift XRT in the 2 or 5 ks monitoring observations. The detection limit for a 5ks Swift XRT observation is of the order of counts s-1 and the 3 upper limit for a 2 ks observation is of the order of 3 counts s-1. The Swift XRT 3 upper limits are listed in Table 3 and displayed together with the XRT detections in Figure 3. This figure clarifies that most of the time WPVS 007 is un-detectable by Swift and that WPVS 007 is typically at a count rate below about 1 counts s-1. Note that the 3 upper limits during the first two years of our monitoring program from 2005 and 2006 (target ID 30334, segments 001 to 013) have been previously published in Grupe et al. (2007a).
The increased number of detections especially during our intensive monitoring campaign in 2011 September (2011-September-01 = MJD 55805), as shown in the right panel of Figure 4, may suggest that the strong absorber that is most likely the cause for the X-ray weakness of WPVS 007 has started to disappear. It is worth noting that during the intensive monitoring campaign in 2010 June (2010-June-02 = MJD 55349) we only got two marginal detections (left panel of Figure 4).
In order to check the assumption that WPVS 007 has generally become brighter over the last decade, we co-added data over long periods which are displayed as red points in the XRT count rate light curve in Figure 1. These data points suggest that WPVS 007 has indeed become brighter between 2005 and about 2009, however, our recent Swift observations during the intense monitoring campaign in September 2011 and thereafter indicate that this trend did not persist, and instead, the AGN has become fainter again. Adding all data between 2011 October and 2013 July (total exposure time 82 ks) results in a 3 detection at a level of 2.46 counts s-1.
The X-ray detections of WPVS 007 over the last years not only show strong flux variability, but the hardness ratios listed in Table 4 suggest strong spectral variability as well. While during the ’low-state’ during the 2007 September observation WPVS 007 appeared to be very hard with a hardness ratio HR = +0.54, during the ‘high state’ in 2009 September 17 the hardness ratio was very soft with HR=. Such behavior may be expected from a partial covering absorber. While hardness ratios can give some spectral information, a spectral analysis of the data is required to see if the data are consistent with a partial covering absorber model (see below).
3.2 X-ray spectral analysis
As shown in Section 3.1, WPVS 007 is not detected typically in a single 5ks observation. In order to obtain spectra, the data of several observations have to be combined. This method was applied to derive the photon distribution shown in Grupe et al. (2008b) from the Swift XRT observations in 2007 September. These data were consistent with a neutral partial covering absorber model with an absorption column density of cm-2 and a covering fraction = 0.95.
Table 5 lists the spectral analysis for detections when more than 30 source counts were detected in a single observation. Due to the low number of counts in the single detections during the intense daily monitoring campaign in 2011 September, we combined the data into one spectrum. Although the number of counts even during the brightest X-ray detections are low it still allows a limited spectral analysis using Cash statistics (Cash, 1979). The analysis of these spectra confirms the strong spectral variability found from the hardness ratios listed in Table 4. While the data of 2009 September 17, and 2010 July 13, are both consistent with a single power law model with a relatively flat X-ray spectral slope =1.6 all other data require a partial covering absorber model. An F-test between the power law and partial covering absorber models of the 2007 September and 2011 July data shows that there is a 1% chance that the data are drawn from a random distribution. This is, however, not the case for the 2011 September data which clearly require a partial covering absorber model with cm-2. Here the probability of a random result is 0.3%.
The spectral analysis of all these spectra was based on data when WPVS 007 was in relatively high X-ray flux states. This may not represent the data when WPVS 007 is below the detection threshold. In order to determine the spectrum in these very low X-ray flux states, we combined all data when only 3 upper limits could be measured during the observations listed in Table 3. We merged all these data from 2005 October to 2013 July and obtained a source plus background spectrum with 267 counts with a total exposure time of 434 ks. These data were binned with 15 counts per bin (noted as 2005-2013 in Table 5). Clearly, as expected, the single power law model does not fit the data. We fitted the spectrum with a partial covering absorber model and found a high column density of cm-2 (Table 5). This absorption column density is significantly higher than during the times when WPVS 007 is detected by the Swift XRT, suggesting that at least in part the strong X-ray variability that we see in this AGN is indeed caused by a change in the absorber column density.
A fit with the ionized partial covering absorber model zxipcf (Reeves et al., 2008) suggests an absorber column density of the order of cm-2 with an ionization parameter of the order of and a covering fraction of 0.96. These values (in particular, the column density) agree roughly with the values derived from Cloudy modeling of the absorption lines in the 2003 FUSE spectrum Leighly et al. (2009). Note, however, that due to the low number of counts these values are not well constrained at all.
3.3 UVOT data
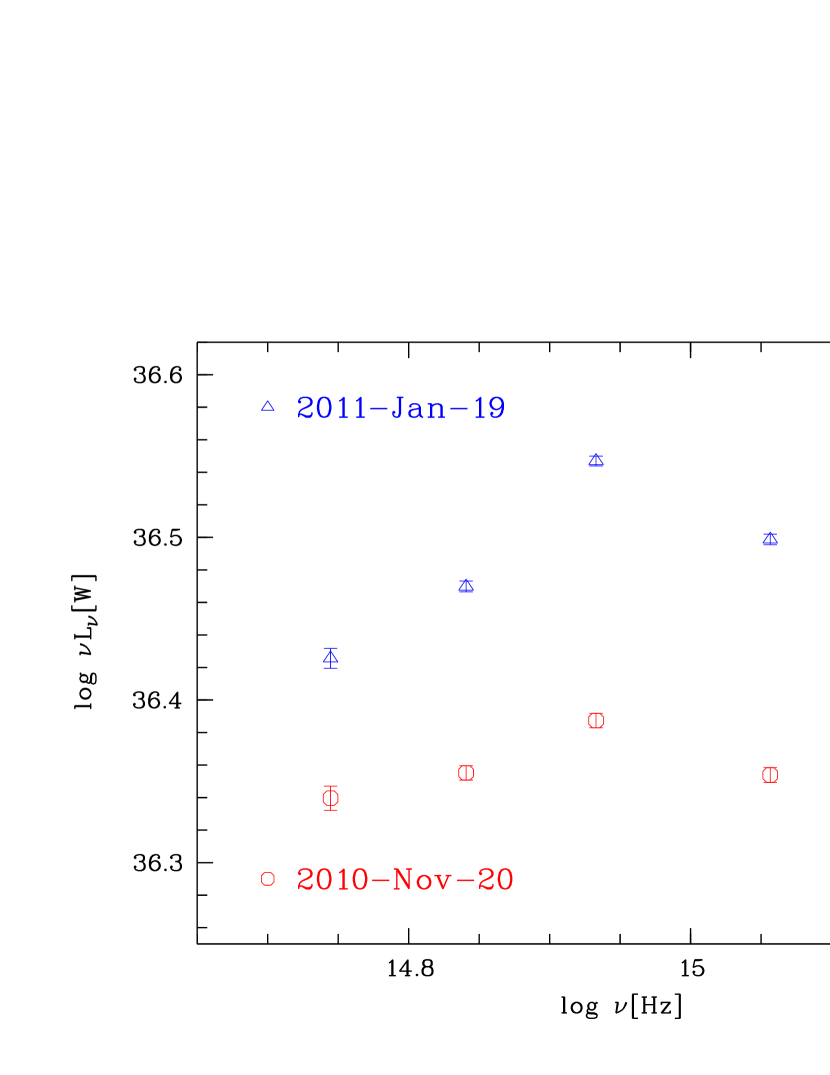
Figure 1 displays the complete UVOT light curves in all 6 filters since the beginning of the Swift monitoring campaign in October 2005. The light curves during the two intensive monitoring periods in 2010 June and 2011 September are displayed in Figure 4. All magnitudes are listed in Table 2. These data show that WPVS 007 is one of the most UV variable NLS1s besides Mkn 335 which has shown even larger amplitude variations (Grupe et al., 2012). Typically NLS1s seem to vary by about 0.3 mag in the UV (Grupe et al., 2010). Swift has monitored several AGN, especially NLS1s, over long time scales, such as CBS 126, PG 1211+143, or PKS 0558-504 (Chiang et al., 2012; Bachev et al., 2009; Gliozzi et al., 2010, 2012, respectively) but none of these has shown the amplitude of variability as observed in Mkn 335 and WPVS 007. The maximum amplitude of variability seen in WPVS 007 was 0.66 mag in W2 within a month between 2008 June 19 and October 21 (MJDs 54636-54760), and 0.53 mag within two months between 2010 November 20 and 2011 January 19. Figure 9 displays the optical/UV luminosities in all six UVOT filters during these observations. Clearly, not only has the AGN become brighter during the 2011 January 19 observation, but also the UV spectral slope has become bluer from =1.000.05 during the 2010 November 20 observation to =0.720.09 in the January 2011 observation. WPVS 007 varies on timescales of days. As displayed in Figure 4 when we performed daily monitoring campaigns of WPVS 007 in June 2010 and September 2011, the UV flux/magnitude changes significantly within a few days.
Note that host galaxy contamination is an issue in low-luminosity AGN such as WPVS 007. In Grupe et al. (2010) we discussed a method to test the significance of the host galaxy contribution by extracting the UVOT data using different source extraction radii. Using the standard 5 extraction radius and a 3 extraction radius (including the parameter apercorr=curveofgrowth in uvotsource) results in a difference of 0.15 mag in V and 0.05 mag in W2. What this means is that we do overestimate the brightness in V slightly, but in W2 the effect of host galaxy contamination is negligible. The effect on spectral slopes such as and is negligible because these are dominated by UV emission where host galaxy contribution is very low.
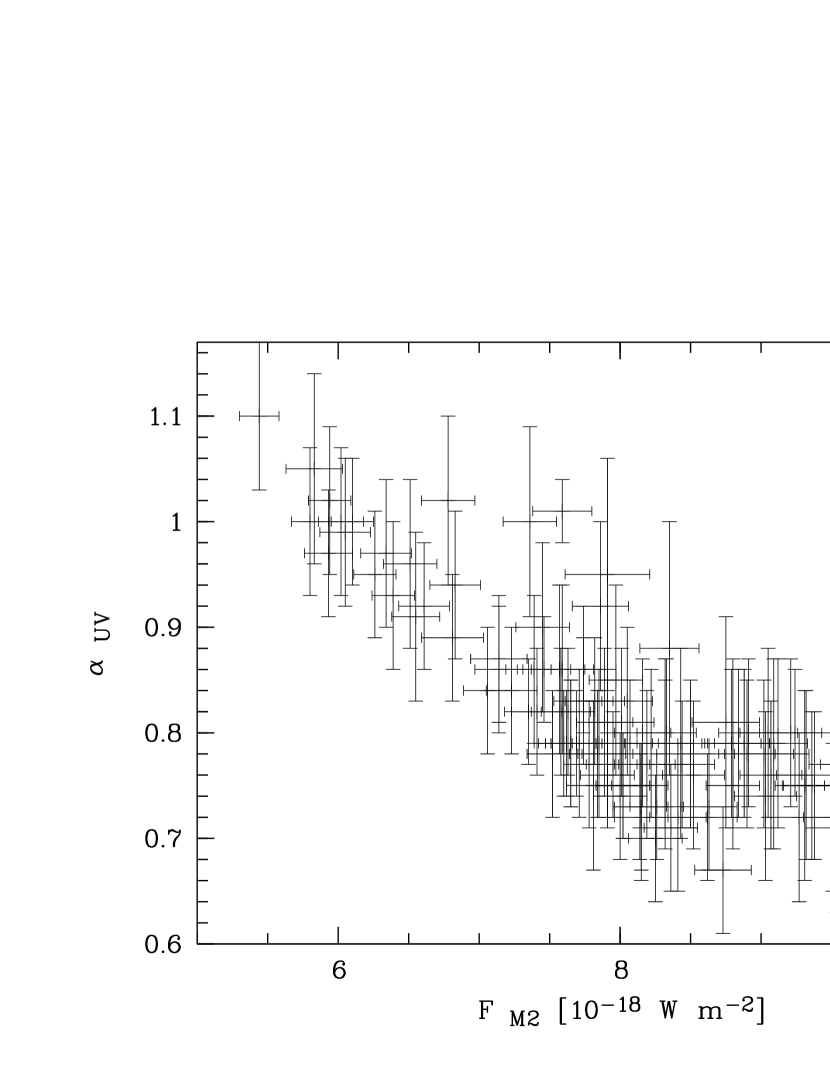
Figure 5 shows the flux measured in the UVOT M2 filter vs. the optical/UV slope . There is a clear anti-correlation between these two properties. The AGN becomes redder with decreasing UV flux. A Spearman rank order correlation analysis results in =–0.76 (116 data points), =–12.56 with a probability of a random result. Figure 6 displays the relation between the magnitude in the UVOT W2 filter111The UVOT W2 filter was picked here because it is the bluest filter which is closer to the X-ray emission and the XRT count rate during a detection as listed in Table 4. We do not find any clear correlation between these two properties. There is only a light trend that the source appears to be brighter in the UV when it is fainter in X-ray. However, this trend is not statistically significant.
The monitoring in all 6 UVOT filters over 6 years allows to check for any time delays between different band passes. We applied cross-correlation analysis to the data in particular the data during the daily monitoring campaigns in June 2010 and September 2011. We did not find any significant delays between the light curves. The detections in X-rays, however, are too sparse to allow for any cross correlation analysis between the X-ray and UVOT light curves.
3.4 Spectral Energy Distribution
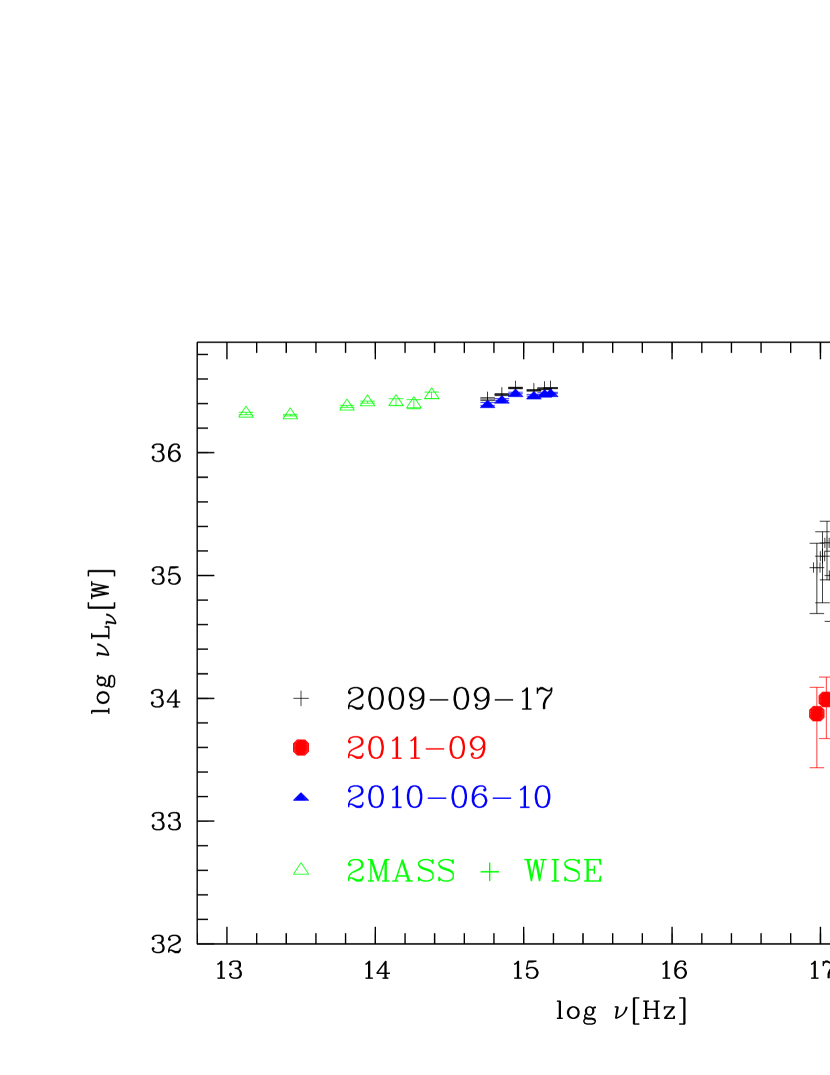
With several X-ray detections of WPVS 007 we are able to study the variability of the spectral energy distribution (SED). Figure 7 displays the SEDs during the 2009 September 17 ‘high state’ and the ’low state’ observations during the 2010 June 10 Chandra observation222The full analysis of the Chandra data will be presented in Cooper et al. (in prep.) and the 2011 September (combined data) Swift detection. In addition this plot also made use of near infrared data from the Two Micron All Sky Survey (2MASS) and mid-infrared data from the Wide-field Infrared Survey Explorer (WISE). The fluxes and luminosities of the 2MASS and WISE measurements are listed in Table 6.
All optical to X-ray spectral slopes for each X-ray detection of WPVS 007 are listed in Table 4333Except for the 2007 September observation when the Swift UVOT was still turned off during the gyro recovery phase (See Grupe et al., 2008b, for details). During the Chandra observation on 2010 June 10 and the Swift detection in 2011 September the optical to X-ray spectral slope 444=–0.384 ) as defined by Tananbaum et al. (1979). The uncertainties in are 0.2 was 2.49. Following the definition by Brandt et al. (2000), at those times WPVS 007 was an X-ray weak AGN. During the 2009 September 17 ‘high state’, however, the slope was =1.89. This value is still significantly larger than expected from a low-luminosity AGN such as WPVS 007. According to the - log relation given in Grupe et al. (2010) (equation 12) we would have expected the optical to X-ray spectral slope to be about =1.26. This is the same value that can be derived from the relation given by Just et al. (2007) and Strateva et al. (2005). Even when corrected for absorption, WPVS 007 still remains rather X-ray quiet considering its UV luminosity density. The changes in the optical to X-ray spectral slopes become apparent when looking at Figure 7. These changes are primarily driven by the strong changes in the X-ray spectra. Note that there is no correlation between the optical-to-X-ray spectral slope and the UV spectral slope . In general, there is a strong anti-correlation between and found among AGN as shown from the Swift observations by Grupe et al. (2010). However, all optical-to-X-ray spectral slopes measured for WPVS 007 are outside the range shown in Grupe et al. (2010). From its of the order of +0.80 one would expect the to be about 1.3, which is obviously not the case.
In Grupe et al. (2010) we fitted optical to X-ray part of the SEDs with a power law with exponential cutoff model to represent the UV/EUV part of the spectrum and an absorbed power law model in the X-ray regime. However, although this model can describe the data, it is not a physical model and in some cases leads to overestimating the bolometric luminosity. Recently Done et al. (2012) introduced a spectral fit model optxagnf which models the spectrum of a thin accretion disk including a color correction of the blackbody component, comptonization in the disk to obtain the soft X-ray excess, and inverse Compton up-scattering to form the hard X-ray component. This model is included in the most recent version of XSPEC 12.7.1.
We applied this model to the 2009 September 17 ‘high state’ data. Due to the low number of X-ray counts in that observation we can use this model only for a consistency check. We measured a bolometric luminosity of log W (equivalent to erg s-1). With its black hole mass of (Leighly et al., 2009) this means that WPVS 007 is accreting at the Eddington limit. Note, that this is a factor of 10 higher than what was estimated by Leighly et al. (2009) based on the 1996 HST FOS spectrum. However, this is consistent with the long-term X-ray light curve shown in Figure 2.
3.5 Near Infrared Spectroscopy
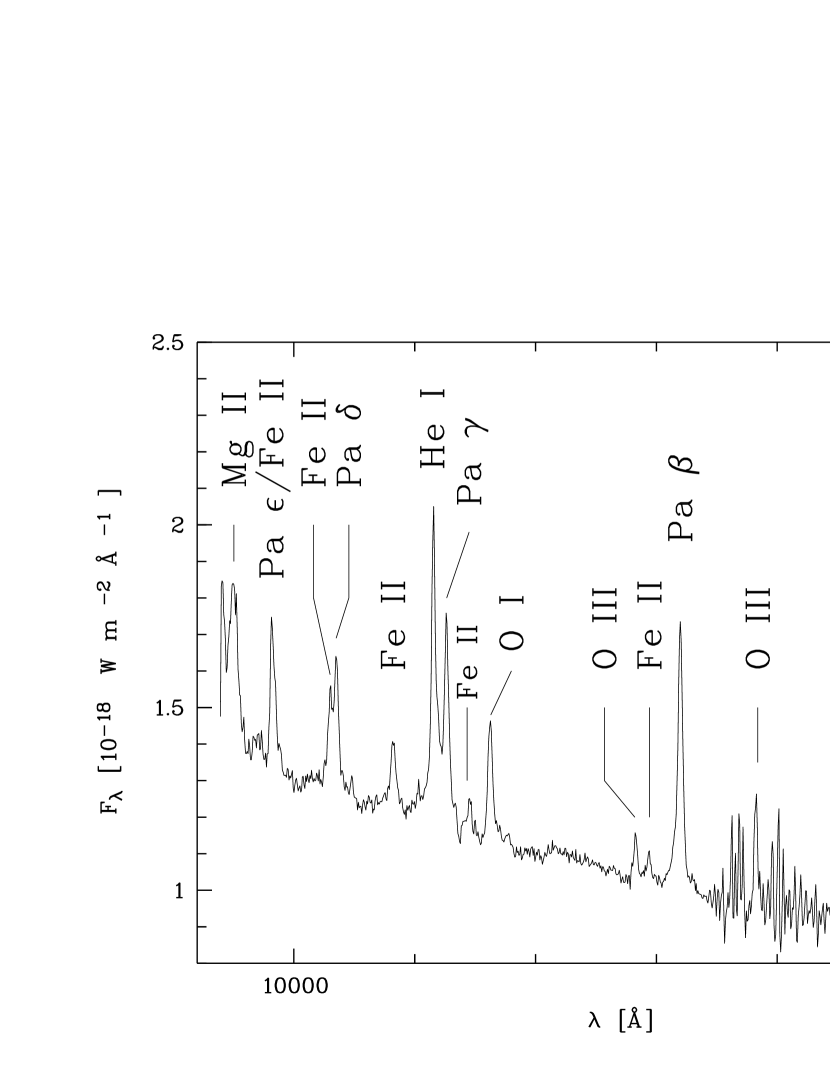
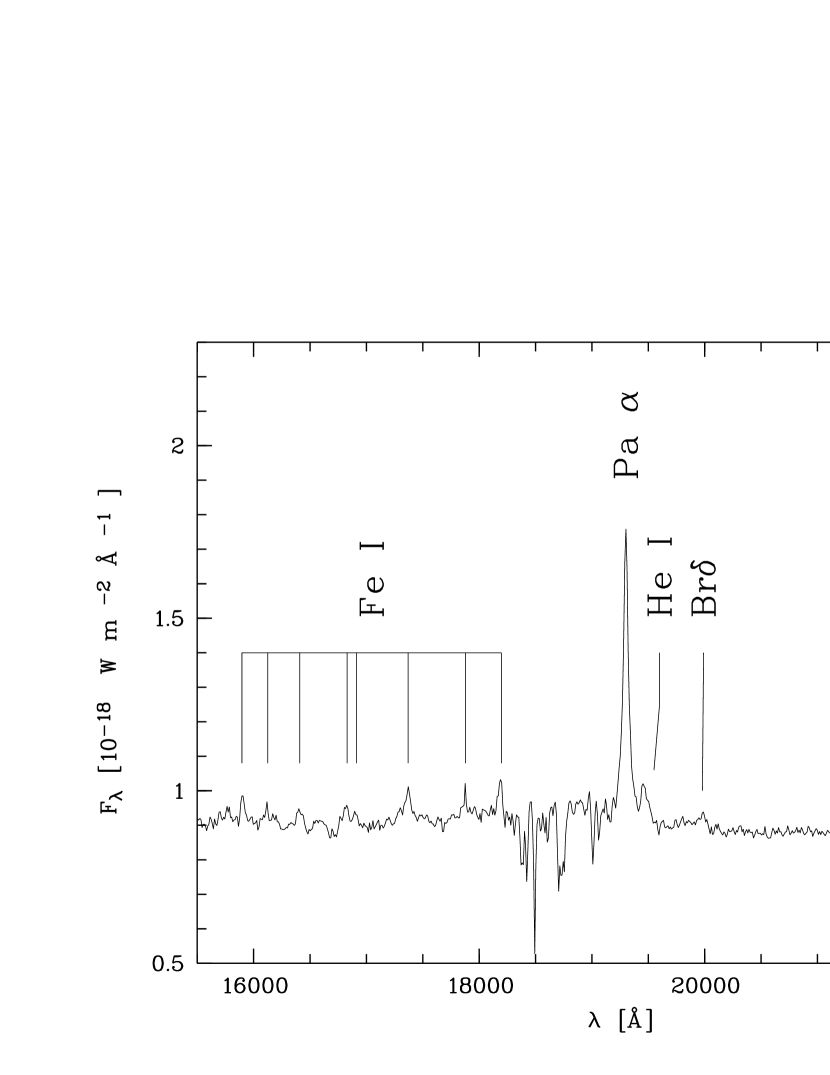
Figure 8 displays the 2004 NTT SOFI NIR spectrum of WPVS 007 in the J plus H and H plus K bands. It is rich in emission lines. Transitions were identified following the NIR spectra of NLS1s published by Landt et al. (2008); Garcia-Rissmann et al. (2012) and the line catalogue of the National Institute of Standards (NIST, Ralchenko et al., 2011). As pointed out by Landt et al. (2008), NIR spectroscopy of Seyfert 1 galaxies is a relatively new field and only some brighter AGN have been studied in the NIR (e.g., Rodriguez-Ardila et al., 2011; Grupe & Thomas, 2002). WPVS 007 exhibits very strong FeII and FeI emission lines, even stronger than in the NLS1 prototype I Zw 1 (see Garcia-Rissmann et al., 2012). All identified emission lines in the NIR spectra are listed in Table 7 with their Full Width at Half Maximum (FWHM) and line flux. The equivalent widths of the Pa and Br lines are 68 and 7.6Å, respectively. Compared with other NLS1s, as, e.g., listed in Grupe & Thomas (2002), these values appear to be at the higher end.
3.6 Optical spectroscopy
Figure 10 displays the most recent optical spectra obtained for WPVS 007 at the 2.3m ANU telescope in September 2011, and the 4.1m SOAR telescope on Cerro Pachon in Chile in October 2012 (left and right panels, respectively). The reason for taking these optical spectra was to see, whether any changes in the emission lines had occurred (since the 1990s), given the strong apparent changes of observed (line-of-sight) continuum emission (note that FeII variability has been reported previously by, e.g., Giannuzzo & Stirpe (1996) and Shapovalova et al. (2012)).
For the 2011 September spectrum, which was taken with the Integrated Field Spectrograph, we extracted a nuclear spectrum with 1” extraction radius. We do not find significant changes in the FeII fluxes over more than a decade. Spectra taken in 2007 at CTIO (Dunn et al., 2008), and most recently with the 4.1m SOAR telescope, confirm that there are no significant changes in the emission line strengths compared with the spectra taken in 1992 and 1995 (the properties of the optical emission lines measured at that time were given in Grupe et al. (1999)). This result then implies that no dramatic changes have occurred in the photoionizing continuum seen by the Balmer-line emitting gas
4 Discussion
4.1 On the nature of the X-ray low-state of WPVS 007
We presented new Swift observations on the X-ray transient NLS1 WPVS 007 covering a period between October 2005 (Grupe et al., 2007a, 2008b) and March 2013, in order to see whether the X-ray faintness of WPVS 007 persisted, or whether, and in which way, the source re-brightened again. We find, that WPVS 007 remains below the Swift detection limit most of the time, but shows some periods of short-term fluctuations in X-ray flux, increasing almost to the initial ROSAT high-state once in 2009.
A key question then concerns the nature of the X-ray faintness of WPVS 007: is its X-ray weakness intrinsic, or caused by absorption along the line of sight and related to the strong UV BAL flow which developed in the UV ? What causes the short-timescale high-amplitude fluctuations we see with Swift ?
We begin with a short summary of X-ray weak AGN and models suggested to explain them, and then move on to exploring the link between the long-lasting X-ray low-state of WPVS 007 and its strong UV BALs.
While NLS1s as a population typically appear to be bright in X-rays, their high and steep X-ray spectral slope result in a steeper optical-to-X-ray spectral slope , which makes them appear to be X-ray weaker when compared with Broad Line Seyfert 1s (e.g., Grupe et al., 2010) when comparing the X-ray to the UV flux. However, generally speaking they do not appear to be X-ray weak according to the definition of X-ray weakness of 2.0 as given by Brandt et al. (2000). Nevertheless X-ray weak NLS1s are known (e.g., Williams et al., 2002, 2004). Among the best-studied examples are PHL 1811 (Leighly et al., 2007a) and PHL 1092 (Gallo et al., 2004; Miniutti et al., 2012). X-ray weak quasars have even been reported at high redshifts (Wu et al., 2011). Therefore, X-ray weakness may not be so uncommon even among NLS1s.
Recently Miniutti et al. (2012) reported a drop in the soft X-ray flux in PHL 1092 by a factor of 260 between 2003 and 2008. This is a drop in X-ray flux similar to WPVS 007. PHL 1811 has an =2.3 (Leighly et al., 2007a) which is similar to WPVS 007 when detected. PHL 1092 displays variability in the X-ray loudness between =1.6 and 2.5 (Miniutti et al., 2012), which again is similar to the variability in we have found in WPVS 007 (see Table 4). X-ray variability in other AGN, and NLS1 galaxies in particular, of much lower amplitude has typically been interpreted in terms of either absorption or reflection, or both. Example seen by XMM-Newton as well as Suzaku are: PG 2112+059 (Schartel et al., 2010), PG 0844+349 (Gallo et al., 2011), MCG-6-30-15 Inoue et al. (2011), NGC 4051 (Lobban et al, 2011), Mkn 335 (Grupe et al., 2012), Fairall 9 Lohfink et al. (2012), 1H0707–495 (Miller et al., 2010; Fabian et al., 2012; Dauser et al., 2012), and RX J2340–5329 (Schartel et al, 2013).
However, WPVS 007 is different from all these X-ray weak AGN and absorbed AGN. As discussed by Leighly et al. (2007a) for PHL 1811, the X-ray spectrum of this NLS1 can be fitted by a single power law with just Galactic absorption with no evidence for an intrinsic absorber in the line of sight. This, however, is not the case in WPVS 007. Its X-ray spectra can simply not be fit by a single power law model.
We also note that none of the X-ray weak NLS1 galaxies, including PHL 1092 and PHL 1811, do show any signs of UV absorption lines (Leighly et al., 2007a, b). As we know, this is certainly not the case in WPVS 007 where strong, deep BAL troughs have been found (Leighly et al., 2009). The detection of these strong BAL troughs in the UV therefore strongly suggests that the deep and long-lasting X-ray low-state of WPVS 007 is caused by absorption. Fluctuations in the X-ray count rate could then be caused by clumpiness of this absorber as it crosses the line of sight555 Note that although variable BALs are common, the transitional change as observed in WPVS 007 is extremely rare (e.g., Hamann et al., 2008; Capellupo et al., 2011; Filiz Ak et al., 2012).
We have shown that the fits to the X-ray data of WPVS 007 significantly improve when a partial covering absorber model is applied instead of a single power law model (see Table 5) 666In general, the curvature found in X-ray spectra, such as seen here in WPVS 007 , can also be modeled by a blurred reflection model; as we have demonstrated for the X-ray faint and intermediate states in the NLS1 Mkn 335 (Grupe et al., 2007b, 2008a, 2012; Gallo et al., 2013). Mkn 335, however, lacks strong UV absorption features. . A large absorption column density of about cm-2 is inferred, when the AGN is not detectable in single Swift XRT observations. During times when WPVS 007 is detected, the absorption column density is significantly lower (see Table 5). To summarize, the X-ray variability observed in WPVS 007 is consistent with a variable partial covering absorber in the line of sight.
The column density of the absorber, inferred from UV observations, is on the order of cm-2, with a photoionization parameter of the order of 1, assuming solar metallicity. Since the UV absorber is ionized, and in order to compare more directly with the X-rays, we have re-fitted the Swift data derived from the observations when WPVS 007 was not detected with the ionized partial covering absorber model zxipcf (Reeves et al., 2008). We find that the absorption column density and ionization parameter derived from this spectrum agrees with the 2003 FUSE data. Deep simultaneous UV and X-ray spectroscopy observations would be required, however, in order to perform a more rigorous comparison.
4.2 UV variability
As shown in the Swift UVOT light curve (Figures 1 and 4), WPVS 007 varies strongly in the UV on long as well as intermediate time scales.
As for the optical/UV we noticed a strong anti-correlation between the flux measured in the UV (M2 filter) and the optical/UV spectral slope . There are several ways to explain such an anti-correlation. For instance, (a) intrinsically by a change in the accretion rate and therefore , or (b) by a change in the reddening. As shown by Grupe et al. (2010), there is a clear correlation between the Eddington ratio and the UV spectral slope . If we estimate based on the extreme values of of about 1.1 and 0.7 we find ratios of 0.54 and 0.95, respectively. Alternatively, to cause a change in the optical/UV continuum as shown in Figure 9 only requires a change in the intrinsic by 0.06 mag. We note in passing that the UV absorption lines are outside the wavelength windows of the UVOT filters, and so we are insensitive to any changes in the UV absorption lines.
Dusty clouds in motion, passing our line-of-sight, may therefore be responsible for the observed UV variability. Dust does not survive temperatures higher than 1500K. The dust sublimation radius (of a dusty medium around the central black hole) can be estimated by the relation given in, e.g., Kishimoto et al. (2011) with where is the luminosity at 5500Å in units of W and the dust sublimation radius in units of pc. Using the optical spectra of WPVS 007 we can estimate the inner radius of the torus of the order of about 20 light days.
If we assume that WPVS 007 is similar in structure to a BAL QSO, then the wind of WPVS 007 has two components, a gaseous, dust free component that is responsible for the absorption in X-rays and the UV broad absorption lines, and a dusty component which is at larger radii with ld (0.05 pc). The broad line region gas on the other hand in WPVS 007 is located at = 5 ld following the relation by Kaspi et al. (2000). This is significantly smaller than the dust sublimation radius. (This, then, of course, can explain why we do see significant variability in the UV continuum, caused by dust, without affecting the photoionizing continuum that is seen by the BLR.)
At a distance of 20 ld, the velocity of the dust cloud around the central black hole will be of the order of 1000 km s-1. The UVOT light curves shown in Figure 4, in particular the light curves during the intensive daily monitoring campaign in September 2011, show that WPVS 007 can vary significantly within a few days. For a high AGN such as WPVS 007 we can reasonably assume a standard accretion disk. The temperature stratification of an disk is described in Frank et al. (2002) and in a more appropriate form for an AGN in Peterson (1997), eq. 3.20.
The central wavelength of the W2 filter in the UVOT is at 1923Å Breeveld et al. (2010) which is equivalent to a temperature of 75000K. If we assume that WPVS 007 accretes at =1 and that the mass of the central black hole is (Leighly et al., 2009), then the UV emission in the W2 filter is emitted at or m. Therefore, a dusty cloud needs roughly two weeks to cover the UV emitting region. This is consistent within the uncertainties with the variability time scale we see from the UVOT light curves (Figure 4), which suggest a time scale of about a week.
4.3 NIR spectroscopy
4.3.1 Emission lines
We have reported for the first time on NIR spectroscopy of WPVS 007. The NIR spectra display a variety of strong NIR emission lines as shown in Figure 8 and listed in Table 7. We compared our NIR spectra of WPVS 007 with NIR spectra of the AGN sample of Landt et al. (2008), and, in particular with the galaxies Mkn 335, Mkn 110, and PG 0844+349. This comparison shows that the NIR spectra of WPVS 007 are quite normal for a NLS1 galaxy. Although the Fe emission in WPVS 007 appears to be stronger than in Mkn 335 and PG 0844+349, it is not as strong as seen in Mkn 110 (see spectra shown in Landt et al., 2011).
4.3.2 Absorption lines
As discussed in Leighly et al. (2011) (also, e.g., Fig. 1 in Leighly et al., 2012), the observation of P V predicts the presence of absorption by He I*. Although this object is known to have particularly variable BALs, BAL variability is typically modest (e.g., Capellupo et al. 2012), so the IR and FUSE observations (September 2004 and November 2003, respectively) can be treated as roughly contemporaneous. In addition, the IR observation was performed after the FUSE observation. Therefore, it is probably reasonable to suppose that the outflow was still present for the IR observation, with roughly the same opacity profile. However, we see no evidence of the predicted He I absorption line in the IR spectrum.
We used the optical depth profile derived from the FUSE P V line (Leighly et al. 2009, Fig 4) to obtain an upper limit on the He I* apparent column density, using IRAF Specfit. The spectrum in the region of the He I* emission line was modeled using a power law continuum and several Lorentzian line profiles. Specifically, in the vicinity of the putative absorption, our model included the following emission lines: Fe II, H I, Fe II, He I*, H I, Fe II, and O I. We also included a tiny line located at . Before including absorption, the width of this line was , comparable to the other lines, and the equivalent width was Å. This line remains unidentified; it is quite near an unidentified line in Ark 564 near 1.0740 Å (Landt et al. 2008), but it is sufficiently far away to be a different line. The IR spectra of most of the other nearby Seyfert 1 galaxies published by Landt et al. 2008 generally show no emission lines between Fe II and ionHe1*. We included this unidentified line in our model, fixing the width and centroid, but leaving the normalization free.
Adding the absorption trough to the model, we estimated the upper limit in the He I* column density in two ways. First, we increased the normalization of the absorption line until the increases by 6.63 after refitting, appropriate for 99% confidence for one parameter of interest. This yielded a log He I* column density of 12.7 for both the case when the continuum only is absorbed, and when both the emission lines and continuum are absorbed.
We also evaluated the upper limit more conservatively by increasing the depth of the absorption until the difference between the refit model and the data was comparable to the error bars on the spectrum. This criterion can only be sensibly satisfied between the He I* emission line and the unidentified emission line, constraining our examination to the region of the absorption between to . As shown in Fig. 4 of Leighly et al. 2009, the optical depth is highest in this velocity range of the outflow. This procedure yielded a conservative upper limit on the log He I* column density of 12.9, with of 22.8 and 19.5 for absorbed continuum, and absorbed continuum plus lines, respectively. Both of these estimates are much lower than the log P V column of obtained by Leighly et al. (2009). The implications of this dramatic difference will be discussed by Cooper et al. (in prep.).
In the future, additional NIR spectra of WPVS 007 will allow us to see whether any NIR features (emission or absorption lines) varied.
4.4 Optical spectroscopic monitoring
Although WPVS 007 has exhibited extreme variability in X-rays as well as in the UV/optical continuum, we have shown that its optical emission lines did not exhibit any significant changes over the last two decades. This result implies, that the photoionizing continuum seen by the emission-line gas has not changed significantly over at least the last 20 years. We can therefore assume that the intrinsic spectral energy distribution of WPVS 007 has not changed much. This finding confirms the absorption scenario that we infer from our UV and X-ray observations of WPVS 007, and so most of the absorption just occurs along our line-of-sight.
5 Conclusions
We presented the results from our long-term monitoring campaign of WPVS 007 between October 2005 and July 2013. This has been the longest continuous Swift monitoring campaign of any AGN. Our main findings are as follows:
-
•
While remaining X-ray faint most of the time, WPVS 007 shows some remarkable fluctuations in X-ray flux during the Swift monitoring campaign between October 2005 and April 2013. During this period it has shown variability by factors of at least 30. In particular, it temporarily almost reached its initial ROSAT high state during one epoch in September 2009.
-
•
The X-ray weakness seen in WPVS 007 can be explained by X-ray absorption, due to partial covering with an absorber of varying column density. During the times when the AGN is not detectable in individual observations by the Swift XRT, this absorption is of the order of cm-2. The lower absorption column densities measured during the individual X-ray detections suggest that the strong X-ray variability is primarily caused by an absorber, most-likely an outflow in the line of sight which is consistent with the BALs found in the UV spectra of WPVS 007. Clumpiness in this flow might be the reason for the large-amplitude X-ray variability seen with Swift .
-
•
Applying an ionized partial covering absorber model to the X-ray data merged from all non-detections, implies that the column density and ionization parameter of the X-ray absorber is comparable with the absorber found from the UV FUSE spectra, suggesting a common origin.
-
•
WPVS 007 is one of the most variable AGN in the UV. This is especially unusual for a NLS1. The highest amplitude of UV variability amounts to 0.66 mag within two months.
-
•
The UV spectral variability might be caused by extinction by dusty clouds or a dusty wind. The scenario is consistent with clouds beyond the dust sublimation radius in WPVS 007 which is of the order of 20 ld (0.05 pc).
-
•
We presented NIR spectra for the first time of WPVS 007. The rich emission-line spectra show strong Fe emission lines, neutral and singly ionized. The NIR data also show MgII, O I, OIII, and He II emission lines. Emission-line ratios are not unusual for this class of AGN. Analyzing the NIR spectra showed that the absorption column densities derived from these data are significantly lower than what has been found from the UV and X-ray data.
-
•
New optical spectra obtained in 2011 and 2012 show that the strengths of the optical emission lines have not changed in comparison with optical data taken in the mid 1990s, implying that the underlying photoionizing continuum seen by the emission-line clouds has not changed over the last two decades.
-
•
WPVS 007 represents an important link between BAL QSOs and NLS1s. In particular, it is a low-luminosity, low-redshift AGN that exhibits BALs that are typically present only in high-luminosity quasars at higher redshifts. Timescales in WPVS 007 are therefore shorter, making this nearby AGN an important laboratory for understanding outflows in AGN, and in BAL QSOs in particular.
References
- Arnaud (1996) Arnaud, K. A., 1996, ASP Conf. Ser. 101: Astronomical Data Analysis Software and Systems V, 101, 17
- Bachev et al. (2009) Bachev, R., Grupe, D., Boeva, S., Ovcharov, E., Valcheva, A., Semkov, E., Georgiev, Ts., & Gallo, L.C., 2009, MNRAS, 399, 750
- Bans & Koenigl (2012) Bans, A., & Koenigl, A., 2012, ApJ, 758, 100
- Becker et al. (2000) Becker, R.H., et al., 2000, ApJ, 538, 72
- Bian et al (2010) Bian, W.-H., Huang, K., Hu, C., Yuan, Q.-R., Huang, K.-L., & Wang, J.-M., 2010, ApJ, 718, 460
- Boroson & Green (1992) Boroson, T.A., & Green, R.F., 1992, ApJS, 80, 109
- Boroson (2002) Boroson, T.A., 2002, ApJ, 565, 78
- Boroson (2011) Boroson, T.A., 2011, ApJ, 735, L14
- Brandt et al. (2000) Brandt, W.N., Laor, A., & Wills, B.J., 2000, ApJ, 528, 637
- Brandt & Gallagher (2000) Brandt, W.N., & Gallagher, S.C., 2000, New Astronomy Review 44, 461
- Breeveld et al. (2010) Breeveld, A.A., et al., 2010, MNRAS, 406, 1687
- Burrows et al. (2005) Burrows, D., et al., 2005, Space Science Reviews, 120, 165
- Capellupo et al. (2011) Capellupo, D.M., et al., 2011, MNRAS, 413, 908
- Cardelli et al. (1989) Cardelli, J.A., Clayton, G.C., Mathis, J.S., 1989, ApJ, 345, 245
- Cash (1979) Cash, W., 1979, ApJ, 228, 939
- Chiang et al. (2012) Chiang, C.-Y., Reis, R.C., Fabian, A.C., Grupe, D., & Tsuruta, S., 2012, MNRAS, 425, 1299
- Clemens et al. (2004) Clemens J. C., Crain J. A., Anderson R., 2004, in Moorwood A. F. M., Iye M., eds, SPIE Conf. Ser. Vol. 5492. Society of Photo-Optical Instrumentation Engineers Conf. Ser. The Goodman Spectrograph. SPIE, Bellingham, p. 331
- Crenshaw et al. (2004) Crenshaw, D., Kraemer, S., & Gabel, J., 2004, ASPC, 311, 235
- Cooper et al. (2013) Cooper, E.M., Leighly, K.M., Hamann, F., & Grupe, D., 2013, Proc. ”Nuclei of Seyfert Galaxies and QSOs - Central engine and conditions of star formation”,
- Dai et al. (2008) Dai, X., Shankar, F., & Sivakoff, G.R., 2008, ApJ, 672, 108
- Dauser et al. (2012) Dauser, T., Svoboda, J., Schartel, N., Wilms, J., Dovciak, M., Ehle, M., Karas, V., Santos-Lleó, M., & Marshall, H.L., 2012, MNRAS, 422, 1914
- Dietrich et al. (2009) Dietrich, M., et al., 2009, ApJ, 696, 1998
- DiPompeo et al. (2011) DiPompeo, M.A., Brotherton, M.S., De Breuck, C., & Laurent-Muehleisen, S., 2011, ApJ, 743, 71
- Done et al. (2012) Done, C., Davis, S.W., Jin, C., Blaes, O., & Ward, M., 2012, MNRAS, 420, 1848
- Dopita et al. (2007) Dopita, M., Hart, J., McGregor, P., et al. 2007, Ap&SS, 310, 255
- Dopita et al. (2010) Dopita, M., Rhee, J., Farage, C., et al. 2010, Ap&SS, 327, 245
- Dunn et al. (2008) Dunn, J.P., Crenshaw, D.M., S.B., Kraemer, & Trippe, M.L., 2008, AJ, 136, 1201
- Elvis (2000) Elvis, M., 2000, ApJ, 545, 63
- Fabian et al. (2012) Fabian, A.C., et al., 2012, MNRAS, 419, 116
- Frank et al. (2002) Frank, J., King, A., & Raine, D., 2002, “Accretion Power in Astrophysics”, Cambridge University Press, 3rd Edition
- Filiz Ak et al. (2012) Filiz Ak., N., et al., 2012, ApJ, 757, 114
- Gallo et al. (2004) Gallo, L.C., Boller, T., Fabian, A.C., & Grupe, D., 2004, MNRAS, 352, 744
- Gallo et al. (2011) Gallo, L. C.; Grupe, D.; Schartel, N.; Komossa, S.; Miniutti, G.; Fabian, A. C.; Santos-Lleo, M, 2011, MNRAS, 412, 161
- Gallo et al. (2013) Gallo, L.C., et al. 2013, MNRAS, 438, 1191
- Ganguly et al. (2007) Ganguly, R., Brotherton, M.S., Cales, S., Scoggins, B., Shang, Z., & Vestergaard, M., 2007, ApJ, 665, 990
- Garcia-Rissmann et al. (2012) Garcia-Rissmann, A., Rodriguez-Ardilla, A., Sigut, T.A.A., & Pradhan, A.K., 2012, ApJ, 751, 7
- Gehrels et al. (2004) Gehrels, N., et al., 2004, ApJ, 611, 1005
- Giannuzzo & Stirpe (1996) Giannuzzo, M.E., & Stirpe, G.M., 1996, A&A, 314, 419
- Gliozzi et al. (2010) Gliozzi, M., Papadakis, I.E., Grupe, D., Brinkmann, W.P., Raeth, C., & Kedziora-Chudcer, L., 2010, ApJ, 717, 1243
- Gliozzi et al. (2012) Gliozzi, M., Papadakis, I.E., Grupe, D., Brinkmann, W.P., & Raeth, C., , 2012, ApJ, submitted
- Goodrich (2000) Goodrich, R.W., 2000, New Astronomy reviews, Vol 44, 519
- Grupe (2004) Grupe, D., 2004, AJ, 127, 1799
- Grupe et al. (1995) Grupe, D., Beuermann, K., Mannheim, K., Thomas, H.-C., de Martino, D., & Fink, H.H., 1995, A&A, 300, L21
- Grupe et al. (1998) Grupe, D., Beuermann, K., Thomas, H.-C., Mannheim, K., & Fink, H.H., 1998, A&A 330, 25
- Grupe et al. (1999) Grupe, D., Beuermann, K., Mannheim, K., & Thomas, H.-C., 1999, A&A, 350, 805
- Grupe et al. (2000) Grupe, D., Leighly, K.M., Thomas, H.-C., & Laurent-Muehleisen, S.A., 2000, A&A, 356, 11
- Grupe et al. (2001) Grupe, D., Thomas, H.-C., & Beuermann, K., 2001, A&A, 367, 470
- Grupe & Thomas (2002) Grupe, D., & H.-C. Thomas, 2002, A&A, 386, 854
- Grupe et al. (2003) Grupe, D., Mathur, S., & Elvis, M., 2003, AJ, 126, 1159
- Grupe & Mathur (2004) Grupe, D., & Mathur, S., 2004, ApJ, 606, L41
- Grupe et al. (2007a) Grupe, D., Schady, P., Leighly, K.M., Komossa, S., O’Brien, P.T., & Nousek, J.A., 2007a, AJ, 133, 1988
- Grupe et al. (2007b) Grupe, D., Komossa, S., & Gallo, L.C., 2007b, ApJ, 668, L111
- Grupe et al. (2008a) Grupe, D., Komossa, S., Gallo, L.C., Fabian, A.C., Larsson, J., Pradhan, A.K., Xu, D., & Miniutti, G., 2008, ApJ, 681, 982
- Grupe et al. (2008b) Grupe, D., Leighly, K.M., & Komossa, S., 2008, AJ, 136, 2343
- Grupe et al. (2010) Grupe, D., Komossa, S., Leighly, K.M., & Page, K.L., 2010, ApJS, 187,64
- Grupe et al. (2012) Grupe, D., Komossa, S., Gallo, L.C., Longinotti, A.L., Fabian, A.C., Pradhan, A.K., Gruberbauer, M, & Xu, D., 2012, ApJS, 199, 28
- Hamann et al. (2008) Hamann, F., Kaplan, K.F., Rodriguez Hildago, P., Prochaska, J.X., & Herbert-Fort, S., 2008, MNRAS, 391, L39
- Hill et al. (2004) Hill, J.E., et al., 2004, SPIE, 5165, 217
- Inoue et al. (2011) Inoue, H., Miyakawa, T., Ebisawa, K., 2011, PASJ, 63, 669
- Jones et al. (2004) Jones, D.H., et al., 2004, MNRAS, 355, 747
- Jones et al. (2009) Jones, D.H., et al., 2009, MNRAS, 399, 683
- Just et al. (2007) Just, D.., Brandt, W.N., Shemmer, O., Steffen, A.T., Schneider, D.P., Chartas, G, & Garmire, G.P., 2007, ApJ,665, 1004
- Kaspi et al. (2000) Kaspi, S., Smith, P. S., Netzer, H., Maoz, D., Jannuzi, B. T., & Giveon, U., 2000, ApJ, 533, 631
- Kishimoto et al. (2011) Kishimoto, M.; Hoenig, S. F.; Antonucci, R.; Millour, F.; Tristram, K. R. W.; Weigelt, G., 2011, A&A, 536, 78
- Klimek et al. (2004) Klimek, E.S., Gaskell, C.M., & Hedrick, C.H., 2004, ApJ, 609, 69
- Kollatschny et al. (1981) Kollatschny, W., Fricke. K.J., Schleicher, H., & Yorke, H.W., 1981, A&A, 102, L23
- Kolltaschny & Fricke (1985) Kollatschny, W., & Fricke, K.J., 1985, A&A, 146, L11
- Kollatschny et al. (2000) Kollatschny, W., Bischoff, K., & Dietrich, M., 2000, A&A, 361, 901
- Komossa (2008) Komossa, S., 2008, RMxAC, 32, 86
- Komossa et al. (2008a) Komossa, S., et al., 2008a, ApJ, 678, L13
- Komossa et al. (2008b) Komossa, S., et al., 2008b, ApJ, 680, 926
- Kraft et al. (1991) Kraft, R.P., Burrows, D.N., & Nousek, J.A., 1991, ApJ, 374, 344
- Kurasawa & Proga (2009a) Kurasawa, R., & Proga, D., 2009a, ApJ, 693, 1929
- Kurasawa & Proga (2009b) Kurasawa, R., & Proga, D., 2009b, MNRAS, 397, 1791
- Landt et al. (2008) Landt, H., Bentz, M.C., Ward, M.J., Elvis, M., Peterson, B.M., Korista, K.T., & Karovska, M., 2008, ApJS, 174, 282
- Landt et al. (2011) Landt, H., Elvis, M., Ward, M.J., Bentz, M.C., Korista, K.T., & Karovska, M., 2011, MNRAS, 414, 218
- Laor & Brandt (2002) Laor, A., & Brandt, W.N., 2002, ApJ, 569, 641
- Leighly et al. (2007a) Leighly, K.M., Halpern, J.P., Jenkins, E.B., Grupe, D., Choi, J., & Prescott, K.B., 2007, ApJ, 663, 103
- Leighly et al. (2007b) Leighly, K.M., Halpern, J.P., Jenkins, E.B., & Casebeer, D., 2007, ApJS, 173, 1
- Leighly et al. (2009) Leighly, K.M., Hamann, F., Casebeer, D.A., & Grupe, D., 2009, ApJ, 701, 176
- Leighly et al. (2011) Leighly, K. M., Dietrich, M., & Barber, S., 2011, ApJ, 728, 94
- Leighly et al. (2012) Leighly, K. M., Lucy, A. B., Dietrich, M., Terndrup, D., & Gallagher, S. C., 2012, in Proc. ”AGN Winds in Charleston”, Eds. G. Chartas, F. Hamann, & K. M. Leighly (San Francisco: Astronomical Society of the Pacific), p. 72
- Lobban et al (2011) Lobban, A. P., Reeves, J. N., Miller, L., Turner, T. J., Braito, V., Kraemer, S. B., & Crenshaw, D. M., 2011, MNRAS, 414, 1965
- Lohfink et al. (2012) Lohfink, A.M., Reynolds, C.S., Miller, J.M., Brenneman, L.W., Mushotzky, R.F., Nowak, M.A., & Fabian, A.C., 2012, ApJ, 758, 67
- Longinotti et al. (2013) Longinotti, A.L., et al., 2013, ApJ, 766, 104
- Marziani et al. (2009) Marziani, P., et al., 2009, A&A, 495, 83
- Mathur (2000) Mathur, S., 2000, MNRAS, 314, L17
- Miller et al. (2010) Miller, L., Turner, J.T., Reeves, J.N., & Braito, V., 2010, MNRAS, 408, 1928
- Miniutti et al. (2012) Miniutti, G., Brandt, W.N., Schneider, D.P., Fabian, A.C., Gallo, L.C., & Boller, T., 2012, MNRAS, accepted, arXiv:1207:0694v1
- Osterbrock & Pogge (1985) Osterbrock, D.E., & Pogge, R.W., 1985, ApJ, 297, 166
- Peterson (1997) Peterson, B.M., 1997, “Active Galactic Nuclei”, Cambridge University Press
- Pfeffermann et al. (1986) Pfeffermann E., Briel U.G., Hippmann H., et al., 1986, SPIE 733, 519
- Park et al. (2006) Park, T., Kashyap, V.L., Siemiginowska, A., van Dyk, D.A., Zezas, A., Heinke, C., & Wargelin, B.J., 2006, ApJ, 652, 610
- Poole et al. (2008) Poole, T.S., et al., 2008, MNRAS, 383, 627
- Proga & Kallman (2004) Proga, D., & Kallman, T.R., 2004, ApJ, 616, 688
- Ralchenko et al. (2011) Ralchenko, Y., Kramida, A.E., Reader, J., and NIST ASD Team, 2011, NIST Atomic Spectra Database (ver. 4.1.0), [Online]. Available: http://physics.nist.gov/asd National Institute of Standards and Technology, Gaithersburg, MD.
- Reeves et al. (2008) Reeves, J., et al., 2008, MNRAS, 385, L108
- Reynolds & Nowak (2003) Reynolds, C.S., & Nowak, M.A., 2003, Physics Reports, 377, 6, 389
- Rodriguez-Ardila et al. (2011) Rodriguez-Ardila, A., Prieto, M.A., Portilla, J.G., & Tejeiro, J.M., 2011, ApJ, 743, 100
- Roming et al. (2005) Roming, P.W.A., et al., 2005, Space Science Reviews, 120, 95
- Roming et al. (2009) Roming, P.W.A., et al., 2009, ApJ, 690, 163
- Saez et al. (2012) Saez, C., Brandt, W.N., Gallagher, S.C., Bauer, F.E., & Garmire, G.P., 2012, ApJ, 759, 42
- Schartel et al. (2010) Schartel, N., Rodríguez-Pascual, P. M., Santos-Lleó, M., Jiménez-Bailón, E., Ballo, L.; Piconcelli, E. 2010, A&A, 512, 75
- Schartel et al (2013) Schartel, N., Grupe, D, Santos-Lleó, M., Komossa, S., Gallo, L.C., Fabian, A.C., & Miniutti, G., 2013, A&A, letter, submitted
- Schlegel et al. (1998) Schlegel, D. J., Finkbeiner, D. P., & Davis, M. 1998, ApJ, 500, 525
- Schwope et al. (2000) Schwope, A.D., et al., 2000, Astronomische Nachrichten, 321, 1
- Shapovalova et al. (2012) Shapovalova, A.I., et al., 2012, ApJS, 202, 10
- Strateva et al. (2005) Strateva, I.V., Brandt, W.N., Schneider, D.P., Vanden Berk, D.G., & Vignali, C., 2005, AJ, 130, 387
- Sulentic et al. (2000) Sulentic, J.W., Zwitter, T., Marziani, P., & Dultzin-Hacyan, D., 2000, ApJ, 536, L5
- Tananbaum et al. (1979) Tananbaum, H., et al., 1979, ApJ, 234, L9
- Vaughan et al. (2004) Vaughan, S., Edelson, R., & Warwick, R.S., 2004, MNRAS, 349, L1
- Vestergaard & Peterson (2005) Vestergaard, M., & Peterson, B.M., 2005, ApJ, 625, 688
- Voges et al. (1999) Voges, W., Aschenbach, B., Boller, T., et al., 1999, A&A, 349, 389
- Wamsteker et al. (1985) Wamsteker, W., Prieto A., Vitores, A., Schuster, H.E., Danks, A.C., Gonzalez R., & Rodriguez, G., 1985, A&AS, 62, 255
- Weymann et al. (1991) Weymann, R.J., Morris, L., Foltz, C.B., & Hewitt, P.C., 1991, ApJ, 373, 23
- Williams et al. (2002) Williams, R.J., Pogge, R.W., & Mathur, S., 2002, AJ, 124, 3042
- Williams et al. (2004) Williams, R.J., Mathur, S., & Pogge, R.W., 2004, ApJ, 610, 737
- Wright (2006) Wright, E.L., 2006, PASP, 118, 1711
- Wu et al. (2011) Wu, J., et al., 2011, ApJ, 736, 28
- Xu et al. (2012) Xu, D., et al., 2012, AJ, 143, 83


| ObsID | Segment | T-start22Start and end times are given in UT | T-stop22Start and end times are given in UT | MJD | 33Observing time given in s | 33Observing time given in s | 33Observing time given in s | 33Observing time given in s | 33Observing time given in s | 33Observing time given in s | 33Observing time given in s |
|---|---|---|---|---|---|---|---|---|---|---|---|
| 30334 | 030 | 2008-01-12 17:56 | 2008-01-12 22:55 | 54477.85 | 1528 | 144 | 156 | 156 | 310 | 260 | 623 |
| 031 | 2008-06-19 00:03 | 2008-06-19 06:42 | 54636.14 | 3753 | 334 | 334 | 334 | 668 | 874 | 1337 | |
| 032 | 2008-07-19 15:28 | 2008-07-19 17:28 | 54666.69 | 2140 | 176 | 176 | 176 | 352 | 443 | 704 | |
| 033 | 2008-08-16 02:28 | 2008-08-16 05:57 | 54694.18 | 1854 | 153 | 153 | 153 | 306 | 383 | 614 | |
| 034 | 2008-09-21 09:11 | 2008-09-21 12:27 | 54730.45 | 546 | 36 | 114 | 346 | 21 | |||
| 035 | 2008-10-03 13:41 | 2008-10-03 18:41 | 54742.67 | 2046 | 214 | 214 | 214 | 428 | 350 | 653 | |
| 036 | 2008-10-17 16:26 | 2008-10-17 16:34 | 54756.69 | 452 | 41 | 41 | 41 | 83 | 74 | 165 | |
| 037 | 2008-10-21 05:22 | 2008-10-21 07:21 | 54760.27 | 2721 | 230 | 230 | 230 | 460 | 587 | 921 | |
| 038 | 2008-11-23 00:27 | 2008-11-23 03:52 | 54793.10 | 2125 | 153 | 197 | 197 | 395 | 308 | 790 | |
| 039 | 2008-12-21 14:25 | 2008-12-21 16:21 | 54821.64 | 2330 | 215 | 215 | 215 | 430 | 334 | 862 | |
| 040 | 2008-12-27 00:25 | 2008-12-27 03:52 | 54827.09 | 2863 | 241 | 242 | 242 | 484 | 601 | 968 | |
| 041 | 2008-12-28 00:33 | 2008-12-28 07:00 | 54828.16 | 1081 | 71 | 71 | 71 | 389 | 164 | 283 | |
| 042 | 2008-12-29 02:16 | 2008-12-29 07:05 | 54829.19 | 47 | 47 | ||||||
| 043 | 2009-01-16 00:50 | 2009-01-16 02:43 | 54847.08 | 2011 | 166 | 166 | 166 | 332 | 459 | 665 | |
| 044 | 2009-02-19 21:56 | 2009-02-19 23:49 | 54881.95 | 2131 | 181 | 181 | 178 | 359 | 448 | 724 | |
| 045 | 2009-02-25 07:57 | 2009-02-25 22:39 | 54887.64 | 7042 | 583 | 583 | 622 | 1299 | 1341 | 2337 | |
| 046 | 2009-03-19 17:57 | 2009-03-19 23:09 | 54909.85 | 2808 | 237 | 237 | 237 | 474 | 586 | 948 | |
| 047 | 2009-04-16 00:03 | 2009-04-16 01:45 | 54937.03 | 1587 | 141 | 141 | 141 | 283 | 395 | 567 | |
| 048 | 2009-05-21 19:33 | 2009-05-21 22:52 | 54972.88 | 2343 | 197 | 197 | 197 | 395 | 483 | 790 | |
| 90108 | 001 | 2009-06-18 20:36 | 2009-06-18 22:31 | 55000.90 | 2144 | 176 | 176 | 176 | 352 | 502 | 704 |
| 002 | 2009-07-19 18:31 | 2009-07-19 20:24 | 55031.80 | 2697 | 171 | 171 | 171 | 342 | 330 | 685 | |
| 003 | 2009-07-21 01:03 | 2009-07-21 01:08 | 55033.04 | 281 | 277 | ||||||
| 004 | 2009-08-19 00:38 | 2009-08-19 02:36 | 55062.07 | 2084 | 176 | 176 | 176 | 352 | 436 | 704 | |
| 005 | 2009-09-17 01:31 | 2009-09-19 03:22 | 55091.09 | 1818 | 151 | 151 | 151 | 303 | 410 | 606 | |
| 006 | 2009-09-23 00:39 | 2009-09-23 05:45 | 55097.15 | 6266 | 6202 | ||||||
| 007 | 2009-10-15 19:05 | 2009-10-15 20:50 | 55119.83 | 1875 | 156 | 156 | 156 | 313 | 396 | 626 | |
| 008 | 2009-11-19 17:11 | 2009-11-19 23:48 | 55154.85 | 2799 | 230 | 230 | 230 | 461 | 586 | 924 | |
| 009 | 2009-12-17 06:46 | 2009-12-17 10:11 | 55182.35 | 2621 | 217 | 217 | 217 | 434 | 567 | 869 | |
| 010 | 2010-01-21 00:34 | 2010-01-21 02:23 | 55217.06 | 1882 | 176 | 176 | 176 | 352 | 228 | 704 | |
| 011 | 2010-02-18 11:19 | 2010-02-18 13:08 | 55245.51 | 2007 | 171 | 171 | 171 | 342 | 403 | 685 | |
| 012 | 2010-03-18 08:59 | 2010-03-18 11:05 | 55273.42 | 2002 | 166 | 166 | 166 | 332 | 456 | 665 | |
| 90331 | 001 | 2010-04-05 00:49 | 2010-04-05 04:29 | 55291.11 | 2848 | 235 | 235 | 235 | 470 | 663 | 941 |
| 002 | 2010-04-05 02:28 | 2010-04-05 06:10 | 55291.18 | 2234 | 2215 | ||||||
| 003 | 2010-05-04 00:29 | 2010-05-04 03:59 | 55320.09 | 3090 | 251 | 251 | 251 | 503 | 722 | 1007 | |
| 004 | 2010-05-04 05:18 | 2010-05-04 07:12 | 55320.26 | 2040 | 2019 | ||||||
| 005 | 2010-05-12 17:12 | 2010-05-12 23:45 | 55328.85 | 4163 | 339 | 338 | 339 | 678 | 935 | 1357 | |
| 006 | 2010-05-18 03:22 | 2010-05-18 08:42 | 55334.20 | 4417 | 302 | 430 | 430 | 861 | 666 | 1602 | |
| 007 | 2010-05-26 00:47 | 2010-05-26 05:58 | 55342.14 | 4927 | 430 | 430 | 430 | 861 | 1239 | 1723 | |
| 008 | 2010-06-02 09:24 | 2010-06-02 14:32 | 55349.50 | 4315 | 361 | 361 | 361 | 723 | 903 | 1448 | |
| 009 | 2010-06-03 14:25 | 2010-06-03 21:18 | 55349.75 | 3239 | 319 | 319 | 319 | 389 | 946 | 1074 | |
| 010 | 2010-06-04 01:48 | 2010-06-04 06:47 | 55351.08 | 5110 | 425 | 425 | 425 | 851 | 1222 | 1704 | |
| 011 | 2010-06-05 16:13 | 2010-06-05 22:55 | 55352.81 | 3603 | 337 | 337 | 337 | 738 | 932 | 1350 | |
| 012 | 2010-06-06 00:15 | 2010-06-06 06:52 | 55353.15 | 4994 | 407 | 407 | 407 | 816 | 1159 | 1633 | |
| 013 | 2010-06-07 11:36 | 2010-06-07 18:16 | 55354.60 | 5155 | 358 | 358 | 358 | 717 | 1755 | 1435 | |
| 014 | 2010-06-08 02:06 | 2010-06-08 07:12 | 55355.20 | 3583 | 301 | 301 | 301 | 602 | 788 | 1204 | |
| 015 | 2010-06-09 15:04 | 2010-06-09 20:14 | 55356.73 | 4906 | 415 | 416 | 415 | 832 | 1162 | 1664 | |
| 016 | 2010-06-10 12:15 | 2010-06-10 17:14 | 55357.62 | 3594 | 185 | 415 | 416 | 832 | 442 | 1201 | |
| 017 | 2010-06-11 04:02 | 2010-06-11 07:42 | 55357.24 | 5029 | 414 | 414 | 414 | 828 | 1182 | 1657 | |
| 018 | 2010-06-12 10:33 | 2010-06-12 15:43 | 55359.55 | 4887 | 396 | 396 | 396 | 792 | 1172 | 1586 | |
| 019 | 2010-06-13 09:07 | 2010-06-13 14:08 | 55360.48 | 5333 | 440 | 440 | 440 | 881 | 1216 | 1763 | |
| 020 | 2010-06-14 09:22 | 2010-06-14 15:55 | 55361.52 | 4652 | 381 | 381 | 381 | 763 | 1084 | 1527 | |
| 021 | 2010-06-15 10:49 | 2010-06-15 17:32 | 55362.59 | 5020 | 407 | 407 | 407 | 816 | 1169 | 1633 | |
| 022 | 2010-06-16 10:57 | 2010-06-16 24:00 | 55363.73 | 4900 | 404 | 404 | 404 | 810 | 969 | 1624 | |
| 023 | 2010-06-17 08:08 | 2010-06-17 22:50 | 55364.65 | 5570 | 452 | 452 | 452 | 904 | 1328 | 1810 | |
| 024 | 2010-06-18 14:24 | 2010-06-18 22:56 | 55365.78 | 5335 | 437 | 437 | 437 | 875 | 1214 | 1750 | |
| 025 | 2010-06-19 15:58 | 2010-06-19 23:02 | 55366.81 | 5732 | 452 | 452 | 452 | 904 | 1489 | 1810 | |
| 026 | 2010-06-20 17:48 | 2010-06-21 00:32 | 55367.89 | 5118 | 420 | 420 | 420 | 842 | 1188 | 1684 | |
| 027 | 2010-06-21 17:51 | 2010-06-21 23:07 | 55368.85 | 6009 | 450 | 450 | 450 | 901 | 1812 | 1802 | |
| 028 | 2010-06-22 13:01 | 2010-06-22 18:17 | 55369.65 | 4848 | 396 | 396 | 396 | 792 | 1127 | 1586 | |
| 029 | 2010-06-29 02:44 | 2010-06-29 17:24 | 55376.40 | 4288 | 350 | 350 | 350 | 701 | 979 | 1404 | |
| 030 | 2010-07-06 14:18 | 2010-07-06 21:01 | 55383.74 | 5218 | 427 | 427 | 427 | 855 | 1188 | 1711 | |
| 30334 | 049 | 2010-07-07 20:54 | 2010-07-08 02:04 | 55384.98 | 4678 | 4849 | |||||
| 90331 | 031 | 2010-07-13 00:29 | 2010-07-13 08:28 | 55390.19 | 4111 | 348 | 348 | 348 | 698 | 836 | 1397 |
| 032 | 2010-07-19 01:04 | 2010-07-19 09:21 | 55396.22 | 5146 | 423 | 423 | 424 | 849 | 1150 | 1699 | |
| 033 | 2010-08-25 17:06 | 2010-08-25 20:41 | 55433.79 | 4190 | 345 | 345 | 345 | 690 | 967 | 1381 | |
| 034 | 2010-09-21 11:39 | 2010-09-21 21:45 | 55460.69 | 3516 | 297 | 297 | 297 | 596 | 707 | 1192 | |
| 035 | 2010-09-22 14:59 | 2010-09-22 16:40 | 55461.66 | 1470 | 1468 | ||||||
| 036 | 2010-10-19 07:35 | 2010-10-19 11:17 | 55488.39 | 5111 | 433 | 433 | 433 | 867 | 1155 | 1736 | |
| 037 | 2010-11-20 01:06 | 2010-11-20:07:56 | 55520.15 | 5449 | 447 | 447 | 447 | 895 | 1255 | 1790 | |
| 038 | 2010-12-18 05:02 | 2010-12-18 08:44 | 55548.29 | 5103 | 419 | 419 | 419 | 838 | 1225 | 1676 | |
| 039 | 2011-01-19 01:26 | 2011-01-19 09:51 | 55580.24 | 4571 | 465 | 465 | 465 | 930 | 1237 | 1861 | |
| 040 | 2011-02-18 09:04 | 2011-02-18 14:07 | 55610.48 | 5224 | 415 | 415 | 414 | 830 | 1339 | 1660 | |
| 041 | 2011-03-19 00:08 | 2011-03-19 02:12 | 55639.04 | 3103 | 264 | 264 | 264 | 528 | 769 | 1059 | |
| 91017 | 001 | 2011-04-17 15:31 | 2011-04-17 19:02 | 55668.72 | 3092 | 251 | 251 | 251 | 503 | 730 | 1007 |
| 002 | 2011-04-17 20:26 | 2011-04-17 22:15 | 55668.89 | 2026 | 2009 | ||||||
| 003 | 2011-05-17 00:16 | 2011-05-17 05:37 | 55698.10 | 4213 | 338 | 338 | 338 | 677 | 729 | 1348 | |
| 004 | 2011-06-17 12:41 | 2011-06-17 17:49 | 55729.64 | 4844 | 394 | 394 | 394 | 591 | 1144 | 1183 | |
| 005 | 2011-07-19 04:08 | 2011-07-19 04:27 | 55761.18 | 1118 | 90 | 90 | 90 | 181 | 239 | 362 | |
| 006 | 2011-07-23 12:13 | 2011-07-23 15:50 | 55765.58 | 4750 | 4708 | ||||||
| 007 | 2011-08-18 01:14 | 2011-08-18 16:32 | 55791.38 | 3277 | 274 | 274 | 274 | 549 | 763 | 1098 | |
| 008 | 2011-09-01 05:51 | 2011-09-01 17:45 | 55805.49 | 5377 | 429 | 429 | 429 | 659 | 1019 | 1316 | |
| 009 | 2011-09-02 09:18 | 2011-09-02 17:20 | 55806.56 | 3444 | 275 | 275 | 275 | 550 | 855 | 1101 | |
| 010 | 2011-09-03 07:39 | 2011-09-03 12:47 | 55807.42 | 4544 | 369 | 369 | 369 | 735 | 1140 | 1473 | |
| 011 | 2011-09-04 10:58 | 2011-09-04 12:49 | 55808.49 | 2280 | 185 | 185 | 182 | 179 | 246 | 358 | |
| 012 | 2011-09-05 01:43 | 2011-09-05 22:51 | 55809.51 | 4588 | 366 | 366 | 366 | 735 | 1084 | 1472 | |
| 013 | 2011-09-06 09:26 | 2011-09-06 22:55 | 55810.65 | 5036 | 399 | 400 | 400 | 802 | 1239 | 1605 | |
| 014 | 2011-09-07 00:12 | 2011-09-07 18:11 | 55811.38 | 4745 | 388 | 388 | 388 | 586 | 1034 | 1554 | |
| 015 | 2011-09-08 14:30 | 2011-09-08 22:43 | 55812.77 | 4999 | 408 | 408 | 445 | 893 | 1077 | 1634 | |
| 016 | 2011-09-09 16:09 | 2011-09-09 19:53 | 55813.75 | 5078 | 413 | 413 | 413 | 826 | 1236 | 1653 | |
| 017 | 2011-09-10 16:16 | 2011-09-10 19:57 | 55814.75 | 4987 | 406 | 407 | 407 | 546 | 1229 | 1626 | |
| 018 | 2011-09-11 16:20 | 2011-09-11 20:02 | 55815.76 | 5032 | 412 | 412 | 412 | 825 | 1236 | 1650 | |
| 019 | 2011-09-12 16:25 | 2011-09-12 20:06 | 55816.76 | 4304 | 281 | 412 | 412 | 930 | 838 | 839 | |
| 020 | 2011-09-13 16:30 | 2011-09-13 20:10 | 55817.76 | 5027 | 420 | 420 | 420 | 840 | 1163 | 1679 | |
| 021 | 2011-09-14 14:58 | 2011-09-14 18:40 | 55818.70 | 5186 | 434 | 433 | 433 | 578 | 773 | 1735 | |
| 022 | 2011-09-15 17:07 | 2011-09-15 18:45 | 55819.75 | 152 | 66 | ||||||
| 023 | 2011-09-16 15:09 | 2011-09-16 18:50 | 55820.71 | 5029 | 407 | 407 | 407 | 811 | 1258 | 1623 | |
| 024 | 2011-09-17 16:51 | 2011-09-17 22:08 | 55821.81 | 4938 | 397 | 397 | 397 | 795 | 1234 | 1592 | |
| 025 | 2011-09-18 01:09 | 2011-09-18 09:12 | 55822.22 | 5201 | 427 | 427 | 427 | 732 | 1184 | 1470 | |
| 026 | 2011-09-19 00:57 | 2011-09-19 06:03 | 55823.15 | 4195 | 350 | 350 | 350 | 512 | 930 | 1024 | |
| 027 | 2011-09-20 04:21 | 2011-09-20 17:27 | 55824.45 | 4541 | 391 | 391 | 391 | 783 | 937 | 1566 | |
| 028 | 2011-09-21 01:09 | 2011-09-21 04:50 | 55825.12 | 3172 | 419 | 419 | 419 | 559 | 1085 | 1677 | |
| 029 | 2011-09-22 01:17 | 2011-09-22 12:59 | 55826.31 | 4598 | 379 | 379 | 379 | 759 | 1056 | 1518 | |
| 030 | 2011-09-23 01:29 | 2011-09-23 13:05 | 55827.30 | 4650 | 379 | 379 | 379 | 760 | 1105 | 1520 | |
| 031 | 2011-09-24 01:28 | 2011-09-24 19:36 | 55828.44 | 4860 | 394 | 394 | 394 | 787 | 1200 | 1576 | |
| 032 | 2011-09-25 03:11 | 2011-09-25 18:05 | 55829.45 | 3808 | 264 | 356 | 367 | 872 | 799 | 1061 | |
| 033 | 2011-09-26 01:40 | 2011-09-26 18:10 | 55830.41 | 4792 | 392 | 392 | 392 | 787 | 752 | 1572 | |
| 034 | 2011-09-27 03:21 | 2011-09-27 13:27 | 55831.43 | 4367 | 365 | 365 | 365 | 730 | 956 | 1460 | |
| 035 | 2011-09-28 19:37 | 2011-09-28 23:16 | 55832.89 | 4819 | 409 | 279 | 409 | 818 | 694 | 1637 | |
| 036 | 2011-09-29 00:17 | 2011-09-29 03:53 | 55833.08 | 4561 | 384 | 384 | 384 | 500 | 645 | 1000 | |
| 037 | 2011-09-30 02:07 | 2011-09-30 21:40 | 55834.51 | 4768 | 396 | 396 | 396 | 720 | 965 | 1440 | |
| 038 | 2011-10-18 03:12 | 2011-10-18 16:22 | 55852.41 | 3674 | 340 | 340 | 340 | 289 | 740 | 579 | |
| 039 | 2011-11-17 13:46 | 2011-11-17 17:27 | 55882.65 | 4967 | 397 | 397 | 397 | 795 | 1275 | 1591 | |
| 040 | 2011-12-17 04:23 | 2011-12-17 09:36 | 55912.29 | 4200 | 347 | 347 | 347 | 693 | 950 | 1387 | |
| 041 | 2012-01-17 09:53 | 2012-01-17 15:01 | 55943.52 | 2031 | 192 | 192 | 192 | 383 | 372 | 767 | |
| 042 | 2012-01-20 08:28 | 2012-01-20 13:34 | 55946.46 | 4250 | 348 | 347 | 348 | 696 | 980 | 1390 | |
| 043 | 2012-02-17 00:31 | 2012-02-17 23:21 | 55974.50 | 5209 | 425 | 421 | 425 | 849 | 1211 | 1701 | |
| 044 | 2012-03-17 02:43 | 2012-03-17 12:44 | 56003.31 | 4453 | 246 | 410 | 410 | 821 | 911 | 1493 | |
| 30334 | 050 | 2012-04-21 00:05 | 2012-04-21 14:59 | 56038.31 | 1935 | 1976 | |||||
| 051 | 2012-05-19 16:09 | 2012-05-19 19.39 | 56066.75 | 2170 | 2151 | ||||||
| 052 | 2012-06-16 09:45 | 2012-06-16 19:51 | 56094.62 | 1661 | 1647 | ||||||
| 053 | 2012-07-14 16:21 | 2012-07-14 21:20 | 56122.79 | 1933 | 1905 | ||||||
| 054 | 2012-08-11 00:23 | 2012-08-11 21:24 | 56150.44 | 1883 | 1958 | ||||||
| 055 | 2012-09-08 06:30 | 2012-09-08 08:00 | 56178.30 | 1875 | 1865 | ||||||
| 056 | 2012-10-06 20:46 | 2012-10-06 22:20 | 56206.89 | 1998 | 1978 | ||||||
| 057 | 2012-11-03 06:10 | 2012-11-03 15:51 | 56234.48 | 1883 | 1866 | ||||||
| 058 | 2012-12-01 05:57 | 2012-12-01 12:24 | 56262.38 | 1953 | 1930 | ||||||
| 059 | 2012-12-29 13:18 | 2012-12-29 15:10 | 56290.59 | 2370 | 2345 | ||||||
| 060 | 2013-01-26 03:26 | 2013-01-26 05:17 | 56318.18 | 1923 | 1909 | ||||||
| 062 | 2013-02-27 06:22 | 2013-02-27 08:07 | 56350.30 | 1968 | 1954 | ||||||
| 063 | 2013-03-23 10:44 | 2013-03-23 12:39 | 56374.49 | 1943 | 1939 | ||||||
| 064 | 2013-04-20 00:26 | 2013-04-20 05:26 | 56402.12 | 2577 | 2604 | ||||||
| 065 | 2013-05-18 00:06 | 2013-05-18 03:25 | 56430.08 | 1771 | 1835 | ||||||
| 066 | 2013-06-01 17:42 | 2013-06-01 19:34 | 56444.77 | 1678 | 136 | 136 | 136 | 274 | 414 | 550 | |
| 067 | 2013-06-02 20:59 | 2013-06-02 23:02 | 56445.92 | 2335 | 192 | 193 | 192 | 384 | 544 | 770 | |
| 068 | 2013-06-03 09:48 | 2013-06-03 23:04 | 56446.69 | 2465 | 197 | 197 | 197 | 396 | 624 | 792 | |
| 069 | 2013-06-04 19:40 | 2013-06-04 21:32 | 56447.85 | 1913 | 151 | 151 | 151 | 304 | 474 | 609 | |
| 070 | 2013-06-05 08:30 | 2013-06-05 16:46 | 56448.53 | 1900 | 151 | 151 | 151 | 303 | 473 | 605 | |
| 071 | 2013-06-06 13:23 | 2013-06-06 16:43 | 56449.63 | 1973 | 160 | 160 | 160 | 320 | 454 | 640 | |
| 072 | 2013-06-07 08:39 | 2013-06-07 10:26 | 56450.40 | 1321 | 65 | 154 | 154 | 309 | 47 | 551 | |
| 073 | 2013-06-08 11:43 | 2013-06-08 13:38 | 56451.53 | 1943 | 160 | 160 | 160 | 320 | 429 | 641 | |
| 074 | 2013-06-09 19:47 | 2013-06-09 21:39 | 56452.87 | 1518 | 125 | 140 | 140 | 282 | 218 | 563 | |
| 075 | 2013-06-10 21:28 | 2013-06-10 23:18 | 56453.93 | 1638 | 139 | 139 | 139 | 140 | 330 | 561 | |
| 076 | 2013-06-15 12:04 | 2013-06-15 13:58 | 56458.54 | 1980 | 1975 | ||||||
| 077 | 2013-07-13 03:22 | 2013-07-13 22:56 | 56486.48 | 1895 | 1884 |
| ObsID | Segment | MJD | V | B | U | UVW1 | UVM2 | UVW2 | |
|---|---|---|---|---|---|---|---|---|---|
| 30334 | 001 | 53663.15 | 14.110.03 | 14.110.03 | 14.210.03 | ||||
| 002 | 53711.57 | 14.190.03 | 14.160.03 | 14.280.03 | |||||
| 003 | 53740.16 | 14.110.03 | 14.100.03 | 14.250.03 | |||||
| 004 | 53947.23 | 15.190.04 | 15.490.03 | 14.440.03 | 14.320.03 | 14.300.04 | 14.510.02 | 0.950.11 | |
| 005 | 53984.42 | 15.080.05 | 15.380.02 | 14.290.02 | 14.140.02 | 14.060.03 | 14.230.03 | 0.780.09 | |
| 006 | 53989.28 | 15.110.03 | 15.390.03 | 14.310.03 | 14.130.03 | 14.080.03 | 14.220.03 | 0.770.08 | |
| 007 | 54035.54 | 15.090.03 | 15.380.02 | 14.320.03 | 14.140.03 | 14.120.03 | 14.210.03 | 0.800.07 | |
| 008 | 54075.14 | 15.170.03 | 15.490.03 | 14.420.03 | 14.320.03 | 14.310.04 | 14.420.03 | 0.920.08 | |
| 009 | 54081.03 | 15.150.04 | 15.480.03 | 14.610.03 | 14.350.03 | 14.350.03 | 14.570.03 | 1.010.03 | |
| 010 | 54090.30 | 15.220.04 | 15.580.03 | 14.530.03 | 14.480.03 | 14.380.03 | 14.600.03 | 1.000.09 | |
| 011 | 54110.04 | 15.200.05 | 15.430.03 | 14.350.05 | 14.250.05 | 14.150.04 | 14.300.05 | 0.780.09 | |
| 012 | 54296.40 | 14.630.06 | 14.390.05 | 14.470.04 | 14.650.05 | ||||
| 013 | 54299.81 | 14.560.03 | 14.410.03 | 14.450.03 | 14.560.03 | ||||
| 014 | 54322.59 | 14.450.06 | 14.240.05 | 14.250.06 | 14.410.06 | ||||
| 028 | 54413.06 | 15.370.04 | 15.710.03 | 14.730.03 | 14.560.03 | 14.600.03 | 14.730.03 | 1.000.07 | |
| 029 | 54449.70 | 15.370.04 | 15.760.03 | 14.740.03 | 14.590.04 | 14.590.03 | 14.740.03 | 0.990.07 | |
| 030 | 54477.85 | 15.230.04 | 15.550.03 | 14.540.03 | 14.450.03 | 14.330.03 | 14.440.03 | 0.860.06 | |
| 031 | 54636.14 | 15.410.03 | 15.760.03 | 14.780.03 | 14.710.03 | 14.710.03 | 14.880.03 | 1.100.07 | |
| 032 | 54666.69 | 15.380.04 | 15.680.03 | 14.700.03 | 14.570.03 | 14.540.03 | 14.710.03 | 0.970.07 | |
| 033 | 54694.18 | 15.280.04 | 15.570.03 | 14.590.03 | 14.490.03 | 14.470.03 | 14.650.03 | 1.020.08 | |
| 034 | 54730.45 | 15.650.05 | 14.470.03 | 14.380.03 | 14.890.09 | 1.350.43 | |||
| 035 | 54742.67 | 15.170.03 | 15.530.03 | 14.400.03 | 14.240.03 | 14.190.03 | 14.360.03 | 0.810.10 | |
| 036 | 54756.69 | 15.120.06 | 15.350.04 | 14.360.04 | 14.160.04 | 14.130.05 | 14.220.03 | 0.800.06 | |
| 037 | 54760.27 | 15.140.03 | 15.410.03 | 14.310.03 | 14.130.03 | 14.100.03 | 14.230.03 | 0.750.09 | |
| 038 | 54793.10 | 15.250.04 | 15.490.03 | 14.460.03 | 14.280.03 | 14.220.03 | 14.360.03 | 0.780.07 | |
| 039 | 54821.64 | 15.270.03 | 15.600.03 | 14.540.03 | 14.380.03 | 14.350.03 | 14.490.03 | 0.860.08 | |
| 040 | 54827.09 | 15.200.03 | 15.520.03 | 14.470.03 | 14.240.03 | 14.240.03 | 14.350.03 | 0.800.07 | |
| 041 | 54828.16 | 15.170.05 | 15.550.04 | 14.530.04 | 14.240.03 | 14.230.04 | 14.340.03 | 0.770.06 | |
| 042 | 54829.19 | 14.280.05 | |||||||
| 043 | 54847.08 | 15.310.04 | 15.660.03 | 14.630.03 | 14.450.03 | 14.500.03 | 14.580.03 | 0.920.06 | |
| 044 | 54881.95 | 15.230.04 | 15.510.03 | 14.430.03 | 14.260.03 | 14.220.03 | 14.330.03 | 0.760.07 | |
| 045 | 54887.64 | 15.220.03 | 15.530.02 | 14.470.03 | 14.290.03 | 14.280.03 | 14.390.03 | 0.830.07 | |
| 046 | 54909.85 | 15.260.03 | 15.530.03 | 14.530.03 | 14.370.03 | 14.370.03 | 14.510.03 | 0.900.08 | |
| 047 | 54937.03 | 15.200.04 | 15.580.03 | 14.510.03 | 14.330.03 | 14.310.03 | 14.380.03 | 0.830.06 | |
| 048 | 54972.88 | 15.270.04 | 15.640.03 | 14.600.03 | 14.420.03 | 14.460.03 | 14.570.03 | 0.940.07 | |
| 90108 | 001 | 55000.90 | 15.310.04 | 15.610.03 | 14.570.03 | 14.360.03 | 14.310.03 | 14.440.03 | 0.780.06 |
| 002 | 55031.80 | 15.260.04 | 15.520.03 | 14.490.03 | 14.300.03 | 14.290.03 | 14.400.03 | 0.810.07 | |
| 003 | 55033.04 | 14.410.03 | |||||||
| 004 | 55062.07 | 15.240.04 | 15.530.03 | 14.480.03 | 14.320.03 | 14.330.03 | 14.380.03 | 0.830.06 | |
| 005 | 55091.09 | 15.290.04 | 15.560.03 | 14.530.03 | 14.340.03 | 14.360.03 | 14.420.03 | 0.820.06 | |
| 006 | 55097.15 | 14.560.03 | |||||||
| 007 | 55119.83 | 15.310.04 | 15.560.03 | 14.540.03 | 14.410.03 | 14.380.03 | 14.480.03 | 0.860.07 | |
| 008 | 55154.85 | 15.390.03 | 15.610.03 | 14.630.03 | 14.490.03 | 14.550.03 | 14.580.03 | 0.910.08 | |
| 009 | 55182.35 | 15.310.03 | 15.570.03 | 14.510.03 | 14.350.03 | 14.330.03 | 14.400.03 | 0.790.07 | |
| 010 | 55217.06 | 15.350.04 | 15.650.03 | 14.660.03 | 14.460.03 | 14.460.04 | 14.580.03 | 0.890.06 | |
| 011 | 55245.51 | 15.290.04 | 15.630.03 | 14.570.03 | 14.440.03 | 14.410.03 | 14.510.03 | 0.870.06 | |
| 012 | 55273.42 | 15.430.04 | 15.790.03 | 14.770.03 | 14.630.03 | 14.610.03 | 14.760.03 | 0.970.06 | |
| 90331 | 001 | 55291.11 | 15.270.03 | 15.600.03 | 14.570.03 | 14.400.03 | 14.360.03 | 14.470.01 | 0.860.05 |
| 002 | 55291.18 | 14.390.03 | |||||||
| 003 | 55320.09 | 15.200.03 | 15.470.03 | 14.390.03 | 14.200.03 | 14.160.03 | 14.280.03 | 0.740.08 | |
| 004 | 55320.26 | 14.390.02 | |||||||
| 005 | 55328.85 | 15.170.03 | 15.420.03 | 14.380.03 | 14.210.03 | 14.180.03 | 14.290.03 | 0.790.07 | |
| 006 | 55334.20 | 15.160.03 | 15.460.03 | 14.400.03 | 14.220.03 | 14.180.03 | 14.290.03 | 0.790.07 | |
| 007 | 55342.14 | 15.150.03 | 15.420.02 | 14.370.03 | 14.170.03 | 14.130.03 | 14.290.03 | 0.790.08 | |
| 008 | 55349.50 | 15.220.03 | 15.510.03 | 14.450.03 | 14.250.03 | 14.250.03 | 14.350.03 | 0.790.08 | |
| 009 | 55349.75 | 15.240.03 | 15.490.02 | 14.390.03 | 14.270.03 | 14.230.03 | 14.300.03 | 0.790.09 | |
| 010 | 55351.08 | 15.180.03 | 15.450.02 | 14.390.03 | 14.220.03 | 14.170.03 | 14.290.03 | 0.780.07 | |
| 011 | 55352.81 | 15.190.03 | 15.460.02 | 14.370.03 | 14.390.01 | 14.180.03 | 14.420.03 | 0.880.12 | |
| 012 | 55353.15 | 15.180.03 | 15.420.02 | 14.390.03 | 14.250.03 | 14.160.03 | 14.300.03 | 0.800.08 | |
| 013 | 55354.60 | 15.180.03 | 15.450.02 | 14.410.03 | 14.210.03 | 14.190.03 | 14.310.03 | 0.790.08 | |
| 014 | 55355.20 | 15.180.03 | 15.450.02 | 14.380.03 | 14.200.03 | 14.150.03 | 14.270.03 | 0.760.07 | |
| 015 | 55356.73 | 15.160.03 | 15.430.02 | 14.360.03 | 14.170.03 | 14.120.03 | 14.270.03 | 0.760.08 | |
| 016 | 55357.62 | 15.190.04 | 15.460.02 | 14.390.03 | 14.180.03 | 14.130.03 | 14.250.03 | 0.720.08 | |
| 017 | 55357.24 | 15.170.03 | 15.400.02 | 14.370.03 | 14.180.03 | 14.120.03 | 14.250.03 | 0.750.07 | |
| 018 | 55359.55 | 15.170.03 | 15.400.02 | 14.380.03 | 14.190.03 | 14.170.03 | 14.280.03 | 0.800.07 | |
| 019 | 55360.48 | 15.170.03 | 15.450.02 | 14.380.03 | 14.250.03 | 14.160.03 | 14.280.03 | 0.780.07 | |
| 020 | 55361.52 | 15.150.03 | 15.410.02 | 14.340.03 | 14.170.03 | 14.120.03 | 14.220.03 | 0.750.07 | |
| 021 | 55362.59 | 15.140.03 | 15.400.02 | 14.320.03 | 14.120.03 | 14.070.03 | 14.160.03 | 0.680.06 | |
| 022 | 55363.73 | 15.110.03 | 15.380.02 | 14.320.03 | 14.110.03 | 14.050.03 | 14.170.02 | 0.720.07 | |
| 023 | 55364.65 | 15.140.03 | 15.370.02 | 14.310.03 | 14.090.03 | 14.020.03 | 14.150.03 | 0.690.06 | |
| 024 | 55365.78 | 15.110.03 | 15.360.02 | 14.300.03 | 14.100.03 | 14.010.03 | 14.130.03 | 0.690.07 | |
| 025 | 55366.81 | 15.110.03 | 15.350.02 | 14.290.03 | 14.090.03 | 14.040.03 | 14.150.03 | 0.720.07 | |
| 026 | 55367.89 | 15.110.03 | 15.360.02 | 14.300.03 | 14.110.03 | 14.050.03 | 14.180.03 | 0.720.08 | |
| 027 | 55368.85 | 15.160.03 | 15.380.02 | 14.330.03 | 14.120.03 | 14.100.03 | 14.190.03 | 0.720.07 | |
| 028 | 55369.65 | 15.120.03 | 15.380.02 | 14.340.03 | 14.150.03 | 14.100.03 | 14.230.03 | 0.770.07 | |
| 029 | 55376.40 | 15.110.03 | 15.360.02 | 14.310.03 | 14.100.03 | 14.080.03 | 14.180.03 | 0.750.07 | |
| 030 | 55383.74 | 15.090.03 | 15.350.02 | 14.300.03 | 14.100.03 | 14.050.05 | 14.170.03 | 0.750.07 | |
| 30334 | 049 | 55384.98 | 14.340.02 | ||||||
| 90331 | 031 | 55390.19 | 15.180.03 | 15.440.03 | 14.390.03 | 14.210.03 | 14.190.03 | 14.290.02 | 0.790.07 |
| 032 | 55396.22 | 15.170.03 | 15.410.02 | 14.330.03 | 14.180.03 | 14.120.03 | 14.250.03 | 0.750.09 | |
| 033 | 55433.79 | 15:250.03 | 15.480.02 | 14.440.03 | 14.290.03 | 14:260.03 | 14.340.03 | 0.790.07 | |
| 034 | 55460.69 | 15.340.03 | 15.610.02 | 14.610.03 | 14.420.03 | 14.400.03 | 14.510.03 | 0.840.06 | |
| 035 | 55461.66 | 14.500.02 | |||||||
| 036 | 55488.39 | 15.380.03 | 15.620.02 | 14.630.03 | 14.450.03 | 14.430.03 | 14.530.03 | 0.840.06 | |
| 037 | 55520.15 | 15.420.03 | 15.740.02 | 14.760.03 | 14.610.03 | 14.640.03 | 14.770.03 | 1.000.07 | |
| 038 | 55548.29 | 15.400.03 | 15.700.02 | 14.710.03 | 14.540.03 | 14.530.03 | 14.680.03 | 0.930.07 | |
| 039 | 55580.24 | 15.210.03 | 15.450.02 | 14.360.03 | 14.250.02 | 14.100.03 | 14.230.03 | 0.710.08 | |
| 040 | 55610.48 | 15.260.03 | 15.590.02 | 14.530.03 | 14.360.03 | 14.350.03 | 14.480.03 | 0.860.08 | |
| 041 | 55639.04 | 15.260.03 | 15.520.02 | 14.470.03 | 14.260.03 | 14.250.03 | 14.310.03 | 0.720.06 | |
| 91017 | 001 | 55668.72 | 15.340.04 | 15.620.03 | 14.540.03 | 14.340.02 | 14.310.03 | 14.430.03 | 0.750.08 |
| 002 | 55668.89 | 14.570.02 | |||||||
| 003 | 55698.10 | 15.290.03 | 15.560.03 | 14.510.03 | 14.330.02 | 14.250.03 | 14.420.03 | 0.770.08 | |
| 004 | 55729.64 | 15.340.03 | 15.610.03 | 14.600.03 | 14.410.02 | 14.330.03 | 14.460.03 | 0.790.05 | |
| 005 | 55761.18 | 15.410.05 | 15.700.03 | 14.710.03 | 14.620.03 | 14.630.04 | 14.810.03 | 1.050.09 | |
| 006 | 55765.58 | 14.540.03 | |||||||
| 007 | 55791.38 | 15.300.03 | 15.600.03 | 14.560.03 | 14.370.03 | 14.310.03 | 14.450.03 | 0.790.07 | |
| 008 | 55805.49 | 15.320.03 | 15.670.02 | 14.610.03 | 14.410.03 | 14.410.03 | 14.520.03 | 0.860.06 | |
| 009 | 55806.56 | 15.330.03 | 15.600.03 | 14.570.03 | 14.400.03 | 14.370.03 | 14.470.03 | 0.820.06 | |
| 010 | 55807.42 | 15.340.03 | 15.570.03 | 14.590.03 | 14.400.03 | 14.340.03 | 14.440.03 | 0.790.06 | |
| 011 | 55808.49 | 15.310.04 | 15.620.03 | 14.580.03 | 14.430.03 | 14.340.03 | 14.430.03 | 0.790.05 | |
| 012 | 55809.51 | 15.340.03 | 15.610.02 | 14.620.03 | 14.420.03 | 14.380.03 | 14.490.03 | 0.820.05 | |
| 013 | 55810.65 | 15.360.03 | 15.600.03 | 14.580.03 | 14.390.03 | 14.360.03 | 14.450.03 | 0.780.06 | |
| 014 | 55811.38 | 15.370.03 | 15.600.02 | 14.580.03 | 14.380.03 | 14.300.03 | 14.410.03 | 0.770.05 | |
| 015 | 55812.77 | 15.330.03 | 15.590.02 | 14.570.03 | 14.350.03 | 14.320.03 | 14.440.03 | 0.770.06 | |
| 016 | 55813.75 | 15.320.03 | 15.570.03 | 14.550.03 | 14.340.03 | 14.290.03 | 14.380.03 | 0.740.06 | |
| 017 | 55814.75 | 15.310.03 | 15.570.03 | 14.560.03 | 14.350.03 | 14.290.03 | 14.390.03 | 0.750.05 | |
| 018 | 55815.76 | 15.330.03 | 15.570.03 | 14.590.03 | 14.370.03 | 14.360.03 | 14.450.03 | 0.790.06 | |
| 019 | 55816.76 | 15.320.03 | 15.580.03 | 14.590.03 | 14.370.03 | 14.350.03 | 14.440.03 | 0.790.05 | |
| 020 | 55817.76 | 15.310.03 | 15.570.03 | 14.560.03 | 14.340.03 | 14.290.03 | 14.400.03 | 0.750.05 | |
| 021 | 55818.70 | 15.300.03 | 15.550.02 | 14.580.03 | 14.340.03 | 14.300.03 | 14.380.03 | 0.760.04 | |
| 022 | 55819.75 | 14.360.04 | |||||||
| 023 | 55820.71 | 15.340.03 | 15.560.02 | 14.530.03 | 14.310.03 | 14.240.03 | 14.360.03 | 0.700.06 | |
| 024 | 55821.81 | 15.330.03 | 15.560.02 | 14.540.03 | 14.330.03 | 14.270.03 | 14.370.03 | 0.720.06 | |
| 025 | 55822.22 | 15.280.03 | 15.540.02 | 14.510.03 | 14.310.03 | 14.250.03 | 14.330.03 | 0.730.05 | |
| 026 | 55823.15 | 15.300.03 | 15.540.02 | 14.510.03 | 14.310.03 | 14.270.03 | 14.340.03 | 0.730.05 | |
| 027 | 55824.45 | 15.300.03 | 15.540.02 | 14.520.03 | 14.340.03 | 14.270.03 | 14.360.03 | 0.750.06 | |
| 028 | 55825.12 | 15.310.03 | 15.540.02 | 14.510.03 | 14.320.03 | 14.270.03 | 14.350.03 | 0.730.06 | |
| 029 | 55826.31 | 15.300.03 | 15.510.02 | 14.470.03 | 14.250.03 | 14.190.03 | 14.270.03 | 0.670.06 | |
| 030 | 55827.30 | 15.300.03 | 15.540.02 | 14.490.03 | 14.270.03 | 14.240.03 | 14.320.03 | 0.710.06 | |
| 031 | 55828.44 | 15.270.03 | 15.490.02 | 14.480.03 | 14.290.03 | 14.210.03 | 14.310.03 | 0.730.06 | |
| 032 | 55829.45 | 15.250.03 | 15.520.03 | 14.480.03 | 14.310.03 | 14.270.03 | 14.380.03 | 0.800.07 | |
| 033 | 55830.41 | 15.280.03 | 15.520.03 | 14.490.03 | 14.310.03 | 14.260.03 | 14.370.03 | 0.770.07 | |
| 034 | 55831.43 | 15.320.03 | 15.530.03 | 14.500.03 | 14.310.03 | 14.230.03 | 14.360.03 | 0.720.07 | |
| 035 | 55832.89 | 15.300.03 | 15.560.03 | 14.520.03 | 14.370.03 | 14.300.03 | 14.420.03 | 0.810.07 | |
| 036 | 55833.08 | 15.290.03 | 15.560.03 | 14.530.03 | 14.350.03 | 14.280.03 | 14.410.03 | 0.790.06 | |
| 037 | 55834.51 | 15.310.03 | 15.570.02 | 14.560.03 | 14.380.03 | 14.340.03 | 14.460.03 | 0.820.06 | |
| 038 | 55852.41 | 15.280.03 | 15.540.02 | 14.550.03 | 14.330.03 | 14.270.03 | 14.340.03 | 0.750.04 | |
| 039 | 55882.65 | 15.320.03 | 15.530.02 | 14.520.03 | 14.320.03 | 14.300.03 | 14.410.03 | 0.780.07 | |
| 040 | 55912.29 | 15.250.03 | 15.510.02 | 14.470.03 | 14.310.03 | 14.290.03 | 14.440.03 | 0.850.09 | |
| 041 | 55943.52 | 15.390.04 | 15.700.03 | 14.710.03 | 14.570.03 | 14.510.03 | 14.720.03 | 0.960.08 | |
| 042 | 55946.46 | 15.390.03 | 15.710.03 | 14.700.03 | 14.580.03 | 14.560.03 | 14.680.03 | 0.950.06 | |
| 043 | 55974.50 | 15.410.03 | 15.730.02 | 14.760.03 | 14.610.02 | 14.580.03 | 14.750.03 | 1.000.06 | |
| 044 | 56003.31 | 15.410.03 | 15.710.02 | 14.750.03 | 14.610.03 | 14.610.03 | 14.770.03 | 1.020.07 | |
| 30334 | 050 | 56038.31 | 14.530.03 | ||||||
| 051 | 56066.75 | 14.660.03 | |||||||
| 052 | 56094.62 | 14.730.03 | |||||||
| 053 | 56122.79 | 14.660.03 | |||||||
| 054 | 56150.44 | 14.480.03 | |||||||
| 055 | 56178.30 | 14.330.03 | |||||||
| 056 | 56206.89 | 14.550.03 | |||||||
| 057 | 56234.48 | 14.540.03 | |||||||
| 058 | 56262.38 | 14.740.03 | |||||||
| 059 | 56290.59 | 14.750.03 | |||||||
| 060 | 56318.18 | 14.580.03 | |||||||
| 062 | 56350.30 | 14.600.03 | |||||||
| 063 | 56374.49 | 14.660.03 | |||||||
| 064 | 56402.12 | 14.720.03 | |||||||
| 065 | 56430.08 | 14.700.03 | |||||||
| 066 | 56444.77 | 15.470.04 | 15.800.03 | 14.870.03 | 14.830.03 | 14.790.03 | 14.960.03 | ||
| 067 | 56445.92 | 15.450.04 | 15.800.03 | 14.920.03 | 14.840.03 | 14.820.03 | 14.980.03 | ||
| 068 | 56446.69 | 15.530.04 | 15.860.03 | 14.870.03 | 14.800.03 | 14.810.03 | 15.000.03 | ||
| 069 | 56447.85 | 15.490.04 | 15.820.03 | 14.960.03 | 14.890.03 | 14.850.03 | 14.990.03 | ||
| 070 | 56448.53 | 15.570.05 | 15.840.03 | 14.890.03 | 14.830.03 | 14.800.03 | 14.970.03 | ||
| 071 | 56449.63 | 15.530.04 | 15.840.03 | 14.960.03 | 14.860.03 | 14.910.03 | 15.040.03 | ||
| 072 | 56450.40 | 15.480.06 | 15.810.03 | 14.920.03 | 14.810.03 | 14.890.08 | 14.970.03 | ||
| 073 | 56451.53 | 15.540.04 | 15.860.03 | 14.920.03 | 14.810.03 | 14.830.03 | 14.970.03 | ||
| 074 | 56452.87 | 15.520.05 | 15.830.03 | 14.870.03 | 14.780.03 | 14.770.04 | 14.960.03 | ||
| 075 | 56453.93 | 15.490.04 | 15.870.03 | 14.910.03 | 14.780.04 | 14.840.04 | 14.980.03 | ||
| 076 | 56458.54 | 14.850.03 | |||||||
| 077 | 56486.48 | 14.830.03 |
| ObsID | Segment | MJD | 3 ul |
|---|---|---|---|
| 30334 | 015 | 54299.81 | 4.54 |
| 018 | 54349.96 | 2.42 | |
| 021 | 54354.52 | 2.25 | |
| 022 | 54355.53 | 1.82 | |
| 023 | 54356.52 | 1.68 | |
| 024 | 54357.52 | 1.52 | |
| 026 | 54380.30 | 3.43 | |
| 027 | 54381.31 | 2.54 | |
| 028 | 54413.06 | 2.54 | |
| 029 | 54449.70 | 4.26 | |
| 030 | 54477.85 | 5.04 | |
| 031 | 54636.14 | 1.54 | |
| 032 | 54666.69 | 2.70 | |
| 033 | 54694.18 | 3.11 | |
| 034 | 54730.45 | 10.06 | |
| 035 | 54742.67 | 3.74 | |
| 036 | 54756.69 | 17.49 | |
| 037 | 54760.27 | 2.12 | |
| 038 | 54793.10 | 3.34 | |
| 040 | 54827.09 | 2.02 | |
| 041 | 54828.16 | 5.34 | |
| 043 | 54847.08 | 2.87 | |
| 044 | 54881.95 | 5.27 | |
| 045 | 54887.64 | 1.04 | |
| 046 | 54909.85 | 2.71 | |
| 047 | 54937.03 | 4.88 | |
| 048 | 54972.88 | 2.47 | |
| 90108 | 001 | 55000.90 | 2.71 |
| 002 | 55031.80 | 3.00 | |
| 004 | 55062.07 | 4.52 | |
| 006 | 55097.15 | 2.53 | |
| 007 | 55119.83 | 4.15 | |
| 008 | 55154.85 | 2.07 | |
| 009 | 55182.35 | 4.30 | |
| 010 | 55217.06 | 6.01 | |
| 011 | 55245.51 | 2.88 | |
| 012 | 55273.42 | 2.89 | |
| 90331 | 001 | 55291.11 | 2.68 |
| 002 | 55291.18 | 3.42 | |
| 003 | 55320.09 | 2.45 | |
| 004 | 55320.26 | 3.76 | |
| 005 | 55328.85 | 1.39 | |
| 006 | 55334.20 | 2.87 | |
| 007 | 55342.14 | 1.17 | |
| 008 | 55349.50 | 2.13 | |
| 009 | 55349.75 | 1.78 | |
| 010 | 55351.08 | 2.45 | |
| 011 | 55352.81 | 2.61 | |
| 012 | 55353.15 | 1.55 | |
| 013 | 55354.60 | 1.12 | |
| 014 | 55355.20 | 7.54 | |
| 015 | 55356.73 | 1.89 | |
| 016 | 55357.62 | 2.09 | |
| 017 | 55357.24 | 2.16 | |
| 018 | 55359.55 | 1.54 | |
| 019 | 55360.48 | 1.37 | |
| 020 | 55361.52 | 2.35 | |
| 022 | 55363.73 | 1.18 | |
| 023 | 55364.65 | 1.32 | |
| 024 | 55365.78 | 2.02 | |
| 025 | 55366.81 | 1.88 | |
| 026 | 55367.89 | 2.12 | |
| 027 | 55368.85 | 4.76 | |
| 029 | 55376.40 | 1.35 | |
| 032 | 55396.22 | 1.45 | |
| 033 | 55433.79 | 1.77 | |
| 035 | 55461.66 | 6.58 | |
| 036 | 55488.39 | 1.76 | |
| 037 | 55520.15 | 1.97 | |
| 038 | 55548.29 | 1.45 | |
| 039 | 55580.24 | 1.63 | |
| 040 | 55610.48 | 3.28 | |
| 041 | 55639.04 | 1.86 | |
| 91017 | 001 | 55668.72 | 2.45 |
| 002 | 55668.89 | 3.51 | |
| 003 | 55698.10 | 2.16 | |
| 004 | 55729.64 | 2.59 | |
| 005 | 55761.18 | 8.63 | |
| 007 | 55791.38 | 2.28 | |
| 009 | 55806.56 | 4.63 | |
| 010 | 55807.42 | 1.59 | |
| 011 | 55808.49 | 4.90 | |
| 012 | 55809.51 | 1.61 | |
| 013 | 55810.65 | 2.78 | |
| 014 | 55811.38 | 3.00 | |
| 015 | 55812.77 | 3.06 | |
| 016 | 55813.75 | 3.32 | |
| 017 | 55814.75 | 3.60 | |
| 019 | 55816.76 | 2.51 | |
| 020 | 55817.76 | 2.16 | |
| 021 | 55818.70 | 2.40 | |
| 023 | 55820.71 | 3.23 | |
| 024 | 55821.81 | 1.68 | |
| 026 | 55823.15 | 2.42 | |
| 027 | 55824.45 | 2.18 | |
| 028 | 55825.12 | 4.56 | |
| 029 | 55826.31 | 3.47 | |
| 032 | 55829.45 | 2.73 | |
| 033 | 55830.41 | 2.34 | |
| 034 | 55831.43 | 1.95 | |
| 035 | 55832.89 | 2.96 | |
| 036 | 55833.08 | 3.74 | |
| 037 | 55834.51 | 1.77 | |
| 038 | 55852.41 | 1.95 | |
| 039 | 55882.65 | 2.88 | |
| 040 | 55912.29 | 1.68 | |
| 041 | 55943.52 | 3.71 | |
| 042 | 55946.46 | 1.36 | |
| 043 | 55974.50 | 1.11 | |
| 044 | 56003.31 | 2.03 | |
| 30334 | 050 | 56038.31 | 3.11 |
| 051 | 56066.75 | 3.49 | |
| 052 | 56094.62 | 4.61 | |
| 053 | 56122.79 | 3.00 | |
| 054 | 56150.44 | 4.03 | |
| 055 | 56178.30 | 5.16 | |
| 056 | 56206.89 | 3.83 | |
| 057 | 56234.48 | 3.08 | |
| 058 | 56262.38 | 2.98 | |
| 059 | 56290.59 | 2.45 | |
| 060 | 56318.18 | 3.02 | |
| 062 | 56350.30 | 3.87 | |
| 063 | 56374.49 | 4.88 | |
| 064 | 56402.12 | 2.95 | |
| 065 | 56430.08 | 3.25 | |
| 066 | 56444.77 | 5.74 | |
| 067 | 56445.92 | 5.27 | |
| 068 | 56446.69 | 2.34 | |
| 069 | 56447.85 | 4.04 | |
| 070 | 56448.53 | 3.05 | |
| 071 | 56449.63 | 4.80 | |
| 072 | 56450.40 | 4.39 | |
| 073 | 56451.53 | 2.99 | |
| 074 | 56452.87 | 3.82 | |
| 075 | 56453.93 | 4.75 | |
| 076 | 56458.54 | 2.93 | |
| 077 | 56486.48 | 3.08 |
| Obs date | 11Magnitude corrected for reddening with =0.037 given by Schlegel et al. (1998). The errors given in this table are statistical errorsThe 3 upper limits are calculated using the method by Kraft et al. (1991) and are given in units of counts s-1. | Source counts22Source counts are background corrected and the uncertainties were determined using Bayesian statistics as described in Kraft et al. (1991). | CR33Count rate is given in units of counts s-1. | HR44The hardness ratio is defined as HR=(H-S)/(H+S) with S and H are background subtracted counts in the 0.3-1.0 and 1.0-10.0 keV bands, respectively. The hardness ratio was calculated following the description in Park et al. (2006). | 0.2-2.0 keV flux55The rest-frame 0.2-2.0 keV flux is given in units of W m-2, corrected for Galactic absorption | 66Observed ; the uncertainties in are of the order of 0.2. |
|---|---|---|---|---|---|---|
| 2007 September | 50531 | 30.0 | 5.9 | +0.54 | 1.480.33 | — |
| 2008 December 21 | 2330 | 9.7 | 41.2 | — | 17.5577Assuming the X-ray spectrum measured during the 2010 July 13 Swift observation. | 1.95 |
| 2009 September 17 | 1818 | 33.3 | 183.2 | 0.54 | 160.0 | 1.89 |
| 2010 June 15 | 5020 | 6.2 | 12.4 | — | 5.2877Assuming the X-ray spectrum measured during the 2010 July 13 Swift observation. | 2.38 |
| 2010 June 22 | 4848 | 6.3 | 13.0 | — | 5.5477Assuming the X-ray spectrum measured during the 2010 July 13 Swift observation. | 2.36 |
| 2010 July 06 | 5218 | 17.9 | 34.3 | 0.48 | 22.7677Assuming the X-ray spectrum measured during the 2010 July 13 Swift observation. | 2.36 |
| 2010 July 13 | 4111 | 40.6 | 98.8 | 0.11 | 53.4 | 1.87 |
| 2010 September 21 | 3516 | 17.2 | 48.9 | 0.25 | 22.6677Assuming the X-ray spectrum measured during the 2010 July 13 Swift observation. | 2.28 |
| 2011 July 23 | 4750 | 25.1 | 52.8 | 0.05 | 37.56 | 2.07 |
| 2011 September 01 | 5377 | 8.4 | 15.6 | — | 4.2288Assuming the mean X-ray spectrum of the 2011 September Swift observations. | 2.75 |
| 2011 September 11 | 5032 | 10.0 | 19.9 | — | 5.3888Assuming the mean X-ray spectrum of the 2011 September Swift observations. | 2.67 |
| 2011 September 18 | 5201 | 10.2 | 19.6 | — | 5.2988Assuming the mean X-ray spectrum of the 2011 September Swift observations. | 2.35 |
| 2011 September 23 | 4650 | 12.0 | 25.8 | — | 6.9788Assuming the mean X-ray spectrum of the 2011 September Swift observations. | 2.31 |
| 2011 September 24 | 4860 | 8.7 | 17.9 | — | 4.8488Assuming the mean X-ray spectrum of the 2011 September Swift observations. | 2.62 |
| 2011 September99Mean values of all data when WPVS 007 was detected during the 2011 September intensive monitoring campaign. | 25220 | 49.2 | 19.5 | +0.240.16 | 5.27 | — |
| Obs date | Model22powl = single power law model, zpcfabs * powl = partial covering absorber with single power low model | 33The partial covering absorber column density is given in units of cm-2 | 44Covering fraction of the partial covering absorber | C-stat | |
|---|---|---|---|---|---|
| powl | -0.84 | — | — | 50.3/40 | |
| 2007 September | zpcfabs * po | 0.77 | 13.73 | 0.95 | 42.6/39 |
| powl | 2.67 | — | — | 20.6/26 | |
| 2009 September 17 | zpcfabs | 2.65 | 17.39 | 0.95 | 17.6/25 |
| powl | 1.56 | — | — | 36.1/32 | |
| 2010 July 13 | zpcfabs | 2.76 | 2.80 | 0.95 | 32.1/31 |
| powl | 1.66 | — | — | 34.4/20 | |
| 2011 July 23 | zpcfsabs | 2.83 | 3.02 | 0.95 | 24.1/19 |
| powl | -0.40 | — | — | 48.9/25 | |
| 2011 September55Mean spectrum of all data when WPVS 007 was detected during the 2011 September intensive monitoring campaign. | zpcfabs | 1.73 | 8.45 | 0.95 | 28.5/24 |
| powl | +0.24 | — | — | 30.5/12 | |
| 2005-201366Mean spectrum of all data when WPVS 007 was not detected between October 2005 and June 2013 as listed in Table 3. | zpcfabs | 0.91 | 22.3 | 0.909 | 134/180 |
| Filter | 11Central filter frequency in unites of Hz | Flux22Flux and flux uncertainty are given in units of W m-2 | 33The luminosity is given in units of W. |
|---|---|---|---|
| 2MASS J | 2.40 | 1.75680.10656 | 2.94 |
| 2MASS H | 1.82 | 1.48880.12867 | 2.49 |
| 2MASS K | 1.38 | 1.54560.095634 | 2.59 |
| WISE 3.4 | 0.8856 | 1.54280.030132 | 2.58 |
| WISE 4.6 | 0.6445 | 1.42320.025126 | 2.38 |
| WISE 12 | 0.2675 | 1.20720.016795 | 2.02 |
| WISE 22 | 0.1346 | 1.24720.029052 | 2.09 |
| Line | 11Rest wavelength given in units of Å | FWHM22Full Width at Half Maximum (FWHM) given in units of km s-1. Note that for the FeI lines FWHM and flux can not be given reliably because these lines appear to be blended and often so faint that they are affected by noise. | Flux33The Line flux and flux uncertainty given in units of W m-2 (10-15 erg s-1 cm-2). |
|---|---|---|---|
| Mg II | 9218+9244 | — | 43.8 |
| FeII + Pa | 9549 + 9573 | — | 20.7 |
| Fe II | 9997 | 1680 | 15.53.8 |
| Pa | 10052 | 1310 | 16.53.4 |
| Fe II | 10501 | 1570 | 10.60.9 |
| He I | 10833 | 1490 | 43.34.5 |
| Pa | 10941 | 1730 | 34.75.0 |
| Fe II | 11126 | 1070 | 4.70.9 |
| O I | 11290 | 1320 | 18.01.7 |
| O III | 12470 | 990 | 5.30.7 |
| Fe II | 12570 | 1300 | 4.20.9 |
| Pa | 12822 | 1230 | 39.33.2 |
| O III | 13436 | 885 | 13.82.0 |
| Fe I | 14298 | — | — |
| Fe I | 14480 | — | — |
| Fe I | 14628 | — | — |
| Fe I | 15260 | — | — |
| Fe I | 15335 | — | — |
| Fe I | 15463 | — | — |
| Fe I | 15533 | — | — |
| Fe I | 15680 | — | — |
| Fe I | 15956 | — | — |
| Fe I | 16366 | — | — |
| Fe I | 16445 | — | — |
| Fe I | 16885 | — | — |
| Fe I | 17383 | — | — |
| Fe I | 17675 | — | — |
| Pa | 18751 | 1035 | 53.45.6 |
| He I | 18922 | 1400 | 11.01.3 |
| Br | 19400 | — | — |
| Mg II | 21064 | 775 | 4.90.6 |
| Br | 21661 | 1130 | 6.50.7 |