Relevance of intracellular polarity to accuracy of eukaryotic chemotaxis
Abstract
Chemotactic cells establish cell polarity in the absence of external guidance cues. Such self-organized polarity is induced by spontaneous symmetry breaking in the intracellular activities, which produces an emergent memory effect associated with slow-changing mode. Therefore, spontaneously established polarity should play a pivotal role in efficient chemotaxis. In this study, we develop a model of chemotactic cell migration that demonstrates the connection between intracellular polarity and chemotactic accuracy. Spontaneous polarity formation and gradient sensing are described by a stochastic differential equation. We demonstrate that the direction of polarity persists over a characteristic time that is predicted to depend on the chemoattractant concentration. Next, we theoretically derive the chemotactic accuracy as a function of both the gradient sensing ability and the characteristic time of polarity direction. The results indicate that the accuracy can be improved by the polarity. Furthermore, the analysis of chemotactic accuracy suggests that accuracy is maximized at some optimal responsiveness to extracellular perturbations. To obtain the model parameters, we studied the correlation time of random cell migration in cell tracking analysis of Dictyostelium cells. As predicted, the persistence time depended on the chemoattractant concentration. From the fitted parameters, we inferred that polarized Dictyosteium cells can respond optimally to a chemical gradient. Chemotactic accuracy was almost 10 times larger than can be achieved by non-polarized gradient sensing. Using the obtained parameter values, we show that polarity also improves the dynamic range of chemotaxis.
I Introduction
Cell polarity maintains cell orientation by anisotropic distribution of particular factors. As such, it is an essential feature of many cells and tissues Drubin96 . For example, budding yeasts preserve the orientation of their budding site with respect to the original junction with their mother cell Drubin96 . As another example, epithelial cells retain their apical and basal sides to establish and maintain sheet structures Drubin96 . Single migrating cells such as cellular slime mold Dictyostelium discoideum, mammalian leukocytes and neurons migrate in response to extracellular guidance cues. This directional cell migration is called chemotaxis. Establishment and control of cell polarity is particularly important in eukaryotic chemotaxis, such as occurs in developmental processes, wound healing and immunological responses Friedl09 . Thus, it is natural to question how cell polarity contributes to chemotaxis.
Dictyostelium is a well-studied model organism for investigating eukaryotic chemotaxis. Its chemotaxis signaling pathways have been well characterized Swaney10 , and its spontaneous and chemotactic migration behaviors have been extensively investigated Fisher ; Song06 ; Li08 ; Fuller10 ; Takagi ; Li11 ; Boedeker10 . These studies have revealed high chemotactic accuracy of Dictyostelium cells even in shallow chemical gradients and low chemoattractant concentrations Fisher . The experimentally determined chemotactic accuracy is higher than expected, assuming that the cell estimates the gradient direction as efficiently as possible. Maximum likelihood estimates of the direction of orientation Hu2010PRL yield a chemotaxis index of for these cells 111 The maximum likelihood estimation assumes Dictyostelium cells with receptors on the cell surface, dissociation constant , and gradient with average chemoattractant concentration .. However, Fisher’s seminal experiment Fisher yielded a chemotaxis index of in a chemical gradient of .
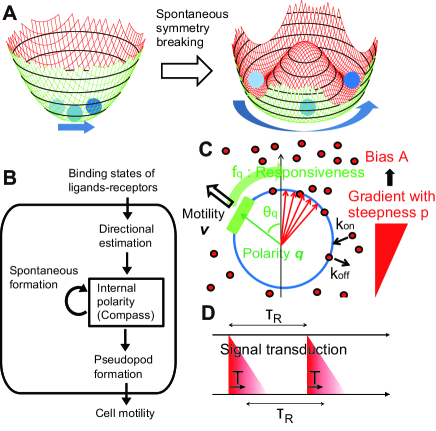
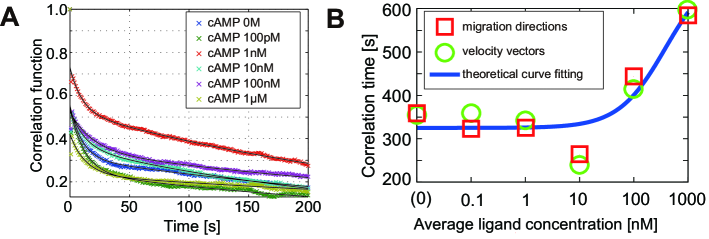
Like many chemotactic eukaryotic cells, Dictyostelium cells spontaneously polarize and migrate in random directions in the absence of extracellular cues. This polarity manifests as self-organization in signaling systems Arai2010 ; Shibata2012 ; Taniguchi2013 ; Postma2004 , polarized structures in the cytoskeletal network, and localization of subcellular organelles. To distinguish these polarities from specific cell-shapes and anisotropy in external environments, we collectively label them as “internal polarity”. Spontaneous internal polarity in the absence of extracellular polarity implies a spontaneous breakdown of the internal isotropy or rotational symmetry. Such spontaneous violation of a continuous symmetry can be illustrated by a state point in the bottom of a potential shaped like a Mexican hat, as illustrated in the right panel of Fig. 1A. This symmetry breaking is accompanied by a memory effect associated with a slowly-changing directional parameter. In other words, in the asymmetric state, cells maintain their current direction. By contrast, in the symmetric state, directional information rapidly dissipates (see Fig. 1A left). Asymmetric polarity is considered to underlie the persistence of cell migration over a characteristic period of time, called the persistence time. The persistence time of Dictyostelium cells ranges from to sec, depending on the chemoattractant concentration (Fig. 2B), much longer than the time constant of the chemoattractant-receptor reaction ( sec).
Such spontaneous intracellular polarities are essential to high chemotactic accuracy. Under shallow gradients, activities in the signal transduction network are modulated by small changes in the likelihood of association between receptor and chemoligand, which induce gradient responses. In the presence of homogeneously-distributed chemoattractant, the distribution of receptor occupancy along the cell periphery fluctuates due to its inherent stochasticity. Similar to external gradients, these spatial fluctuations can also drive the cell to orientate in a different direction Tranquillo:1987tn . In fact, a short chemoattractant stimulus of 1 sec., which is similar to the time constant of receptor-ligand reaction Ueda2001 , can modulate the state in the signaling pathway of gradient sensing in Dictyostelium cell Beta07 . Therefore, we expect that random cell migration under uniform conditions is linked to the gradient response. Because the fluctuations in receptor occupancy depend on the chemoattractant concentration, this concentration might also affect random cell migration. By building these two quantities into a theoretical framework and testing the theory by experiment, we can understand not merely how they are connected, but also elucidate how symmetry breaking contributes to chemotaxis in shallow chemical gradients.
Therefore, in this paper, we seek the connection between random cell migration in a uniform chemoattractant and chemotaxis in shallow gradients. Several theoretical models have been proposed to explain the persistence of cell migration Takagi ; Li11 . Chemotactic cell migrations have also received theoretical treatment Haastert07 ; Schienbein93 ; Schienbein94 ; Hu10 . However, none of the existing theoretical models can explain chemotaxis in shallow gradients or its relevance to random cell migration in a uniform chemoattractant. First, we study the persistence of random cell migration established by spontaneous internal polarity (Figs. 1B and C). We found that the persistence time obtained from the correlation function of migration direction depends on chemoattractant concentration, indicating a chemokinetic effect. We then introduce directional bias by applying an external gradient (Figs. 1B and C). Considering that the internal polarity responsible for the persistence time is equally applicable to chemotaxis, we demonstrate that cell polarity enhances the chemotactic accuracy. Finally, we determine the model parameters by comparing our theoretical results with experimental data of randomly migrating Dictyostelium cells in a uniform condition. We show that cell polarity can account for the the high accuracy of chemotaxis exhibited by Dictyostelium cells in Fisher’s study et al. Fisher .
II Results
II.1 Random cell migration under uniform conditions
We first consider cell migration under uniform conditions, i.e. in the absence of a chemoattractant gradient. As mentioned above, we consider a spontaneously maintained internal polarity in the intracellular process. The cells migrate in the direction of the internal polarity, which is subject to change by intra- and extra-cellular perturbations. For simplicity, we assume that the magnitude of the internal polarity and the migration speed are constant.
Intracellular perturbations originate from stochastic variability of signal reactions and other processes. Such perturbations introduce randomness to the internal polarity, leading to random cell migration. The random orientation of the polarity direction can be described by
| (1) |
where is a random perturbation described by white Gaussian noise with and . In the absence of extra-cellular perturbation, the total noise strength is (rad2/sec), where is the dispersion strength of intracellular stochastic perturbations.
When the cell is exposed to a spatially uniform chemoattractant, the stochastic binding of receptors and chemoattractant ligands constitutes another noise source. The information of the binding states at a particular time decays exponentially with time constant . Here, is the correlation time of the receptor state, given by Hu10
| (2) |
where and are the dissociation and association rates, respectively, and is the dissociation constant. We denote the average impact of individual changes in the binding state on the internal polarity by . The integrated noise strength during time interval scales as . Since the noise dispersion is proportional to the square of the noise strength, the dispersion of the extracellular-noise contribution through receptors is estimated as , where is the number of independent events per unit time. Thus, the dispersion is given by
| (3) |
The numerical factor, , is given by the detailed calculation in Materials and Models (Eq. (18)).
While internal polarity dictates the moving direction of the cell, the direction of the internal polarity fluctuates stochastically under intra- and extra- cellular perturbations, as explained above. Therefore, with the resulting increase in total dispersion, , the correlation time of the migration direction or the internal polarity should decrease. Given that the angular diffusion constant has an inverse time unit, the correlation time is given by . For a detailed derivation of this relation, see Eq. (27) in Materials and Models. Thus, from Eqs. (2) and (3), the correlation time is given by
| (4) |
This equality (Eq. (4)) indicates that the motile behavior of cells depends upon chemoattractant concentration, even if the chemoattrantant is homogeneously distributed in space. The correlation time increases with increasing average concentration , as shown in Fig. 2B (blue solid line). By fitting Eq. (4) to the measured concentration dependence of the correlation time, and knowing the values of the receptor parameters, we can estimate the values of parameters and .
II.2 The effect of internal polarity on the gradient response and chemotactic accuracy
In the presence of chemoattractant gradients, cells perform gradient sensing, and orient their internal polarity in the direction of the gradient. The quality of the gradient sensing may depend on the stochasticity in the receptor states. When the noise increases or decreases relative to the signal strength, the accuracy of gradient sensing may decrease or increase, respectively Ueda08 ; Amselem2012 . Thus, the effective gradient information, which we quantify by a non-dimensional parameter , may decrease if the stochastic noise increases. This bias also depends on the chemoattractant concentration and the steepness of the gradient.
The response of cells to gradient perturbations should depend on the responsiveness (rad/sec), introduced above. As increases, the chemoattractant gradient should exert greater effect. Thus, the ”driving force” exerted on the internal polarity depends on both the bias and the responsiveness, which may be expressed as
| (5) |
(For details of the derivation, see Eq. (17).)
Fisher et al. Fisher specifies the accuracy by the sharpness of the distribution of migration directions , defined by . The chemotaxis index, defined as the statistical average of the migration direction cosines, is . When the chemotactic accuracy is small, the CI is roughly Fisher . is also expected to be proportional to the bias . Furthermore, should improve as the stochastic perturbations decrease, or conversely, as the correlation time increases. These conditions are satisfied if takes the form
| (6) |
(Details of the derivation are provided in Materials and Models; see Eq. (28)).
To see the significance of the internal polarity on the chemotactic accuracy, we consider the ratio between the chemotactic accuracy and the bias , denoted as the amplification ratio . This ratio quantifies the extent to which the internal polarity enhances the chemotactic accuracy. From Eq. (6), the amplification ratio is obtained as
| (7) |
which can be rescaled as
| (8) |
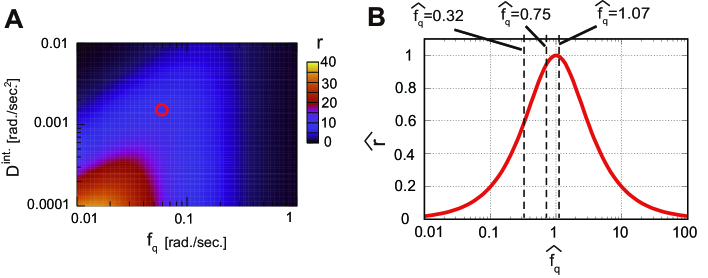
where is the dimensionless responsiveness. In Fig. 3A the amplification ratio is plotted as a function of and for second. Figure 3B plots the rescaled amplification ratio as a function of the rescaled responsiveness . From this figure, we observe that the amplification is maximized () at . These results suggest that, for a given value of , there exists an optimum responsiveness that maximizes the chemotactic accuracy. This maximum accuracy is achieved when the external and intrinsic perturbations are balanced. If the responsiveness is small, the correlation time in Eq. (4) is almost independent of , because the dispersion is dominated by the intrinsic stochastic perturbation . Simultaneously, the external driving force in Eq. (5) is strengthened as increases. Therefore, for small responsiveness , the accuracy increases proportionally to the responsiveness . Conversely, if the responsiveness is large, the correlation time is dominated by extrinsic stochastic perturbations as in Eq. (4). In this case, the accuracy in Eq. (6) decreases in proportion to .
II.3 Chemokinesis during random cell migration of Dictyostelium cells
Here, we determine the values of the parameters and of Dictyostelium cells. To this end, we study the dependence of the correlation time of the migration direction on the extracellular concentration of the chemoattractant cAMP. As we have mentioned, the stochastic binding of chemoattractant by the receptor contributes additional noise to the internal polarity. Because the characteristic time of the receptor depends on the chemoattractant concentration as shown in Eq. (2), the correlation time of the migration direction should depend on the chemoattractant concentration, as predicted in Eq. (4). To investigate this expected phenomenon, we tracked the migration of single Dictyostelium cells in uniform cAMP concentrations (see Materials and Models).
We first obtained the trajectories of cell centroids at 1 s intervals for longer than 5 min up to 30 min. The velocity vector of the cell centroid, , was determined from the temporal autocorrelation function of the migration direction , given by . Figure 2A plots at different cAMP concentrations. The correlation function can be fitted by a sum of two exponential functions;
| (9) |
The shorter time constant , characterizing rapid deformations in the cell shape, is 10-20 sec, while the longer one , which quantifies the persistence time in the migration direction, is several hundred seconds. Here we focus on the time scale of the persistence; therefore, we compare with the correlation time in Eq. (4). As shown in Fig. 2B, the time constant increases as the cAMP concentration increases. We note that the correlation times of the centroid velocity and the direction essentially correspond with each other (Fig. 2B). This indicates that the constant speed approximation used in Eq. (14) is valid in this time scale.
II.4 Optimality of Dictyostelium chemotaxis
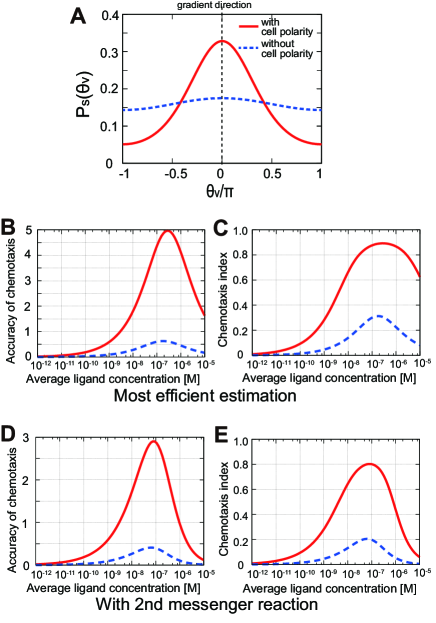
Using the parameter values specified by Eqs. (10) and (11), we first studied the stationary distribution of the migration direction. In Fig. 4A, the distributions of migration direction are plotted for in the absence and presence of internal polarity (Eq. (15) (blue broken line) and Eq. (28) (red solid line), respectively). Clearly, the distribution of migration direction steepens around the gradient direction in the presence of internal polarity.
We next studied the dependence of chemotactic accuracy and chemotaxis index on the chemoattractant concentration . As shown in Fig. 4B, in the presence of internal polarity, both the accuracy and dynamic range of chemotaxis, given by Eq. (6) (red solid line), are larger than when internal polarity is absent (blue broken line). Together, these results indicate that internal polarity contributes not only to chemotactic accuracy but also to the dynamic range of chemotaxis. Figure 4C shows the dependence of the chemotaxis index on the concentration . The stochastic signal processing and transduction during chemotactic signaling has been investigated theoretically Ueda08 and experimentally Amselem2012 . These previous studies showed that the relationship between chemotactic accuracy and extracellular cAMP concentration mirrors the signal-to-noise ratio at the level of the second messenger Ueda08 ; Amselem2012 . Therefore, here, we introduce intracellular noise in the second messenger reaction to the bias (see Eqs. (36)-(38) in Materials and Models), and investigate its effect. The resultant chemotactic accuracy and chemotaxis index as functions of cAMP concentration are shown in Figs. 4D and E, respectively. Again, both the accuracy and dynamic range of chemotaxis are improved by internal polarity. Comparing Fig. 4D with B, we find that the accuracy in the high concentration region is diminished by stochasticity in the second messenger reaction. In Fig. 4D, both the ligand concentration of highest chemotactic accuracy and the dynamic range of chemotaxis agree with the experimental result of Fisher et al. Fisher .
The effect of internal polarity on chemotaxis can be characterized by the amplification ratio introduced in Eq. (7), which defines the ratio of the chemotactic accuracies with and without internal polarity. The amplification ratio depends on the values of and . In Fig. 3A, given by Eq. (7) is plotted in the low concentration limit , i.e. second. For the values of and of Dictyostelium cells, indicated by the red circle in Fig. 3A, the amplification factor is . The amplification ratio depends on both and through . To remove these dependences, we study the scaled amplification ratio given by Eq. (8), which depends only on the scaled responsiveness (plotted in Fig. 3B). The scaled responsiveness of Dictyostelium cells is estimated as , , and for , , and , respectively (see Fig. 3B, broken lines).
For , the responsiveness is distributed around the maximum amplification ratio, indicating that the responsiveness parameter of Dictyostelium cells is almost optimal in this concentration range.
III Discussion
III.1 Chemotaxis ability of mutant cells
The reduced chemotactic ability of mutant cells has been extensively studied. From our proposed theory, we can identify potential chemotactic influences that are impaired by mutations. In Eq. (6), the mutable parameters are the bias , the responsiveness and the internal noise . A mutation can cause a reduction in the bias , an increase in the internal noise , and/or a decline in the responsiveness . Since an optimal exists in wild type cells (see Fig. 3), decreasing the responsiveness will cause a decrease in chemotactic ability 222Furthermore, if the chemoattractant concentration is smaller than , either increasing or decreasing the responsiveness will cause the chemotactic ability to decrease.. Among these three parameters, and affect the correlation time of random cell migration in isotropic conditions. By studying the dependence of this time constant on the chemoattractant concentration, we can identify which of or is modulated. We also notice that amplification ratio is insensitive to change of responsiveness around its optimal value (see Eq. (8)). Hence, the chemotactic accuracy of Dictyostelium cells should not be sensitive to small changes in the responsiveness , as shown in Fig. 3B.
The directional correlation of random cell migration is characterized by “persistence”, defined as the ratio of net displacement to total path length in a given time interval, is here denoted by (it is also called “directionality”). Note that depends on the observational time interval , and is independent of cell migration speed. and are related as follows; In the absence of a chemoattractant gradient, the persistence is almost when . When , it becomes proportional to the square root of the correlation time; that is, . In the presence of a chemoattractant gradient, when , when , and when . Here, is the time scale over which the displacement induced by the gradient bias dominates the diffusion length by randomness in the cell migration, given by . Thus, is given by .
The chemotactic ability of PI3K mutant of Dictyostelium cells has been studied in Takeda07 ; Bosgraaf08 . PI3K is involved in the self-organization of the phosphatidylinositol lipids signaling system Arai2010 ; Shibata2012 , and is a candidate constituent of the internal cell polarity. In addition, PI3K is activated by RasG Swaney10 . RasG is involved in one of the parallel chemotactic signaling pathways in Dictyostelium cells Swaney10 . Therefore, we expect that is increased and is decreased in the PI3K mutant. This may lead to lowering both the chemotactic accuracy in shallow gradients, as shown by Eq. (8), and the persistence , regardless of whether chemoattractant is present. These speculations have been verified by experimental observation Takeda07 ; Bosgraaf08 .
If the ability to detect and respond to the chemoattractant gradient are intact (i.e. the bias and responsiveness are intact), Eq. (6) predicts that the ratio of chemotaxis index to the square of the persistence, i.e., , is approximately constant, with defined in the interval . This tendency has indeed been verified in PTEN mutant cells, in which CI/ was similar to that of wild type cells (using data reported in Ref. Wessels07 ). PTEN is also involved in the self-organization of the phosphatidylinositol lipid signaling system Arai2010 ; Shibata2012 . This suggests that the loss of PTEN activity amplifies the intrinsic fluctuations of the polarity, while little affecting and . In support of this idea, lateral pseudopod formation is enhanced in PTEN mutant cells Wessels07 . However, our assumption that the migration and polarity directions are linked may not be valid for PTEN mutants. If this assumption is removed, the chemotaxis accuracy and persistence decrease.
The synergistic effect of several chemotaxis pathway has been studied in Ref. Veltman08 . Simultaneous inhibition of both PI3K and sGC pathways induces a dramatic reduction in chemotactic ability and persistence , while inhibitions of either pathway cause a mild reduction, indicating the pathways exert a synergistic effect. Although variations arise in both chemotactic ability and persistence, their ratios CI/ in the mutation and inhibition experiments of Ref. Veltman08 appear to be almost constant. This might indicate that neither gradient detection ability nor responsiveness are strongly affected by the mutation, and that the sGC pathway is involved in stabilizing the internal polarity via synergetic effects with the PI3K pathway.
III.2 Other contributions relevant to chemotactic accuracy
Several factors that may reduce chemotactic accuracy have been excluded from the model. The experimental accuracy of chemotaxis obtained by Fisher et al. Fisher is smaller than that obtained in our theory (see Fig. 4D), indicating that some of these factors are significant.
To obtain the maximum feasible accuracy, we assumed that all receptors are located at the periphery of the cell. However, in reality, the receptors in the vicinity of the vertical point cannot contribute to determining the migration direction. This effect reduces the effective number of receptors and hence decreases the chemotactic accuracy.
Spatial and temporal stochastic variations in the distribution of receptors and intracellular signaling molecules may also affect the dispersion in the chemotactic accuracy. For example, as stated in Materials and Models, we have neglected the correlations in the spatial density fluctuations of receptors and the activated second messengers at different times and positions along the cell membrane. However, these spatiotemporal stochastic fluctuations and correlations are expected because the receptors and activated second messengers can diffuse. In addition, the activation time is also subject to stochastic delays. An intriguing future problem is to theoretically investigate the consequences of spatial and temporal correlations on the density fluctuations of activated second messengers. Such studies might elucidate how cells overcome these noises.
We also postulated that the migration direction adiabatically follows the polarity direction on the time scale of interest. However, may deviate from over time scales exceeding the correlation time of polarity direction. These deviations, which would further contribute to fluctuation in the motile direction, are observed in cell deformation processes. Previously, we have reported that cell deformation can alter the gradient sensing ability, with subsequent effect on the probability distribution of chemotactic migration directions BabaPre ; Hiraiwa13 . Therefore, the temporal fluctuations observed in Dictyostelium cells may also affect the dispersion of motile directions.
III.3 Outlook
The present model, which incorporates internal polarity and gradient sensing, is applicable to several different cases, including chemotaxis with cell shape deformation. In particular, slight deviations of the motile direction distribution from the normal circular distribution can be explained by the present model, provided that the process of cell deformation and the influence of cell shape on the gradient sensing are included Hiraiwa13 . The current model can be used to study chemotaxis towards time-varying gradients, such as chemoattractant waves. By introducing cell-cell interactions into the model, the collective chemotaxis of cell populations could also be investigated. Furthermore, this kind of modeling should be applicable to the motility analysis of other kinds of chemotactic eukaryotic cells.
Materials and Models
Mathematical modeling of internal polarity
We consider the spontaneous formation of the internal polarity , incorporating gradient sensing and internal and external perturbations, as described in Results. The simplest evolution equation that describes such internal polarity is given by Hiraiwa13
| (12) |
The first term on the right hand side describes the spontaneous symmetry breaking of isotropy with polarity strength . For simplicity, we assume , so that the internal polarity becomes with . The second term describes the internal noise, assumed as Gaussian white noise with , and
| (13) |
The last term describes the gradient sensing with responsiveness . The unit vector specifies the inferred direction of the external gradient, , i.e. . Here, we consider that the cell estimates the extracellular gradient direction from the distribution of its chemoattractant-occupied receptors (see below). In this paper, we consider cell motions occurring over the persistence time of cell migration. On these time scales, the velocity of the cell immediately follows the internal polarity as
| (14) |
where the migration speed is assumed constant as previously reported Hu10 .
For a given spatial distribution of chemoattractant-occupied receptors, we consider the most probable estimate of the gradient direction, . The simplest probability distribution of the estimated direction, assuming circular shaped cells, is given by BabaPre
| (15) |
where the true gradient direction is . Here, is the bias strength imposed by the external gradient. is presented in detail below. In the absence of internal polarity, the chemotaxis index gained from directional inference alone is given as
| (16) |
The characteristic time in Eq. (2) is much smaller than the persistence time of seconds Takagi in the migrating direction. Thus, we assume that the characteristic time , during which the polarity direction persists, is also much longer than the correlation time of the estimated direction. We consider the integral of the driving force over time interval , . Then, by the central limit theorem, follows the Gaussian distribution. The average and mean square displacement of are given by
| (17) |
and
| (18) |
The driving force in Eq. (5) is given by the -component of in Eq. (17) (divided by ). Next, consider the change in the direction of internal polarity within , . From Eq. (12) with , Eqs. (13), (17), and (18), the moments of up to are given by
| (19) | |||
| (20) |
Using the Kramers-Moyal expansion with Eqs. (19) and (20), we obtain the following Fokker-Planck equation
| (21) |
where , and is the diffusion constant , which consists of two independent dispersions and , respectively denoting the diffusion strengths introduced by external and internal perturbations.
Propagation of noise in the linear cascade reaction
Here, we consider the contribution of the receptor noise to the downstream signals. Consider a linear signaling cascade, in which the activity of each reaction step is modulated by the one-upstream step. Then, the stochastic temporal evolutions of the small deviations from their stationary average at each step are described by the following linearized Langevin equations Shibata2005 ;
| (22) |
where is the time constant (given by the inverse depletion rate) for each reaction step, and the dimensionless quantity includes signal amplification effects. The noise in the activated receptor is given by , with . The last term denotes the noise in the -th signal transduction.
From Eq. (22), the autocorrelation function is given by
| (23) |
where the first term on the right hand side denotes the contribution of the noise in the receptor signal, , to the noise at the -th step of the signal cascade, given by
| (24) |
The function describes the time-dependence of the receptor noise in :
| (25) |
with . The second noise term on the right hand side of Eq. (23) results from the signal cascade, and sums the various noises in the downstream signals, . Since is included in but not in , we focus on the receptor noise given by Eq. (24).
In Dictyostelium cells, the receptor time constant is about second, while the time constants of cascade reactions () are comparable to or less than several seconds Cai2012 ; Kortholt2011 . On the other hand, the persistence time of the migration direction is about seconds. Because the time constants are much smaller than , we can replace by . Thus, we obtain 333The first equality in Eq. (26) is obtained by the following relation; for arbitrary numbers ().
| (26) |
and hence . Therefore, the time constant can be used in Eqs. (3) and (18). Intuitively, this argument implies that the time constant , considered as the interval of signaling events at the receptor, is not affected by the time delay between a particular signaling event and the resulting directional changes along the signaling cascades (Fig. 1D).
Cell motile behavior in the uniform chemoattractant solution.
The persistence of migration direction is characterized by the autocorrelation function of the migration direction. In the presence of a uniform chemoattractant with and , the autocorrelation function of , is obtained from Eq. (21) with as
| (27) |
where the diffusion constant . In this manner, we obtain the correlation time in Eq. (4).
Stationary distribution of the migration direction and chemotaxis index in a shallow chemical gradient.
Solving Eq. (21), the stationary probability distribution of the polarity and migration direction is given by the circular normal distribution as
| (28) |
where the accuracy is obtained from Eq. (6). Here, is the modified Bessel function, defined as . Eq. (28) is plotted as a function of migration distance in Fig. 4A (red solid line). The parameter values of a Dictyostelium cell are assumed. From Eq. (28), the chemotaxis index is obtained as
| (29) |
The chemotaxis index , given by Eq. (29), saturates at ; that is, as , whereas as . Figure 4C plots the chemotaxis index (29) with Eqs. (36) and (38) (red solid line) as functions of chemoattractant concentration assuming the experimental parameters and and the parameter values (10) and (11).
Gradient sensing in cell
Here, we extend the maximum likelihood estimates of gradient direction reported in Refs. Hu2010PRL ; BabaPre to include the effect of stochasticity at the level of the second messenger Ueda08 ; Amselem2012 . We denote the concentrations of activated receptor and the activated second messenger at by and , respectively. Under an exponential chemoattractant gradient of steepness , the chemoattractant concentration along the periphery of the cell is given by . When cells estimate the gradient direction from the distribution of the activated second messenger, the most probable direction is given by and , where and
| (30) | |||||
| (31) |
The distribution of the estimated can be derived from the distributions of and . Here, we consider the distribution of up to first order in , from which we calculate the average and the dispersion of . The averages of and are obtained as
| (32) | ||||
| (33) |
where , and , and and are the total concentrations of receptor and second messenger, respectively. The production and degradation rates of the second messenger are and , respectively. The fluctuation densities of and , defined by and , are given by
| (34) | ||||
| (35) |
where , and . Using the average and dispersion of , the distribution of was evaluated up to first order of (see Eq. (15)) with
| (36) |
and
| (37) |
Taking , followed by the limit , we have where
| (38) |
This form of is consistent with the result based on the most efficient estimation (maximum likelihood estimate without stochasticity in the second messenger reaction) BabaPre . We also note that, as , we have . Thus, this function converges much faster than derived from the most efficient estimate, which decreases as as . Moreover, the coefficient is proportional to the second messenger concentration . Therefore, consistent with a previous report Ueda08 , the activation of the second messenger becomes the bottleneck of the chemotactic signal processing at high chemoattractant concentrations.
Cell motility assay
Dictyostelium discoideum AX2 cells (wild type) were starved by suspension in development buffer (DB : 5 mM Na phosphate buffer, 2 mM MgSO4, 0.2 mM CaCl2, pH 6.3) for 1 hour and were then pulsed with 10 nM cAMP at 6-minute intervals for up to 3.5 hours at 21 ∘C, resulting in elongated cells with chemotactic competency Sato07 . The prepared cells were settled on a glass dish (IWAKI) at cell density cell/ml (to preclude explicit cell-cell interactions), containing DB supplemented with a given concentration of cAMP and 2 mM dithiothreitol (DTT, Sigma) was added to inhibit phosphodiesterase in order to keep the cAMP concentration in the medium. Cells were incubated under these conditions for 20 min. Phase-contrast imaging was performed using an inverted microscopes (TiE, Nikon) with a 40 phase-contrast objective, equipped with an EMCCD camera (iXon+, Andor). Images of cells were taken every second for 30 min. The cell periphery of individual cells was detected and the trajectories of cell area centroids were obtained by a customized program developed in Matlab 7.6 (Mathworks). All trajectories were analyzed for longer than 5 min. The cell velocity in frame was obtained as , where denotes the centroid trajectory.
Acknowledgments
This work has been supported by KAKENHI (25111736). We are grateful to Dr. A. Baba for his contribution at the early stage of this work and Dr. K. Sato for helpful comments.
References
- (1) Drubin DG, Nelson WJ. (1996) Origins of cell polarity. Cell 84: 335-344.
- (2) Friedl P, Gilmour D. (2009) Collective cell migration in morphogenesis, regeneration and cancer. Nat. Rev. Mol. Cell Biol. 10: 445-457.
- (3) Swaney KF, Huang C, Devreotes PN. (2010) Eukaryotic chemotaxis: a network of signaling pathways controls motility, directional sensing, and polarity. Annu. Rev. Biophys. 39: 265-289.
- (4) Fisher PR, Merkl R, Gerish G. (1989) Quantitative analysis of cell motility and chemotaxis in Dictyostelium discoideum by using an image processing system and a novel chemotaxis chamber providing stationary chemical gradients. J. Cell. Biol. 108: 973-984.
- (5) Song L, et al. (2006) Dictyostelium discoideum chemotaxis: threshold for directed motion. Euro. J. Cell Biol. 85: 981-989.
- (6) Li L, Norrelykke SF, Cox EC. (2008) Persistent Cell Motion in the Absence of External Signals: A Search Strategy for Eukaryotic Cells. PLoS one 3: e2093.
- (7) Fuller D, et al. (2010) External and internal constraints on eukaryotic chemotaxis. Proc. Nat. Acad. Sci. USA 107: 9656-9659.
- (8) Takagi H, Sato M, Yanagida T, Ueda M. (2008) Functional Analysis of Spontaneous Cell Movement under Different Physiological Conditions. PLoS one 3: e2648.
- (9) Li L, Cox EC, Flyvbjerg H. (2011) Dicty dynamics’: Dictyostelium motility as persistent random motion. Phys. Biol. 8: 046006.
- (10) Bödeker HU, Beta C, Frank TD, Bodenschatz E. (2010) Quantitative analysis of random ameboid motion. Europhys. Lett. 90: 28005.
- (11) Hu B, Chen W, Rappel W-J, Levine H. (2010) Physical Limits on Cellular Sensing of Spatial Gradients. Phys. Rev. Lett. 105: 048104.
- (12) Postma M, et al. (2004) Sensitization of Dictyostelium chemotaxis by phosphoinositide-3-kinase-mediated self-organizing signalling patches. J. Cell. Sci. 117: 2925–2935.
- (13) Arai Y, et al. (2010) Self-organization of the phosphatidylinositol lipids signaling system for random cell migration. Proc. Nat. Acad. Sci. USA 107: 12399-12404.
- (14) Shibata T, Nishikawa M, Matsuoka S, Ueda M. (2012) Modeling the self-organized phosphatidylinositol lipid signaling system in chemotactic cells using quantitative image analysis, J. Cell Sci. 125: 5138-5150.
- (15) Taniguchi D, Ishihara S, Oonuki T, Honda-Kitahara M, Kaneko K, Sawai S. (2013) Phase geometries of two-dimensional excitable waves govern self-organized morphodynamics of amoeboid cells. Proc. Natl. Acad. Sci. USA. 110: 5016-5021.
- (16) Tranquillo RT, Lauffenburger DA. (1987) Stochastic model of leukocyte chemosensory movement. J. Math. Biol. 25: 229-262.
- (17) Ueda M, Sako Y, Tanaka T, Devreotes P, Yanagida T. (2001) Single molecule analysis of chemotactic signaling in Dictyostelium cells. Science 294: 864-867.
- (18) Beta C, Wyatt D, Rappel W-J, Bodenschatz E. (2007) Flow Photolysis for Spatiotemporal Stimulation of Single Cells. Anal. Chem. 79: 3940-3944.
- (19) Haastert PJM, Postma M. (2007) Biased Random Walk by Stochastic Fluctuations of Chemoattractant-Receptor Interactions at the Lower Limit of Detection. Biophys. J. 93: 1787-1796.
- (20) Schienbein M, Gruler H. (1993) LANGEVIN EQUATION, FOKKER-PLANCK EQUATION AND CELL MIGRATION, Bulletin of Mathematical Biology 55: 585-608.
- (21) Schienbein M, Franke K, Gruler H. (1994) Random walk and directed movement: Comparison between inert particles and self-organized molecular machines. Phys. Rev. E 49: 5462-5471.
- (22) Hu B, Fuller D, Loomis WF, Levine H, Rappel W. (2010) Phenomenological approach to eukaryotic chemotactic efficiency. Phys. Rev. E 81: 031906.
- (23) Ueda M, Shibata T. (2008) Stochastic signal processing and transduction in chemotactic response of eukaryotic cells. Biophys. J. 93: 11-20.
- (24) Amselem G, Theves M, Bae A, Beta C, Bodenschatz E. (2012) Control parameter description of eukaryotic chemotaxis. Phys. Rev. Lett. 109: 108103.
- (25) Takeda K, Sasaki AT, Ha H, Seung H, Firtel RA. (2007) Role of phosphatidylinositol 3-kinases in chemotaxis in Dictyostelium. J. Biol. Chem. 282: 11874-11884.
- (26) Bosgraaf L, Keizer-Gunnink I, Van Haastert P. J. (2008) PI3-kinase signaling contributes to orientation in shallow gradients and enhances speed in steep chemoattractant gradients. J. Cell. Sci. 121: 3589–3597.
- (27) Wessels D, Lusche DF, Kuhl S, Heid P, Soll DR. (2007) PTEN plays a role in the suppression of lateral pseudopod formation during Dictyostelium motility and chemotaxis. J. Cell Sci. 120: 2517-2531.
- (28) Veltman DM, Keizer-Gunnik I, van Haastart PJM. (2008) Four key signaling pathways mediating chemotaxis in Dictyostelium discoideum. J. Cell Biol. 180: 747-753.
- (29) Hiraiwa T, Baba A, Shibata T. (2013) Theoretical model for cell migration with gradient sensing and shape deformation. Euro. Phys. J. E 36: 32.
- (30) Baba A, Hiraiwa T, Shibata T. (2012) Directional sensing of deformed cells under faint gradients. Phys. Rev. E 86: 060901(R).
- (31) Shibata T, Fujimoto K. (2005) Noisy signal amplification in ultrasensitive signal transduction. Proc. Nat. Acad. Sci. USA 102: 331-336.
- (32) Cai H, Huang C-H, Devreotes PN, Iijima M. (2012) Analysis of chemotaxis in Dictyostelium. Methods Mol. Biol. 757: 451-468.
- (33) Kortholt A, Kataria R, Keizer-Gunnink I, van Egmond WN, Khanna A, Haastart PJM. (2011) Dictyostelium chemotaxis: essential Ras activation and accessory signaling pathways for amplification. EMBO reports 12: 1273-1279.
- (34) Sato MJ, Ueda M, Takagi H, Watanabe TM, Yanagida T, et al. (2007) Input-output relationship in galvanotactic response of Dictyostelium cells. BioSystems. 88: 261-272.