FACT - How stable are the silicon photon detectors?
Abstract
The First G-APD Cherenkov telescope (FACT) is the first telescope using silicon photon detectors (G-APD aka. SiPM). The use of Silicon devices promise a higher photon detection efficiency, more robustness and higher precision than photo-multiplier tubes. Since the properties of G-APDs depend on auxiliary parameters like temperature, a feedback system adapting the applied voltage accordingly is mandatory.
In this presentation, the feedback system, developed and in operation for FACT, is presented. Using the extraction of a single photon-equivalent (pe) spectrum as a reference, it can be proven that the sensors can be operated with very high precision. The extraction of the single-pe, its spectrum up to 10 pe, its properties and their precision, as well as their long-term behavior during operation are discussed. As a by product a single pulse template is obtained. It is shown that with the presented method, an additional external calibration device can be omitted. The presented method is essential for the application of G-APDs in future projects in Cherenkov astronomy and is supposed to result in a more stable and precise operation than possible with photo-multiplier tubes.
1 Introduction
The First G-APD Cherenkov Telscope (FACT, [2]) is the first installation of a complete focal plane using silicon photo sensors. It is in operation since Oct. 2011 and its main goals are to prove the applicability of Geiger-mode avalanche photo diodes (G-APD) for focal planes with changing environmental conditions and the long-term monitoring of the brightest TeV blazars.
While G-APDs are very robust and easy in their application taken their relatively low bias voltage of usually less than 100 V into account, their operation properties are also very sensitive to their temperature and the applied voltage.
Since active cooling and the achievement of a homogeneous temperature on a large surface exposed to the environment is difficult, the camera only features a passive cooling and thermal insulation to ensure that the waste heat of the electronics does not significantly heat the sensors.
By thermal design, the temperature gradient in the focal plane is small enough to allow powering of four and five sensors at the same time with the same bias voltage. They have been sorted accordingly. The bias voltage supply system comprises 320 channels in total and allows to adapt the voltage with a precision of about 22 mV. Simultaneously, it enables the readout of the provided current with a precision of 1.2 .
2 The feedback system
To keep the gain, optical crosstalk probability and afterpulse probability of G-APDs stable, a constant overvoltage must be applied. The applied overvoltage is the voltage difference between the applied absolute voltage and the breakdown voltage, which is a function of temperature. The dependence of the breakdown voltage on temperature is linear, well defined and identical for all channels and can thus be corrected adapting the applied voltage according to the measured temperature.
To correct for the change in overvoltage, induced by the change in current and temperature, a feedback system is applied. As feedback values, 31 temperature sensors in the sensor compartment are available, as well as the current readout of each bias voltage channel.
The bias voltage is distributed to the G-APDs using a passive filter network. Its serial resistance induces a voltage drop depending on the current flowing. Since bright ambient light condition as moon lit nights can induce count rates up to 1000 times higher than during dark night conditions, every change in ambient light level would directly influence the applied overvoltage. The voltage drop at the G-APD can be calculated from the measured current and resistances.
For the correction of both effects, a feedback loop has been implemented in the slow control software, which calculates the correction offset according to the feedback values. Since temperature changes are assumed to be slow, the temperature is evaluated every 15 s. Changes in current can be comparably fast due to bright stars moving over the field-of-view, therefore, the voltage drop is calculated once every second.
3 Measuring the stability
To measure the performance of the feedback system, the G-APD properties are evaluated. Different methods to determine the dependence on the applied bias supply voltage, the temperature and the ambient light condition, have been applied and are discussed hereafter.
3.1 Light pulser measurements
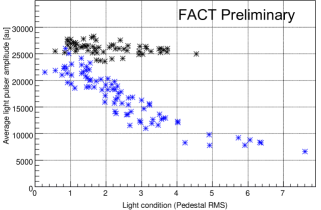
As an indirect measurement of the gain, the measured amplitude of a light pulse is used. The light pulses are emitted by a light pulser installed in the reflector dish. Since its light yield is temperature stabilized, the measured signal amplitude is an indirect measurement of the gain of all channels.
For each measurement, the light-pulser is flashed one thousand times and the readout is self-triggered by the camera’s trigger system. The signal is extracted either by searching the peak or integrating the pulse over a certain range around the peak, both done by a \nth3 order spline interpolation. For each channel, the average amplitude is calculated and the median of all channel is taken, hereafter, just called light-pulser amplitude.
From random triggered events, a measure for the ambient light level can be derived calculating the fluctuations of the recorded signal. For this, the signal-extraction algorithms is applied in each event at a random position. The strength of the fluctuation corresponds to the background photon rate. To be able to correlate the measured values with temperature, an average of all temperature sensors is calculated during these five minutes.
The measured light-pulser amplitude is shown in Fig. 1 versus average temperature with only the temperature-feedback switched on (blue) and with the whole feedback system enabled (black). With just the temperature correction, a clear dependence of the light-pulser amplitude on the ambient light level is visible, as expected. Applying the correction based on the measured current fully corrects this dependency.
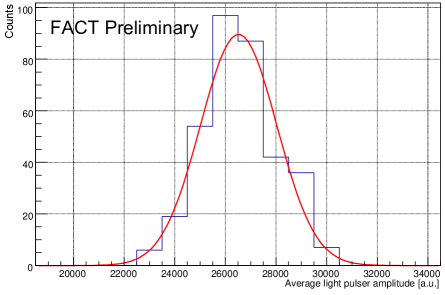
In Fig. 2, the distribution of the light-pulser amplitude is shown. The sigma of the Gauss fit yields of the mean value.
3.2 Direct gain measurement
Due to the high precision of the charge released in breakdowns of single G-APD cells, they feature excellent resolution for single signals (single-p.e.). This allows the extraction of their properties from their dark count spectrum. For this, randomly triggered data is recorded with closed lid. The comparably low rate ensures that the probability for two coinciding dark count signals is reasonably low simplifying their identification and analysis.
Gain extraction
The quality of the gain measurement relies entirely on the quality of the single-p.e. spectrum, i.e. the recognition and extraction of pulses induced from a single primary breakdown. The gain is determined from the distance of higher order peaks to avoid a bias from a possible baseline shift, although the baseline for each channel is determined and corrected. For this study, the dark count spectrum of all 1440 channels has been investigated individually. For each measurement a run with 3000 randomly triggered events was taken.
To extract the pulses, a sliding average of ten samples is computed from the data. This improves the signal-to-noise ratio and eliminates some occasional noise with small amplitudes and a fixed frequency. To identify pulses, the remaining samples are scanned for a leading edge defined by a threshold-crossing and the constrain that four samples before and four samples after that point the signal must still be below and above this threshold, respectively. From this point, the local maximum is determined within the following 30 samples and the point at which the leading edge reaches 50% of the local maximum, called arrival time of the pulse hereafter. If the distance between the maximum and the arrival time exceeds 7 ns the pulse is discarded. From the arrival time position onwards, 30 samples of the raw-signal are integrated. Since the arrival time is the point of the steepest slope, the integration starting at this point yields the most stable results, which was confirmed by simple cross-checks.
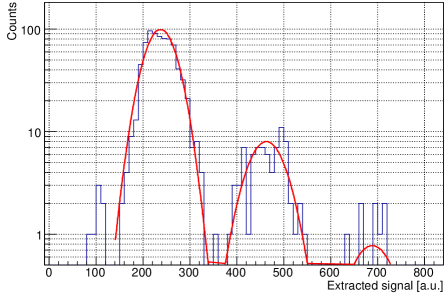
Fit function
The resulting distribution is a superposition of the distribution of the single-p.e. peak and higher order peaks resulting from optical crosstalk. Each distribution is believed to be Gaussian with a width being compiled from a constant noise component , and a noise originating from the fluctuations of the amplitude of a single avalanche, . The ratio between the number of events represented by two consecutive peaks is described by the probability , the probability that an avalanche induces exactly one other avalanche in another micro-cell.
In the obtained spectra, a deviation from this strict exponential behavior is observed. Since this study does not aim at the precise determination of other parameters than the gain, this effect is not discussed in details.
Fit procedure
To determine reasonable start values for fitting the spectra of all channels individually, a combined spectrum of all pixels is filled and fitted for each run. With the baseline and gain value determined for each channel, the individual spectra are normalized and compiled into a sum-spectrum. Fig. 3 (right) shows the sum of these spectra of all available data and a fit with the function given above. The very good agreement of the individual spectra after normalization is evident.
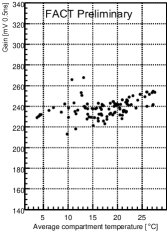
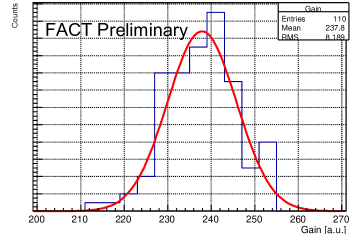
Result
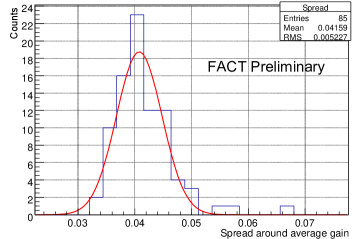
From the primary sum-spectrum, the average gain of all channels is determined. The dependence of the extracted gain versus the average sensor temperature is shown in Fig. 4 (left). A small remaining dependence of the gain on temperature is visible which is of the order of 5% per 20 K. This is an effect of a non-ideal temperature adaption coefficient in the control software which has intentionally not been touched since the deployment of the camera to ensure consistency of the obtained data during a reasonably long period. The center plot shows the distribution of the measured gain values. The fitted Gaussian yields a width of the distribution of about which is well within the specification requiring a gain stability of . The right distribution corresponds to the average root-mean square of the difference between the gain obtained from the single pixel fit and the average gain obtained from the fit of the combined spectrum of all pixels. It can be interpreted as the typical gain spread of pixels within the camera. The fitted Gaussian yields a mean of slightly more than 4%.
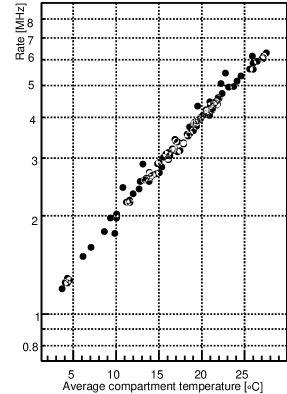
As a cross-check, the dark count rate can be estimated from the spectra and plotted versus temperature, see Fig. 5. This measurement is not a precise measurement of the dark count rate because dead-time and efficiency effects are neglected. Nevertheless, the obtained dark count rate fits very well the data-sheet values.
3.3 Ratescans
Another method to access the gain are so called ratescans. Ratscans use the cosmic ray spectrum for an indirect measurement. They measure the dependence of the total trigger rate of the system on the trigger threshold settings.
The trigger of the camera comprises two stages. In the first stage, the signals of nine channels are summed. This sum-signal is clipped to suppress effects of baseline fluctuations in case of high noise conditions. A comparator converts this signal into a a digital signal. Four of these signals are again summed and discriminated slightly below the threshold for a single input signal. This second step mainly reduces fake triggers from noise of the electronics itself by suppressing too short trigger signals.
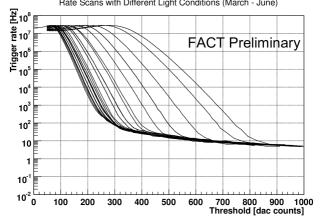
Changing the comparator thresholds, the dependence of the total trigger rate on the threshold settings can be investigated. For low thresholds the rate is dominated by noise and photons from the diffuse night-sky background. For high thresholds, random triggers by artificial coincidences are suppressed, and only simultaneously arriving photons from cosmic-ray induced showers will trigger the system.
Results
For rates above 10 MHz, the system saturates. Below, the trigger rate is dominated by random coincidences of night-sky background photons turning into triggers caused by coincident photons from cosmic-ray induced showers.
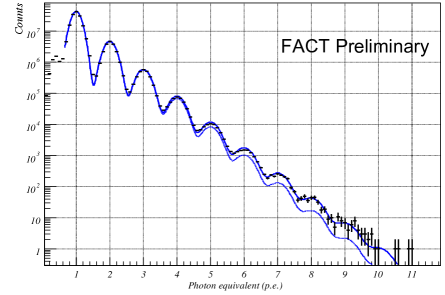
To prove the stability of the gain over a longer time-period and its independence of the ambient light condition, several ratescans have been taken between March and July 2012 with changing light conditions. Fig. 6 shows 26 ratescans taken with light conditions ranging from dark night to almost full moon (). It is visible that the shower induced part of the curves is independent of the ambient light conditions corresponding to a stable gain.
4 Conclusion
The camera of the FACT telescope is now operated since 20 months and has proven the applicability of silicon photo sensors in real-life focal plane installations, in particular, in Cherenkov telescopes.
To achieve a stable operation, of the applied Geiger-mode avalanche photo diodes, a feedback system adapting the applied voltage according to temperature readings and the measured current has been developed.
Three different methods to measure the gain of the system directly or indirectly were applied. They show consistent results on gain-stability. The presented results are limited by the calibration procedure of the bias voltage system, which is currently improved. The most precise and direct method, the extraction of the dark count spectrum, has shown a long-term stability over several months under changing temperature conditions at the few percent level. The measurement of the amplitude of an external light-pulser signal has proven the stability independent of the background light level also at the few percent level.
The implemented feedback system renders the need for an external calibration device obsolete, which is a big advantage for further Cherenkov telescope projects saving a lot of development time and costs.
A detailed description of the telescope and camera hardware and software can be found in [1, 2]. A more detailed discussion of the stability will be available soon in [3].
Acknowledgment
The important contributions from ETH Zurich grants ETH-10.08-2 and ETH-27.12-1 as well as the funding by the German BMBF (Verbundforschung Astro- und Astroteilchenphysik) are gratefully acknowledged. We are thankful for the very valuable contributions from E. Lorenz, D. Renker and G. Viertel during the early phase of the project We thank the Instituto de Astrofisica de Canarias allowing us to operate the telescope at the Observatorio Roque de los Muchachos in La Palma, and the Max-Planck-Institut für Physik for providing us with the mount of the former HEGRA CT 3 telescope, and the MAGIC collaboration for their support. We also thank the group of Marinella Tose from the College of Engineering and Technology at Western Mindanao State University, Philippines, for providing us with the scheduling web-interface.
References
- [1] T. Bretz et al. (FACT Collaboration), these proc., ID 682.
- [2] H. Anderhub et al. (FACT Collaboration), 2013, JINST 8 P06008 [arXiv:1304.1710].
- [3] FACT Collaboration, in prep.
- [4] M. Koetig et al. (FACT Collaboration), these proc., ID 695.
- [5] T. Bretz et al. (FACT Collaboration), these proc., ID 720.
- [6] D. Hildebrand et al. (FACT Collaboration), these proc., ID 709.