Probing long-range correlations in the Berezinskii-Kosterlitz-Thouless fluctuation regime of ultra-thin NbN superconducting films using transport noise measurements
Abstract
We probe the presence of long-range correlations in phase fluctuations by analyzing the higher-order spectrum of resistance fluctuations in ultra-thin NbN superconducting films. The non-Gaussian component of resistance fluctuations is found to be sensitive to film thickness close to the transition, which allows us to distinguish between mean field and Berezinskii-Kosterlitz-Thouless (BKT) type superconducting transitions. The extent of non-Gaussianity was found to be bounded by the BKT and mean field transition temperatures and depend strongly on the roughness and structural inhomogeneity of the superconducting films. Our experiment outlines a novel fluctuation-based kinetic probe in detecting the nature of superconductivity in disordered low-dimensional materials.
The transition from superconducting to normal state in two-dimensions is known to occur via Berezinskii-Kosterlitz-Thouless (BKT) mechanism. Traditionally, the signature of BKT transition is found by measuring the superfluid density where a discontinuity is observed at the critical temperature Berezinskii.VL (1972); Kosterlitz and Thouless (1973); Nelson and Kosterlitz (1977). This method is limited in its scope of application for systems exhibiting interfacial/buried superconductivity like oxide heterostructures due to the inability to measure the thickness of the superconducting layer accurately. Transport-based probes including discontinuity in the power law behavior of I-V characteristics or change in the curvature of magnetoresistance from convex to concave in the presence of a perpendicular magnetic field Halperin and Nelson (1979); Minnhagen (1981); Epstein et al. (1981); Kadin et al. (1983); Simon et al. (1987); Minnhagen (1987) have their limitations as real systems contain some degree of inhomogeneity which smear out the signatures of BKT type behavior. With growing interest in low-dimensional superconductivity, it is interesting to develop new probes/techniques that are not only sensitive enough to detect BKT transition but also compare its characteristics scales with the mean field description.
The BKT transition, as exhibited by ultra-thin superconducting films, is characterized by the unbinding of vortex pairs beyond . It is well known that these vortices exhibit long-range interactions which vary logarithmically with the distance between the vortices. Vortices also occur in bulk Type-\@slowromancapii@ superconductors in the presence of an external magnetic field. Earlier experiments probing vortices in bulk films through measurements of flux flow noise and voltage noise have reported the presence of broad band noise (BBN) Marley et al. (1995); Merithew et al. (1996) as a function of driving current and magnetic field. The statistics of noise in these systems is non-Gaussian due to the fact that most of the noise arise from very few fluctuators. Noise measurements on quasi-2D MgB2 films show a possibility of thermally induced vortex hopping through measurements of flux noise close to BKT transition Khare et al. (2008). To the best of our knowledge there are no reports on higher-order statistics of fluctuations looking into the possibility of interacting vortices in two-dimensions.
Higher-order fluctuations in resistivity has been established as an useful tool to study the presence of long-range correlations in systems undergoing both electronic and structural phase transitions. Experiments on a wide variety of systems like doped silicon Kar et al. (2003), metal nanowires Singh et al. (2009), shape memory alloys Chandni et al. (2009a, b), disordered magnetic alloys Petta et al. (1998) etc. have shown that time dependent fluctuations (noise) in physical observables exhibit a strong non-Gaussian behavior due to the presence of long-range correlations originating from coulomb forces, internal strain fields or magnetic interactions. The origin of non-Gaussian noise can be understood from the following simple picture: In a system composed of many independent fluctuators, the resultant noise has a Gaussian nature as expected from the central limit theorem. However, the non-Gaussian component increases when the correlation length becomes larger, for example close to a critical phase transition, becoming maximum when the fluctuators are correlated throughout the entire sample size. In reduced dimensions, non-Gaussian fluctuations have been predicted for magnetization of 2D XY model which shows BKT transition as a function of temperature Bramwell et al. (2001). However, there have been very few experiments probing the statistics of fluctuations in systems undergoing BKT transition Joubaud et al. (2008). In this letter we study the statistics of resistance fluctuations to probe the nature of transition in thin film superconductors both in 3D and quasi-2D limits.
A characteristic feature of superconducting thin films is that when the film thickness () is reduced below the coherence length (), the superconductivity crosses over to 2D limit characterized by BKT transition Mondal et al. (2011); Baturina et al. (2012). The material system chosen for our study is a conventional s-wave superconductor niobium nitride (NbN). The Ginzburg-Landau coherence length ( nm) in these films was estimated from the measurement upper critical field () as a function of temperature and using the relation , where is the upper critical field extrapolated to K Chand (2012). NbN thin films exhibit a crossover from BCS to BKT type behavior, with reduction in and are very good candidates to study the BKT transition since ultra-thin films (down to nm) can be synthesized with high degree of structural uniformity, while displaying moderately large . Thus they provide us an ideal platform to investigate vortex correlations in low-dimensional superconductivity.
The phase diagram of NbN films, showing the critical temperature ( or ) vs normalized film thickness is shown in Fig. 1a. Films with , undergo BKT transition (black line and symbol) while the expected mean field temperature is shown by red line and symbol. The thicker/3D films () display BCS type behavior and hence, are characterized by only one temperature scale () whereas films in the quasi-2D limit (), which display BKT transition, are characterized by two temperature scales ( and ). The mean field critical temperature, , decreases as the film thickness is reduced due to the increase in electron-electron coulomb interactions which compete with the attractive interaction required for superconductivity Finkel’stein (1994). The shaded region corresponds to the BKT fluctuation regime dominated by interacting vortices.
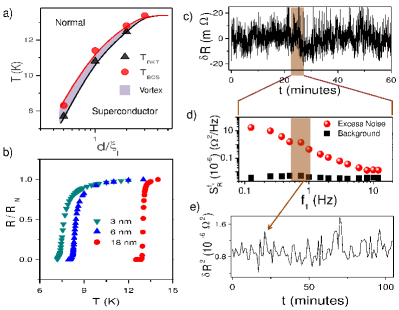
The samples used in our experiments were grown on lattice matched MgO substrate using RF magnetron sputtering (details refer Chockalingam et al. (2008); Chand et al. (2009); Mondal et al. (2011)). Contacts (Cr/Au) were defined by wire masking for four-probe measurements. The normalized temperature dependence of resistance is shown for all films in Fig. 1b. The width of transition from normal state to superconducting state is K for thicker films and increases to K when the thickness is reduced below nm. It is important to note that depends very strongly on the microstructural details, and in spite of very similar deposition conditions, variations in the microstructral details, particularly grain size, can make vary over nearly %. This also indicates a limitation of standard time-averaged transport to characterize the nature of ultra-thin superconductivity without ambiguity.
Our experimental procedure consists of measuring slow time-dependent fluctuations in the sample resistance at different temperatures for zero magnetic field. Typical time traces of the fluctuations for a nm thick NbN film are shown in Fig. 1c and Fig. 2a. The details of the noise measurement technique are available in Ref. Chandni et al. (2009b). As the temperature is reduced, the fluctuations increase in magnitude (Fig. 2a). The normalized power spectral density (PSD) for different temperatures as shown in Fig. 2b, exhibits α type behavior. The PSD increases in magnitude as the temperature is lowered. We find that at low temperatures, which eventually converges to at higher temperatures restoring the nature of noise. We find similar behavior in even for thicker samples. The rather high values of might possibly arise due to the presence of vortices / inhomogeneous percolative transport Jung et al. (2003). We believe that further experiments are required to understand this behavior of .
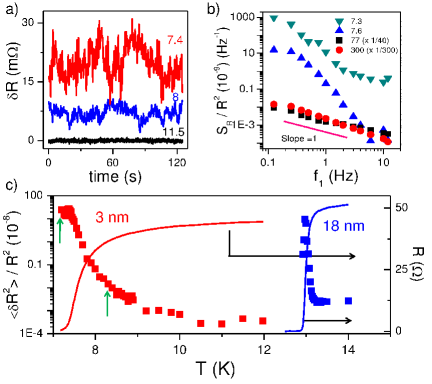
To explore the temperature dependence of noise close to the superconducting transition, we integrate the PSD over our measurement bandwidth ( Hz) to obtain the normalized variance which is shown along with resistance as a function of temperature in Fig. 2c. We find that the normalized variance shows a divergent behavior at low temperatures for all samples irrespective of thickness. This behavior is best understood from the theory of percolation. It is well known that for ( for nm) thin film superconductors exhibit fluctuations in the superconducting order parameter which leads to formation of cooper pairs for a very short time. These fluctuations in the superconducting order parameter leads to the formation of small superconducting islands in the films, giving rise to a percolative network of metallic and superconducting regions. As the temperature is reduced, the superconducting phase grows. The noise in these systems arise from two possible scenarios : a) resistance fluctuations in regions of normal metal and b) fluctuations in the number of superconducting regions/islands. It is well known from the theory of percolation that noise grows till the film becomes fully superconducting Kiss et al. (1993); Kiss and Svedlindh (1993, 1994); Testa et al. (1988). The noise follows the relation where the percolation exponent in our experiments. The influence of temperature fluctuations ( mK) was carefully evaluated and eliminated by varying the control parameters and observing its effect on the nature of the noise power spectrum.
To probe the presence of correlations, we measured higher-order statistics of noise using second spectrum of the fluctuations. The second spectrum is a sensitive technique to estimate the presence of non-Gaussian component (NGC) in the resistance fluctuations Restle et al. (1985); Seidler and Solin (1996); Chandni et al. (2009a). The experimental scheme employed to measure the second spectrum is shown in Fig. 1c-1e. The time series shown in Fig. 1c is divided into successive windows of minutes each. The power spectral density is calculated for each such window (Fig. 1d) and it is integrated over a chosen octave to obtain the noise power which is plotted as a function of time in Fig. 1e. In effect, the second spectrum is the Fourier transform of the four-point correlation of and is given by
where is the center frequency of the chosen octave and corresponds to the spectral frequencies. represents the “spectral wandering” or fluctuations in the noise power in a chosen frequency band (Fig. 1e). Specifically, we have chosen an octave spanning Hz where the excess noise is considerably higher than the background to minimize the effects of signal corruption by Gaussian background. The second spectrum of noise appears to display a rather weak dependence of frequency but shows an increase in overall magnitude with lowering of temperature (Fig. 3a). A convenient way to represent the second spectrum is to plot the normalized variance of second spectrum , which is a measure of normalized fourth-order moment in noise, as a function of temperature. As shown in Fig. 3b, decreases monotonically from at K to a baseline value of near K. Comparison with the temperature dependence of resistance reveals that the enhanced marks the onset of the normal state, which decays to a temperature-independent baseline value within about % of the normal state resistance (). Importantly, is reduced to the baseline value by K, whereas the percolation dynamics of the resistance fluctuations is observable well up to K (Fig. 2c). This implies that the increase in is due to an independent process, and unlikely to be due to percolative fluctuations that dominate the measured noise (first spectrum).
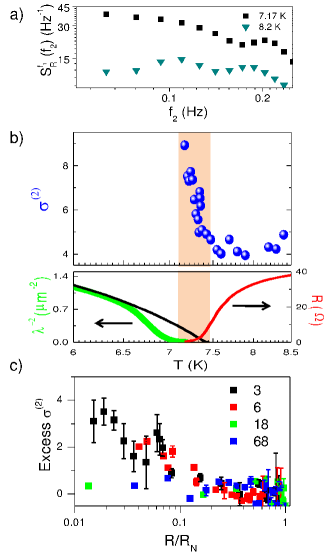
To correlate the measured -dependence of with other physical properties of the NbN thin films at the superconductor-normal transition, we have subsequently measured the magnetic penetration depth () in the same sample as a function of Kamlapure et al. (2010). In such measurements is proportional to the superfluid density, whose deviation from the mean field BCS expectation (black line in Fig. 3b) has recently been interpreted as the BKT transition in ultra-thin NbN films Mondal et al. (2011). In the present sample (Fig. 3b), the maximum in occurs at the same temperature, suggested as the BKT transition temperature , where the superfluid density () drops to zero. Strikingly, approaches the baseline value at the theoretically computed mean-field superconducting transition temperature (), suggesting a correlated kinetics of the charge carrying species between and (the shaded region in Fig. 3b).
To get a further understanding of the underlying mechanism, we have repeated the measurements for NbN films with different thickness. We subtract the baseline value from in each case and plot the excess value as a function of normalized resistance for each sample (Fig. 3c). We find that the representation in terms of allows better comparison as the samples display a wide range of . The dependence of on for thinner films () was found to be very different from the thicker ones ( nm). Most () quasi-2D samples ( nm) show the remarkable increase in close to the superconducting transition signifying the presence of long-range correlations, whereas the bulk films display essentially no excess which is indicative of Gaussian type fluctuations as expected in case of Ginzburg-Landau (GL) fluctuations for a BCS superconductor. The thickness dependent behavior of has two key implication: First, since all samples, irrespective of thickness, show percolative kinetics near the superconducting transition, we can eliminate the enhancement of to arise from such kinetics. Secondly, appearance of excess in the regime dominated by vortex fluctuation (Fig. 3b and schematics of Fig. 1a) strongly suggests the excess to arise from long-range correlations among the vortices themselves.
Another phenomenon which can give rise to NGC in noise is Dynamical Current Redistribution (DCR) which occurs due to large local resistivity fluctuations and strong transport inhomogeneities Seidler et al. (1996). In our samples, and the noise mechanism (percolation) is the same for both thin and thicker films. Had the origin of NGC been due to DCR, then all the films must have displayed strong NGC in noise which is not the case in our measurements.
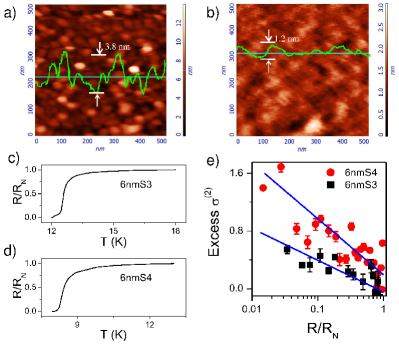
Finally, to explore the sensitivity of non-Gaussian fluctuations to the structural details of the films, we have carried out measurements on two different samples of same nominal thickness 6 nm, but different structural morphology. We used an AFM to characterize the roughness of the samples that were prepared at different times and deposition conditions. One of the sample (6nmS3) shows an average roughness of nm, whereas the relatively smoother sample (6nmS4) has a much lower average roughness ( nm) (Fig. 4a,b). We observe a kink like feature (around K) in the resistance vs temperature data (Fig. 4c) for 6nmS3, possibly as a result of the surface roughness and strong thickness variation in the film. A clear distinction is observed in the second spectrum of noise (Fig. 4e) with the NGC becoming weaker as the surface roughness increases. These results can be viewed in the context of vortices in disordered/granular superconductors. Granular thin films are modeled as disordered array of Josephson junctions which can lead to a double transition Johnson and Kadin (1998); Bergk et al. (2011). Moreover, the pinning of vortices due to random potential fluctuations/defects is known to limit the long-range interactions among the vortices Giamarchi and Le Doussal (1995, 1997). Further experiments on samples with controlled levels of disorder will be of great interest in evaluating the robustness of NGC in noise.
Thus our experiments underline a new method to identify the BKT fluctuation regime in ultra-thin superconducting films. The characteristics temperature scales and emerge as the range over which the NGC is non-zero, that could be useful to probe other low-dimensional superconductors as well.
Acknowledgements.
We acknowledge the Department of Science Technology (DST) and Department of Atomic Energy (DAE), Govt. of India for funding the work.References
- Berezinskii.VL (1972) Berezinskii.VL, Soviet Physics JETP-USSR 34, 610 (1972).
- Kosterlitz and Thouless (1973) J. M. Kosterlitz and D. J. Thouless, Journal of Physics C: Solid State Physics 6, 1181 (1973).
- Nelson and Kosterlitz (1977) D. R. Nelson and J. M. Kosterlitz, Phys. Rev. Lett. 39, 1201 (1977).
- Halperin and Nelson (1979) B. Halperin and D. Nelson, Journal of Low Temperature Physics 36, 599 (1979).
- Minnhagen (1981) P. Minnhagen, Phys. Rev. B 23, 5745 (1981).
- Epstein et al. (1981) K. Epstein, A. M. Goldman, and A. M. Kadin, Phys. Rev. Lett. 47, 534 (1981).
- Kadin et al. (1983) A. M. Kadin, K. Epstein, and A. M. Goldman, Phys. Rev. B 27, 6691 (1983).
- Simon et al. (1987) R. W. Simon, B. J. Dalrymple, D. Van Vechten, W. W. Fuller, and S. A. Wolf, Phys. Rev. B 36, 1962 (1987).
- Minnhagen (1987) P. Minnhagen, Rev. Mod. Phys. 59, 1001 (1987).
- Marley et al. (1995) A. C. Marley, M. J. Higgins, and S. Bhattacharya, Phys. Rev. Lett. 74, 3029 (1995).
- Merithew et al. (1996) R. D. Merithew, M. W. Rabin, M. B. Weissman, M. J. Higgins, and S. Bhattacharya, Phys. Rev. Lett. 77, 3197 (1996).
- Khare et al. (2008) N. Khare, D. P. Singh, and A. K. Gupta, Applied Physics Letters 92, 192508 (2008).
- Kar et al. (2003) S. Kar, A. K. Raychaudhuri, A. Ghosh, H. v. Löhneysen, and G. Weiss, Phys. Rev. Lett. 91, 216603 (2003).
- Singh et al. (2009) A. Singh, D. Chowdhury, and A. Ghosh, Applied Physics Letters 95, 092103 (2009).
- Chandni et al. (2009a) U. Chandni, A. Ghosh, H. S. Vijaya, and S. Mohan, Phys. Rev. Lett. 102, 025701 (2009a).
- Chandni et al. (2009b) U. Chandni, S. Kar-Narayan, A. Ghosh, H. Vijaya, and S. Mohan, Acta Mater. 57, 6113 (2009b).
- Petta et al. (1998) J. R. Petta, M. B. Weissman, and G. Durin, Phys. Rev. E 57, 6363 (1998).
- Bramwell et al. (2001) S. T. Bramwell, J.-Y. Fortin, P. C. W. Holdsworth, S. Peysson, J.-F. Pinton, B. Portelli, and M. Sellitto, Phys. Rev. E 63, 041106 (2001).
- Joubaud et al. (2008) S. Joubaud, A. Petrosyan, S. Ciliberto, and N. B. Garnier, Phys. Rev. Lett. 100, 180601 (2008).
- Mondal et al. (2011) M. Mondal, S. Kumar, M. Chand, A. Kamlapure, G. Saraswat, G. Seibold, L. Benfatto, and P. Raychaudhuri, Phys. Rev. Lett. 107, 217003 (2011).
- Baturina et al. (2012) T. I. Baturina, S. V. Postolova, A. Y. Mironov, A. Glatz, M. R. Baklanov, and V. M. Vinokur, EPL (Europhysics Letters) 97, 17012 (2012).
- Chand (2012) M. Chand, Ph.D. thesis, Tata Institute of Fundamental Research, India (2012), URL http://www.tifr.res.in/~superconductivity/pdfs/madhavi.pdf.
- Finkel’stein (1994) A. Finkel’stein, Physica B: Condensed Matter 197, 636 (1994).
- Chockalingam et al. (2008) S. P. Chockalingam, M. Chand, J. Jesudasan, V. Tripathi, and P. Raychaudhuri, Phys. Rev. B 77, 214503 (2008).
- Chand et al. (2009) M. Chand, A. Mishra, Y. M. Xiong, A. Kamlapure, S. P. Chockalingam, J. Jesudasan, V. Bagwe, M. Mondal, P. W. Adams, V. Tripathi, et al., Phys. Rev. B 80, 134514 (2009).
- Jung et al. (2003) G. Jung, Y. Paltiel, E. Zeldov, Y. Myasoedov, M. L. Rappaport, M. Ocio, S. Bhattacharya, and M. J. Higgins, Proc. SPIE 5112, 222 (2003).
- Kiss et al. (1993) L. Kiss, T. Larsson, P. Svedlindh, L. Lundgreen, H. Ohls’en, M. Ottosson, J. Hudner, and L. Stolt, Physica C: Superconductivity 207, 318 (1993).
- Kiss and Svedlindh (1993) L. B. Kiss and P. Svedlindh, Phys. Rev. Lett. 71, 2817 (1993).
- Kiss and Svedlindh (1994) L. Kiss and P. Svedlindh, IEEE Transactions on Electron Devices 41, 2112 (1994).
- Testa et al. (1988) J. A. Testa, Y. Song, X. D. Chen, J. Golben, S.-I. Lee, B. R. Patton, and J. R. Gaines, Phys. Rev. B 38, 2922 (1988).
- Restle et al. (1985) P. J. Restle, R. J. Hamilton, M. B. Weissman, and M. S. Love, Phys. Rev. B 31, 2254 (1985).
- Seidler and Solin (1996) G. T. Seidler and S. A. Solin, Phys. Rev. B 53, 9753 (1996).
- Kamlapure et al. (2010) A. Kamlapure, M. Mondal, M. Chand, A. Mishra, J. Jesudasan, V. Bagwe, L. Benfatto, V. Tripathi, and P. Raychaudhuri, Applied Physics Letters 96, 072509 (2010).
- Seidler et al. (1996) G. T. Seidler, S. A. Solin, and A. C. Marley, Phys. Rev. Lett. 76, 3049 (1996).
- Johnson and Kadin (1998) M. W. Johnson and A. M. Kadin, Phys. Rev. B 57, 3593 (1998).
- Bergk et al. (2011) B. Bergk, A. P. Petrovic, Z. Wang, Y. Wang, D. Salloum, P. Gougeon, M. Potel, and R. Lortz, New Journal of Physics 13, 103018 (2011).
- Giamarchi and Le Doussal (1995) T. Giamarchi and P. Le Doussal, Phys. Rev. B 52, 1242 (1995).
- Giamarchi and Le Doussal (1997) T. Giamarchi and P. Le Doussal, Phys. Rev. B 55, 6577 (1997).