Minute-Scale Rapid Variability of Optical Polarization in Narrow-Line Seyfert 1 Galaxy: PMN J0948+0022
Abstract
We report on optical photopolarimetric results of the radio-loud narrow line Seyfert 1 (RL-NLSy1) galaxy PMN J0948+0022 on 2012 December to 2013 February triggered by flux enhancements in near infrared and -ray bands. Thanks to one-shot polarimetry of the HOWPol installed to the Kanata telescope, we have detected very rapid variability in the polarized-flux light curve on MJD 56281 (2012 December 20). The rise and decay times were about 140 sec and 180 sec, respectively. The polarization degree (PD) reached % at the peak of the short-duration pulse, while polarization angle (PA) remained almost constant. In addition, temporal profiles of the total flux and PD showed highly variable but well correlated behavior and discrete correlation function analysis revealed that no significant time lag of more than 10 min was present. The high PD and minute-scale variability in polarized flux provides a clear evidence of synchrotron radiation from a very compact emission region of cm size with highly ordered magnetic field. Such micro variability of polarization are also observed in several blazar jets, but its complex relation between total flux and PD are explained by multi-zone model in several blazars. The implied single emission region in PMN J0948+0022 might be reflecting a difference of jets between RL-NLSy1s and blazars.
1 Introduction
Narrow-line Seyfert 1 (NLSy1) galaxies are a class of active galactic nuclei (AGNs). It is widely recognized that NLSy1 posses a relatively light central black hole (BH) of accreting at a very high rate near the Eddington limit (e.g., Yuan et al., 2008). Hence, NLSy1 is considered to be a young AGN growing toward a super massive BH which is believed to have a mass of . Thus, studying a class of NLSy1 provides us with knowledge about BH evolution. NLSy1s are usually radio-quiet and only 7% of NLSy1 are radio-loud (RL) objects (Zhou et al., 2003; Komossa et al., 2006). Owing to the high sensitivity of Fermi LAT instrument, -ray emission from some of these RL-NLSy1s are detected and the presence of a third class of AGNs with relativistic jets are confirmed from multi-wavelength observation (Abdo et al., 2009) following blazars and radio galaxies. These discoveries opened interesting questions on the unified model of AGNs such as the development of the relativistic jet. Combined with the fact that their broadband spectra are quite similar to those of blazars, it is thought that at least these NLSy1s have powerful relativistic jets and they are directed toward us. Finding evidence of blazar-like behavior in RL-NLSy1 would help us to understand the evolution of relativistic jets.
Polarized radiation is one of the evidences of synchrotron origin of jet emissions. Therefore, optical polarimetric observations provide a strong tool to probe jet structures (e.g., Marscher et al., 2008; Abdo et al., 2010a). The radiation in the optical band is thought to be a superposition of synchrotron and disk emission from its spectral shape of the Fermi-detected NLSy1s which has enough multi-wavelength data. However, a timescale of micro variability with photopolarimetric observation in RL-NLSy1 has never been studied so far. It can provide an important and interesting tool to probe of the size and structure of the emission region in the jet and for distinguishing different models responsible for the variability. Several important and interesting results of micro variability for blazars are reported (e.g., Miller & Noble, 1996; Fossati et al., 2008).
PMN J0948+0022 (also known as 2FGL J0948.8+0020, R.A. = , decl. = , J2000, z=0.5846, Nolan et al., 2012; Beasley et al., 2002) is classified as a RL-NLSy1 and displays variable emission from radio to -ray bands, suggesting the presence of the relativistic jet (Zhou et al., 2003; Abdo et al., 2009). The optical polarization variability with monthly-timescale were detected in the past observations (Eggen et al., 2013). Additionally, a high polarization degree (PD) of 18.8% was also reported in April 2009 (Ikejiri et al., 2011). Micro variability (timescale within a few hours) of optical flux was also observed on PMN J0948+0022 in 2009 (Liu et al., 2010), and this result supports the fact that the object carries the relativistic jet with a small viewing angle. Hence, PMN J0948+0022 is a good target to study the difference of the relativistic jet between blazars and RL-NLSy1s.
Recently, PMN J0948+0022 showed an extreme activity in the near-infrared and GeV -ray bands on December 2012 (Carrasco et al., 2012; D’Ammando & Orienti, 2013). In this paper, we present results of high-temporal-density optical monitoring observations of PMN J0948+0022 just after the December 18th 2012 (MJD 56279) near-infrared flare.
2 Observation
We performed the g’, V and RC-band photometric
observations of PMN J0948+0022
from 2012 December 20 to 2013 February 20, using the HOWPol (Hiroshima One-shot Wide field Polarimeter)
installed to the 1.5m Kanata telescope located at the
Higashi-Hiroshima Observatory, Japan (Kawabata et al., 2008) and
the MITSuME (Multicolor Imaging Telescopes for Survey and Monstrous Explosions)
installed to the 1.05m Murikabushi telescope
located at the Ishigaki island, Japan.
Reductions of optical data were performed under the standard procedure
of CCD photometry.
We performed the aperture photometry using APPHOT packaged in
PYRAF
111PYRAF is a product of the Space Telescope Science Institute, which is
operated by AURA for NASA.
http://www.stsci.edu/institute/software_hardware/pyraf,
and the differential photometry with a comparison star taken in the
same frame of PMN J0948+0022.
The position of the comparison star is R.A. = , decl. =
(J2000)
and its magnitudes are g’ = 18.288 mag,V = 17.429 mag and RC = 16.849 mag (Adelman-McCarthy et al., 2007).
We confirmed a systematical flux difference of the
comparison star between the two instruments and standard deviations of flux are mag in the
V band and mag in the RC band.
These values were added to the photometric errors of PMN J0948+0022 in
each observation.
We corrected the data for the Galactic extinction of =0.305 mag,
=0.253 mag and =0.206 mag
(Schlafly & Finkbeiner, 2011, NED database222http://ned.ipac.caltech.edu/).
We also performed temporally high-densed photopolarimetric observations of PMN J0948+0022 with the HOWPol on 6 nights. In order to study a relation between the optical flux and the micro variability, we performed high-dense photopolarimetric observations in several flux levels. Thanks to the double-Wollaston prism installed to the HOWPol, we could obtain both the Stokes and parameters in only a single exposure. Therefore short-interval (100-310 s) photopolarimetric observations were available. A detail photopolarimetric observation log is given in Table 1. The bad quality frame (cloudy sky, suffering from cosmic ray and so on) are excluded from our analysis. Polarimetry with the HOWPol suffers from large instrumental polarization (%) caused by the reflection of the incident light on the tertiary mirror of the telescope. The instrumental polarization was modeled as a function of the declination of the object and the hour angle at the observation, and we subtracted it from the observed value. The polarization angle (PA) is defined in the standard manner as measured from north to east. The PA was calibrated with two polarized stars, HD183143 and HD204827 (Schulz & Lenzen, 1983). Because the PA has an ambiguity of (where is an integer), we selected which gives the least angle difference from the previous data, assuming that the PA would change smoothly. We confirmed that the error of PD in the instrumental polarization correction is smaller than 0.5% and the error of PA is smaller than from observations of unpolarized and polarized stars. The typical standard deviations of the Stokes parameters of the comparison star during the observation were and which corresponds to . These values were added to the polarimetric errors of PMN J0948+0022 in each observation.
| MJD | Start & End time (UT) | Interval∗ | |
|---|---|---|---|
| 56281 | 18.04 – 20.94 | 160 s | 51 |
| 56283 | 17.17 – 20.69 | 220 s | 26 |
| 56284 | 17.76 – 20.18 | 260 s | 22 |
| 56295 | 16.59 – 18.86 | 310 s | 14 |
| 56342 | 17.74 – 19.21 | 100 s | 16 |
| 56343 | 13.11 – 15.88 | 160 s | 18 |
∗ CCD read out time (10 s) is included.
3 Results
Figure 1 shows a long-term history of RC-band flux and spectral index from 2012 December 20 (MJD 56281) to 2013 February 20 (MJD 56356). A local two-point spectral index is defined between two brightness measurements , at frequencies and , respectively, as . We use the mean wavelengths of the filters, 658.8 nm for the RC band, 550.5 nm for the V band and 485.8 nm for the g’ band. We calculate the spectral index with the RC and the V band data except the data on MJD 56282, on which the spectral index is calculated with the RC and the g’ band data. The error bars include both statistical and systematic ones. Large variation has been detected in the RC-band flux and an amplitude of total flux reaches a factor of 4. On the other hand, the variation of the spectral index is relatively small and there are no clear correlation between the optical flux and the spectral index.

Figure 2 and 3 show results of temporally high-dense monitoring of PMN J0948+0022 and figure 4 shows an enlarged view of temporal variation of the polarized flux and PA on MJD 56281. Light curves of -band polarized flux (PF) are calculated by , where and are a measured polarization degree in unit of % and a total flux in the band. Rapid and violent outburst of optical flux and PF was clearly detected on MJD 56281. The object brightened by a factor of 2 in the total flux and by a factor of 6 in the PF around 19.6 UT within a few hours. The variation pattern of PD is quite similar to that of total flux. Discrete correlation function (DCF; Edelson & Krolik, 1988) between the RC-band total flux and PD on MJD 56281 shows a good correlation (DCF value of 0.92) with no significant time lag; an upper limit of lag is minutes. In the outburst state, PD reaches at maximum on MJD 56281. This value is twice as high as that in the past observations of this object (Ikejiri et al., 2011).
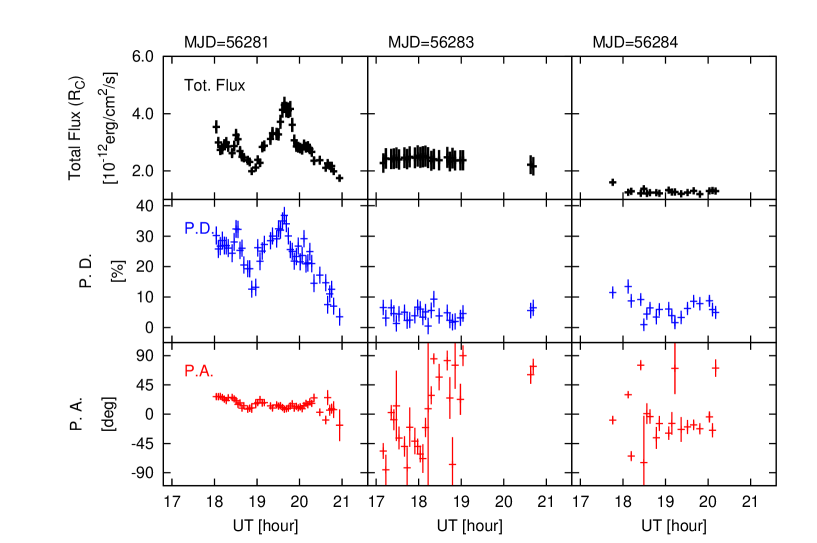
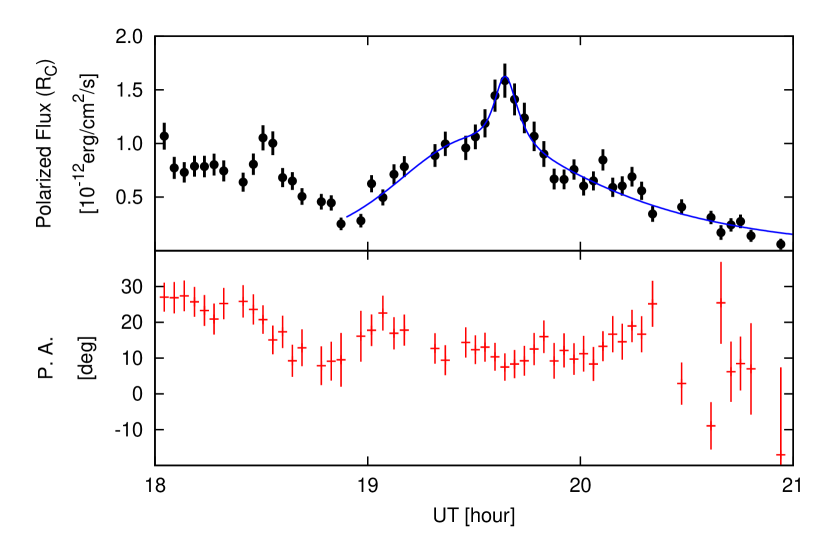
The light curve on MJD 56281 has some structures. It seems that there are two flaring components which have a different variability timescale. We tried a light curve fitting with the following function to reproduce the time profile of outburst around 19.6 UT (Abdo et al., 2010b):
| (1) |
where represents an assumed constant level underlying the outburst, and measures the amplitude of the flares, and describe approximately the time of the peak, and measure the rise time and and measure the decay time. Suffixes mean the long-term and the short-term component. We obtained min and min for the long-term component and min and min for the short-term component. The characteristic flare duration can be estimated as . There is a significant difference of variability timescale between two flares. In contrast, PA maintains its value during the outburst around 19.6 UT with an average value of deg. We also obtained the upper limit of erg cm-2 s-1.
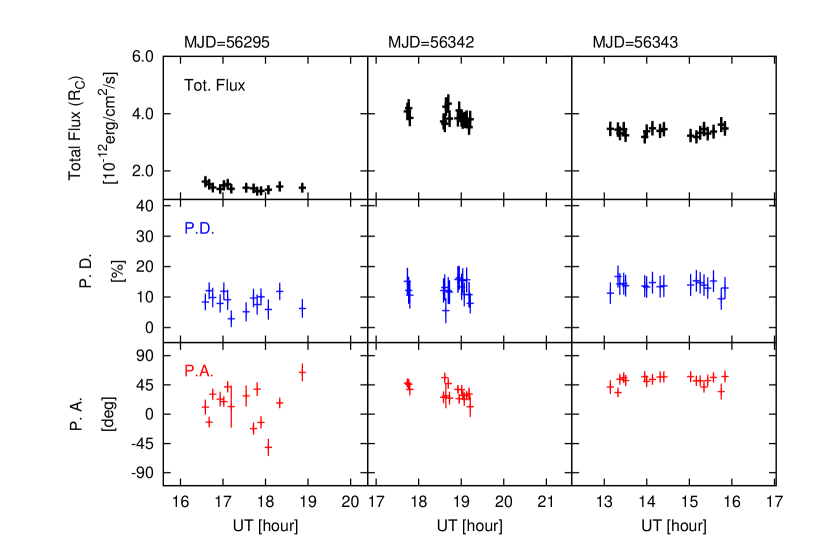
Except the MJD 56281, there is no significant micro variability of total flux and PD while the daily light curve indicates significant variability from MJD 56283 to 56284. Data on MJD 56283, 56284 and 56295 show a low PD value of . It seems that there is micro variability of PAs during these periods, but it could be due to low statistics. In MJD 56342 and 56343, a relatively increased total flux was observed with no significant micro variability. During these periods, a total flux is constant but higher than that of MJD 56281. There are also no significant micro variability of PAs on MJD 56342 and 56343 but a gradual increasing of PA is implied. PD is also higher than that on MJD 56283 and 56284. The average of PAs is and deg in MJD 56342 and 56343, respectively, and these are slightly different from that on MJD 56281 (PA is deg).
4 Discussion
Thanks to one-shot photopolarimetry of the HOWPol, we obtained the highly variable light curve of polarized flux on MJD 56281. In particular, the light curve in the latter night of the same day (around 19–21 UT) consisted of two major pulses whose variability timescales (rise and decay times) are of the order of minute and hour. No significant time lags between flux and PD would indicate that the short-duration pulse occurred in the shock-compressed region with highly ordered magnetic field. This minute-scale variability suggests a very compact emission region of the order of cm, where is typical size of the emission region, is the speed of light, is beaming factor, and is the observed variability timescale. In addition, the very high PD of up to 36% observed during the short-duration pulse requires highly ordered magnetic field inside the very compact emission region.
NLSy1s are in general believed to have relatively smaller central BH mass compared to typical blazars (see §1). If we assume that the variability timescale is determined by the activity of central BH, its lower limit is the light crossing time of BH horizon s, where is the Schwarzshild radius and is the mass of central BH. This is in good agreement with the observed timescale, which may indicate that the central BH mass of PMN J0948+0022 is indeed small as was estimated by Yuan et al. (2008) under the conical structure assumption. On the other hand, However, larger BH mass cannot be ruled out if the conical assumption is not held and the emission region size is estimated to be larger by the Doppler factor than the observed time scale. We finally note that such an minute-scale variability has recently been detected by Paliya et al. (2013), too and hence it is robust that PMN J0948+0022 shows this kind of rapid variability in the optical band.
High spatial resolution radio images toward the core of PMN J0948+0022 taken with VLBI revealed presence of parsec-scale jet and the jet is directed at 30 deg (Doi et al., 2006). Since the magnetic field direction is usually assumed to be perpendicular to the PA, the observed optical PA of 15 deg implies that the magnetic field direction at the emission site is roughly transverse to the jet direction. This reminds us of well-known internal shock scenario (Hughes & Miller, 1991) to explain the outburst. If this is the case, relativistic shells emitted from central BH intermittently with an interval of collide at cm and internal transverse shock is generated there. Compression of magnetic field by the transverse shock would generate highly ordered magnetic field inferred from the observed high PD. The variability timescale for hour-scale suggests the size of the emission region of cm, which is consistent with the standard conical jet assumption () of the opening angle of . We speculate that the transverse shock generated relatively compact emission region of cm with highly ordered magnetic field.
If the minute-scale pulse is indeed radiated by very compact and different blob from larger emission region responsible for the underlying hour-scale pulse, sudden change of PA may be accompanied because magnetic field direction inside the very compact blob does not need to be the same as that of the larger emission region. Of course there are some possibilities that are able to explain the constant PA with superposition of two emission regions, such as the scenario with accidental coincidence of magnetic vectors in two emission regions. We propose other possibilities to explain the mechanism of variability of flux and polarization other than the scenario postulating two emission regions. Among them, the model with a single emission region that internal shocks are arisen from colliding relativistic shells in the jet also can interpret the change of variability timescale due to an increasing size of emission region as reported in Böttcher & Dermer (2010). The authors predicted a temporally asymmetric light curve and our results support this scenario. Our results of constant PA around 19.6 UT indicates that the outburst might be originated in single emission region and the change of variability timescale caused by a propagation of a emission region in the jet.
Similar short timescale (from a few minutes to a few hours) variability of polarization are reported from blazar jets, such as AO 0235+164, S5 0716+714 and CTA 102 (Hagen-Thorn et al., 2008; Sasada et al., 2008; Itoh et al., 2013). But it should be noted that these blazars not always shows the correlation between total flux and PD in the micro variability. In addition, simultaneous short-term photopolarimetric observations have been performed in several blazars (Andruchow et al., 2003; Cellone et al., 2007; Andruchow et al., 2011), and only a few blazar show the correlation between the total flux and PD. In some blazars, the multi-zone model which have several emission regions are applied to explain these randomly correlations between the total flux and PD in micro variability (e.g., Uemura et al., 2010; Rafle et al., 2012). On the other hand, our results indicates the model with a single emission region in the jet of PMN J0948+0022 as mentioned above. This assumption might be reflecting a difference in the formation rate of blobs between NLSy1s and blazars. Namely, a pure synchrotron radiation from intermittent emergence of single blob can be seen in RL-NLSy1 jets. The low values of PD in quiescent states and no significant underlying component in MJD 56281 (PF erg cm-2 s-1) support this scenario. Of course there is only one short-term photopolarimetric observation of PMN J0948+0022, thus more photopolarimetric observations of RL-NLSy1s in the short time variability will be needed to study the relation between RL-NLSy1 jets and blazar jets.
We also found that the total flux increased by a factor of 2 on MJD 56342, 61 days after the first observation (see also Figure 1). Motivated by this brightening, we conducted continuous polarimetric observation over the subsequent two nights. As shown in Figure 2 and Figure 3, temporal profiles of the total flux, PD and PA did not show significant variation during the exposures, but we note that PD was somewhat increased from % to 15% compared to the previous observations on MJD 56283, 56284, and 56295. These results would be understood in terms of the large-scale emission region of cm, by substituting the variability timescale greater than s. In addition, PDs on MJD 56342 are lower than that on MJD 56281. No significant micro variability except the data on MJD 56281 indicates that there are various timescales of variability. In general, the size of emission region is related with the location of emission region in the jet. These differences of emission regions give weak correlation between the total flux and PD on long-term variability.
In conclusion, we performed optical polarimetric observation of RL-NLSy1 PMN J0948+0022 using Kanata/HOWPol and Murikabushi/MITSuME on December 2012 to February 2013 after the near-infrared and -ray flux enhancements. Our findings are (1) highly variable total and polarized fluxes but almost constant PA, (2) Minute-scale variability in the light curve of polarized flux, (3) very high maximum PD of 36%, and (4) PA is grossly directed to the par sec-scale jet. The high and dramatic change of PD indicates that synchrotron emission in a highly ordered magnetic field is responsible for the optical emission. The observed variability timescale of minutes is in good agreement with the light crossing time of Schwarzshild radius of the central BH under the assumption of . We note that The transverse shock inside a jet (known as “shock-in-jet” model) is consistent with the jet-directed PA and compression of magnetic field by the shock can generate highly ordered magnetic field. We also considered models of two radiation region scenario as well as that of a single emission region scenario. Our results of constant PA around 19.6 UT indicates that the outburst might be originated in the single emission region while other many blazar explained with the multi-zone model. It might be reflecting a difference of jets between NLSy1s and blazars if our assumptions are correct. We also searched relation between the appearance of micro variability and the flux state, but did not find clear correlation. This result indicates that the mechanism of flux variability is different between the long-term (from a few days to a few weeks) and the short-term component (intra-night).
This work is supported by Japan Society for the Promotion of Science, Grants-in-Aid for Scientific Research Nos, 17684004, 20740107, 21018007, 23340048, 14GS0211 and 19047003 and Optical and Near-infrared Astronomy Inter-University Cooperation Program by the Ministry of Education, Culture, Sports, Science and Technology of Japan.
References
- Abdo et al. (2009) Abdo, A. A., et al. 2009, ApJ, 707, L142
- Abdo et al. (2010a) —. 2010a, Nature, 463, 919
- Abdo et al. (2010b) —. 2010b, ApJ, 722, 520
- Adelman-McCarthy et al. (2007) Adelman-McCarthy, J. K., et al. 2007, ApJS, 172, 634
- Andruchow et al. (2003) Andruchow, I., Cellone, S. A., Romero, G. E., Dominici, T. P., & Abraham, Z. 2003, A&A, 409, 857
- Andruchow et al. (2011) Andruchow, I., Combi, J. A., Muñoz-Arjonilla, A. J., Romero, G. E., Cellone, S. A., & Martí, J. 2011, A&A, 531, A38
- Beasley et al. (2002) Beasley, A. J., Gordon, D., Peck, A. B., Petrov, L., MacMillan, D. S., Fomalont, E. B., & Ma, C. 2002, ApJS, 141, 13
- Böttcher & Dermer (2010) Böttcher, M., & Dermer, C. D. 2010, ApJ, 711, 445
- Calderone et al. (2013) Calderone, G., Ghisellini, G., Colpi, M., & Dotti, M. 2013, MNRAS, 431, 210
- Carrasco et al. (2012) Carrasco, L., Recillas, E., Miramon, J., Porras, A., & Carraminana, A. 2012, The Astronomer’s Telegram, 4659, 1
- Cellone et al. (2007) Cellone, S. A., Romero, G. E., Combi, J. A., & Martí, J. 2007, MNRAS, 381, L60
- D’Ammando & Orienti (2013) D’Ammando, F., & Orienti, M. 2013, The Astronomer’s Telegram, 4694, 1
- Doi et al. (2006) Doi, A., Nagai, H., Asada, K., Kameno, S., Wajima, K., & Inoue, M. 2006, PASJ, 58, 829
- Edelson & Krolik (1988) Edelson, R. A., & Krolik, J. H. 1988, ApJ, 333, 646
- Eggen et al. (2013) Eggen, J. R., Miller, H. R., & Maune, J. D. 2013, ArXiv e-prints
- Fossati et al. (2008) Fossati, G., et al. 2008, ApJ, 677, 906
- Hagen-Thorn et al. (2008) Hagen-Thorn, V. A., Larionov, V. M., Jorstad, S. G., Arkharov, A. A., Hagen-Thorn, E. I., Efimova, N. V., Larionova, L. V., & Marscher, A. P. 2008, ApJ, 672, 40
- Hughes & Miller (1991) Hughes, P. A., & Miller, L. 1991, Introduction: synchrotron and inverse-Compton radiation, ed. P. A. Hughes, 1
- Ikejiri et al. (2011) Ikejiri, Y., et al. 2011, PASJ, 63, 639
- Itoh et al. (2013) Itoh, R., et al. 2013, ApJ, 768, L24
- Kawabata et al. (2008) Kawabata, K. S., et al. 2008, in Society of Photo-Optical Instrumentation Engineers (SPIE) Conference Series, Vol. 7014, Society of Photo-Optical Instrumentation Engineers (SPIE) Conference Series
- Komossa et al. (2006) Komossa, S., Voges, W., Xu, D., Mathur, S., Adorf, H.-M., Lemson, G., Duschl, W. J., & Grupe, D. 2006, AJ, 132, 531
- Liu et al. (2010) Liu, H., Wang, J., Mao, Y., & Wei, J. 2010, ApJ, 715, L113
- Marscher et al. (2008) Marscher, A. P., et al. 2008, Nature, 452, 966
- Miller & Noble (1996) Miller, H. R., & Noble, J. C. 1996, in Astronomical Society of the Pacific Conference Series, Vol. 110, Blazar Continuum Variability, ed. H. R. Miller, J. R. Webb, & J. C. Noble, 17
- Nolan et al. (2012) Nolan, P. L., et al. 2012, ApJS, 199, 31
- Paliya et al. (2013) Paliya, V. S., Stalin, C. S., Kumar, B., Kumar, B., Bhatt, V. K., Pandey, S. B., & Yadav, R. K. S. 2013, MNRAS, 428, 2450
- Rafle et al. (2012) Rafle, H., Webb, J. R., & Bhatta, G. 2012, Journal of the Southeastern Association for Research in Astronomy, 7, 33
- Sasada et al. (2008) Sasada, M., et al. 2008, PASJ, 60, L37
- Schlafly & Finkbeiner (2011) Schlafly, E. F., & Finkbeiner, D. P. 2011, ApJ, 737, 103
- Schulz & Lenzen (1983) Schulz, A., & Lenzen, R. 1983, A&A, 121, 158
- Uemura et al. (2010) Uemura, M., et al. 2010, PASJ, 62, 69
- Yuan et al. (2008) Yuan, W., Zhou, H. Y., Komossa, S., Dong, X. B., Wang, T. G., Lu, H. L., & Bai, J. M. 2008, ApJ, 685, 801
- Zhou et al. (2003) Zhou, H.-Y., Wang, T.-G., Dong, X.-B., Zhou, Y.-Y., & Li, C. 2003, ApJ, 584, 147