Tunneling spectroscopy for probing orbital anisotropy in iron pnictides
Abstract
Using realistic multi-orbital tight-binding Hamiltonians and the -matrix formalism, we explore the effects of a non-magnetic impurity on the local density of states in Fe-based compounds. We show that scanning tunneling spectroscopy (STS) has very specific anisotropic signatures that track the evolution of orbital splitting (OS) and antiferromagnetic gaps. Both anisotropies exhibit two patterns that split in energy with decreasing temperature, but for OS these two patterns map onto each other under rotation. STS experiments that observe these signatures should expose the underlying magnetic and orbital order as a function of temperature across various phase transitions.
pacs:
74.55.+v, 74.70.Xa, 75.25.Dk, 75.10.LpI Introduction
High-temperature superconductivity is among the most active areas of research in condensed matter physics, with most of the focus on the initially discovered cuprates Bednorz and Müller (1986) and the newer iron-based superconductors. Kamihara et al. (2008) Both of these materials also possess intriguing normal states, involving magnetic order and electronic anisotropy, which have received much attention. de la Cruz et al. (2008); Si and Abrahams (2008); Fang et al. (2008); Yildirim (2008); Krüger et al. (2009); Chen et al. (2010); Fernandes et al. (2012); Kemper et al. (2009); Chuang et al. (2010); Hoffman (2011); Yi et al. (2011); Kasahara et al. (2012) Unlike cuprates, the iron materials require multiband models since all iron d-electron orbitals contribute to the low-energy physics. As such, there are many important facets of orbital effects and their interplay with magnetic and structural order across the rich phase diagram in the pnictides.
Structural, spin, and orbital anisotropy are observed at various temperatures. Neutron scattering displayed a collinear antiferromagnet (AFM) and an orthorhombic structural distortion, de la Cruz et al. (2008) which have similar transition temperatures, and . Many experiments have observed electronic anisotropy Chu et al. (2010); He et al. (2010); Tanatar et al. (2010); Dusza et al. (2011); Harriger et al. (2011); Kim et al. ; Kuo et al. (2011); Song et al. (2011); Yi et al. (2011); Arham et al. (2012); Dusza et al. (2012); Jesche et al. (2012); Kasahara et al. (2012); Yi et al. (2012); Zhang et al. (2012) even as high as 30 K above and . Kasahara et al. (2012) Specifically, orbitally split - and -dominated bands have been observed in both BaFe2As2 and NaFeAs. Yi et al. (2011, 2012) There seems to be cooperation among orbital, structural, and magnetic anisotropies since they all decrease in magnitude with doping. However, their microscopic source needs to be further clarified. Si and Abrahams (2008); Fang et al. (2008); Yildirim (2008); Fernandes et al. (2012); Xu et al. (2008); Haule et al. (2008); Mazin and Johannes (2008); Yin et al. (2008); Han et al. (2009); Wysocki et al. (2011); Stanek et al. (2011); Kamiya et al. (2011); Daghofer et al. (2012); Daghofer and Fischer (2012); Krüger et al. (2009); Singh ; Chen et al. (2009a); Lv et al. (2009); Lee et al. (2009); Kubo and Thalmeier (2009); Chen et al. (2010); Lv et al. (2010); Bascones et al. (2010); Yanagi et al. (2010a); Kontani et al. (2011); Lv and Phillips (2011); Nevidomskyy ; Applegate et al. (2012); Cvetkovic and Tesanovic (2009); Knolle et al. (2010a); Brydon and Timm (2009); Zhai et al. (2009); Fernandes et al. (2012)
Understanding the microscopic Hamiltonian would shed light on superconducting and normal state properties. For example, inter-orbital electron-electron interactions, possibly driven by strong electron-phonon coupling, yield -wave superconductivity from orbital fluctuations.Kontani and Onari (2010); Yanagi et al. (2010b) These naturally give rise to orbital ordering (OO). Alternatively, strong intra-orbital interactions, driven by spin fluctuations, produce - or -wave superconductivity.Kuroki et al. (2008); Mazin et al. (2008); Parish et al. (2008); Seo et al. (2008); Chen et al. (2009b); Wang et al. (2009) This naturally results in anisotropic spin-density waves (SDW) from nesting in the parent compound. Such interactions may also lead to OS, Bascones et al. (2010) for example via nematic spin fluctuations. Daghofer et al. (2012); Daghofer and Fischer (2012); Fernandes et al. (2012) This view may be supported if the OS is much smaller at the Brillouin zone (BZ) center than the zone boundary, whereas a similar OS throughout would allow for ferroorbital ordering as the cause. Daghofer et al. (2012); Daghofer and Fischer (2012) However, the presence of zone center OS is unclear because the relevant bands are above the Fermi energy, , which ARPES does not image. An alternative study is therefore needed.
STS has been pivotal in imaging anisotropic patterns around impurities in the local density of states (LDOS) and in its Fourier transform, attributed to quasiparticle interference (QPI). Chuang et al. (2010); Zhou et al. (2011); Song et al. (2011); Machida et al. (2012); Allan et al. (2013); Rosenthal et al. In the pnictides, these features may be attributed to a number of different sources, including itinerant Kemper et al. (2009); Knolle et al. (2010b); Huang et al. (2011); Rosenthal et al. or local Mazin et al. (2011) anisotropic antiferromagnetism, OO, Inoue et al. (2012); Kang and Tešanović (2012), anisotropic potentials, Allan et al. (2013) or impurity-pinned magnetic order. Gastiasoro et al. All involve symmetry breaking by distinguishing between and directions. Based on the STS experiments to date, it remains a challenge to clearly identify specific features of antiferromagnetism and OO.
In the present study, we propose using STS-derived LDOS patterns as a way to distinguish OS and AFM. As both produce band extrema (BE), i.e. local maxima or minima in the bands, that break symmetry, broken LDOS patterns at these BE differentiate between OS and AFM. For OS, the difference between BE energies identified by STS patterns is the OS magnitude. Its presence or absence above would address the connection between OS and orthorhombicity. Our theory employs a realistic five-orbital model with a self-consistently derived mean field SDW order parameter. We provide prescriptions regarding energy and temperature ranges in which to find specific signatures.
The structure of this paper is as follows. In Sec. II, we present the five-orbital model, including a simple phenomenological OS and a mean field orbitally resolved SDW, and outline the -matrix theory used to generate tunneling spectra. In Sec. III, we present STS patterns that track the OS magnitude via BE splitting and explain their connection to the OS dependence on magnetism (Sec. III.1). In Sec. III.2, we show how BE splitting also arises due to AFM gaps and how it can be distinguished from OS. In Sec. III.3, we present further STS behavior that can be attributed to the interdependence of magnetic and orbital ordering. Finally, we summarize and outline the experimental steps needed to discover these signatures in Sec. IV.
II Theory
We develop theory to obtain OS and SDW effects due to BE splitting, which occurs in all observed iron pnictides. We present results for a five orbital model of LaFeAsO, Graser et al. (2009) but the five Fe orbitals are key for all pnictides and their low energy band structures are qualitatively similar. In particular, they all have and BE at high symmetry points in the BZ that exhibit OS. Chen et al. (2010); Yi et al. (2011, 2012); Lv and Phillips (2011); Deng et al. (2009); Kusakabe and Nakanishi (2009) They also may have AFM gaps that give rise to BE and need to be distinguished from those due to OS. Although they exhibit different OS and AFM strengths, we show that the resulting BE splittings yield similar results. We make detailed choices for material parameters and OS and AFM magnitude, but the resulting BE splitting effects are general to pnictides.
We employ five-orbital models with the kinetic energy part,
| (1) |
Here creates an electron with momentum and spin in the orbital ( is also an orbital index) and . Hopping parameters and the orbital energies are listed in the appendix of Ref. Graser et al., 2009. This part of the model results from a tight-binding fit to the density-functional theory band structure of LaFeAsO, for which two dimensional bands are sufficient. Graser et al. (2009)
Unless otherwise noted, the chemical potential is adjusted to maintain a filling of electrons per unit cell corresponding to undoped stochiometric pnictide materials. An orbital basis is chosen that is aligned parallel to the nearest neighbor Fe–Fe direction and hence we use a 1 Fe per unit cell BZ. We renormalize bands down by a factor , so that the energies are closer to those observed with photoemission in BaFe2As2 and NaFeAs. Yi et al. (2011, 2012) Throughout, we set lattice constants and use meV for energy units.
We analyze onsite multiorbital electron-electron interactions
where denotes the lattice site and . Spin rotational invariance requires and in the absence of exchange anisotropy holds for each pair of interacting orbitals. Oles’ and Stollhoff (1984) We apply these simplifications to our Hamiltonian.
To model the materials at , we explicitly introduce OS into the Hamiltonian. Its presence is empirically verified by experiment and both electron-electron and electron-phonon interactions may naturally give rise to OO. Krüger et al. (2009); Bascones et al. (2010); Saito et al. (2010) Since we are interested primarily in the STS phenomenology, we keep the OS fixed Yi et al. (2011); Lv and Phillips (2011)
| (3) | |||
| (4) |
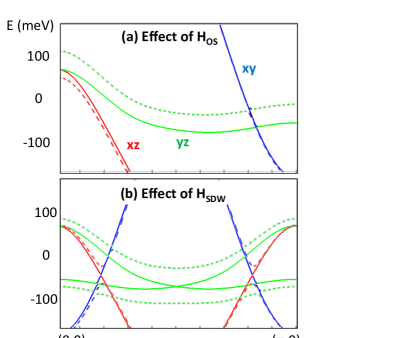
The OS magnitude, , is the energy splitting between and bands, and its monotonic increase reflects decreasing temperature. Yi et al. (2011, 2012); Kim et al. The ratio and the maximum meV that we use follow the observed quantities.Yi et al. (2011) shifts the bands down (up) according to their amount of () content, as in Fig. 1(a). The key feature is the OS at BE, whereas the full momentum dependence of the putative OS term is not as important for the small band changes considered.
For , we perform a mean-field decoupling of the interaction in Eq. II, employing the SDW order parameters
| (5) |
where we take and the elements of the magnetization matrix at site are
| (6) |
The complete mean-field decoupling of the interaction term Eq. II with respect to the local SDW order parameters leads to
| (7) |
The matrix is given by
| (8) |
Here we have introduced the sum of the orbitally projected moments, .
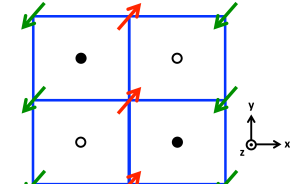
is mostly diagonal, except for the two possible nonzero off-diagonal entries in the sector, as required by symmetry arguments. Lv and Phillips (2011) We imagine a single FeAs layer in the ”striped” state, as schematically drawn in Fig. 2, and consider the following symmetry operations: reflection with respect to the vertical y-axis plus inversion with respect to the perpendicular z-axis. This transformation leaves the spin structure of the state unchanged. However, the operator changes into . If we define the unitary operator by , which corresponds to the above described symmetry operation, then obviously . This implies necessarily and therefore for and . Conversely, for the symmetry operation yields and hence the expectation value of the latter operator may indeed be finite in the SDW state. Similar arguments with various reflection axes require all other off-diagonal components to be zero.
The translationally invariant density matrix is
| (9) |
in which denotes the orbital occupation per site for orbital . , , , and are determined self-consistently for a given temperature and the fixed total filling. This involves the diagonalization of the Hamiltonian in matrix form. Its block form in momentum space is
| (12) | ||||
| (15) |
where the matrix contains the kinetic energy entries and the entries of are .
In the following we report results for meV and , taking the view that intra-orbital repulsion dominates. This gives a small zero-temperature moment , Daghofer et al. (2010) as expected for this material. de la Cruz et al. (2008) Furthermore, in self-consistent calculations of OS, Bascones et al. (2010); Daghofer et al. (2010) similar parameter choices result in significant OS. Daghofer et al. Daghofer et al. (2010) argue the OS is small, since the orbital polarization per site of order 0.1 is much smaller than the magnetic moment. However, we found this polarization corresponds to an OS of around 60 meV in the band structure, as in experiments. Yi et al. (2011, 2012) This is similar to the SDW gap magnitudes, as in Fig. 1.
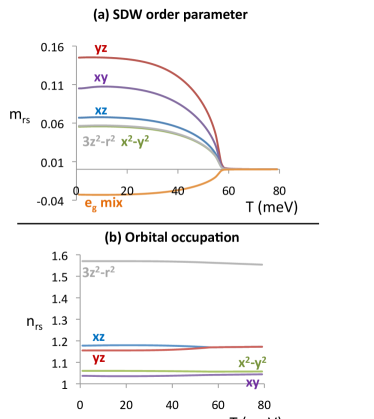
The strong intra-orbital repulsion intimately couples both OS and SDW magnetism. The orbital dependence is shown for the projected moments in Fig. 3(a). We use a momentum mesh of points. Most nonzero entries of are on the diagonal, which corresponds to intra-orbital gaps, i.e. between bands with similar orbital content. Therefore, gaps band crossings according to the orbital similarity between the crossed bands, as in Fig. 1(b). A gap opens in the crossing of -dominated bands, as well as the crossing of the and bands, since they have similar subdominant orbitals. Conversely, the crossing of and bands does not open a gap because the bands have no orbital similarity. Notice that as the gaps open, the bands shift and cause a small OS between and bands, even without including . This affects the whole BZ, as seen from the splitting in the orbital occupations in Fig. 3(b).
We model temperatures with not only the SDW term but also OS: . We allow OS to affect the SDW by performing the self-consistent calculation as before but with holding meV fixed throughout the calculation. Although SDW alone causes some OS, we include because the presence of OS above suggests that there is an SDW-independent contribution. Also, the OS we obtain due to SDW alone is less than meV at down to , i.e. much smaller than measured.
In order to investigate impurity effects, we employ the -matrix for a single non-magnetic impurity, using matrix Green function methods. Han and Wang (2009); Balatsky et al. (2006); Andersen (2003); Hirschfeld et al. (1988) We start with the Hamiltonian matrix in Eq. 15 for the SDW phase or its upper left block in the absence of SDW. The bare Green function, without the impurity, is . We assume momentum-independent impurity scattering, , as arises from a site energy shift by at the impurity’s position.
| (16) | ||||
| (17) | ||||
| (20) |
There are a range of impurity strengths expected among the pnictides. Nakamura et al. (2011); Berlijn et al. (2012) We assume a non-magnetic scattering strength meV for all orbitals, consistent with density-functional calculations on Co-doped BaFe2As2. Kemper et al. (2009) While the qualitative results presented here are clearest near this impurity strength, they are still obtained for strengths between to meV. Hopping disorder also leads to qualitatively similar results. Vishik et al. (2009) Note that only the diagonal entries of each block in are non-zero, so the scattering is intra-orbital. We avoid inter-orbital scattering, Zhang (2009) as it violates reflection symmetries about the and axes and leads to unphysical LDOS patterns. The full Green function at position is
| (21) |
where is the Fourier transform of . Then, the LDOS contributions from a single orbital is
| (22) |
with , a matrix with SDW or a scalar without. The two terms in Eq. 22 are the spatially uniform DOS and the impurity-contributed LDOS. The total LDOS without orbital resolution is the sum of the 5 orbital LDOS’s. To calculate the QPI patterns in momentum space, either the full or the orbitally projected LDOS is Fourier transformed. We set meV to resolve STS patterns that are split by a few meV. We used a real space grid with closed boundary conditions, where impurity effects are negligible.
III Results and Discussion
III.1 Signatures of Orbital Splitting
We present STS patterns to identify OS signatures involving BE at two nearby energies with increasing splitting as temperature decreases. While these are clearly resolved in LDOS spectra they are only partially revealed in QPI. The distance between two BE energies is a measure of the magnitude of OS. We explain how a comparison to the SDW gap magnitudes clarifies the OS dependence on magnetism.
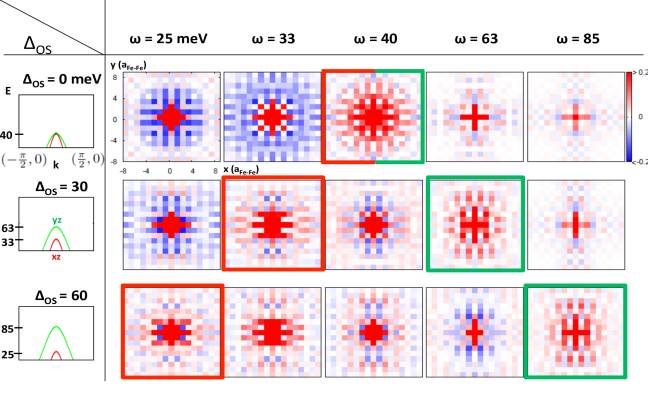
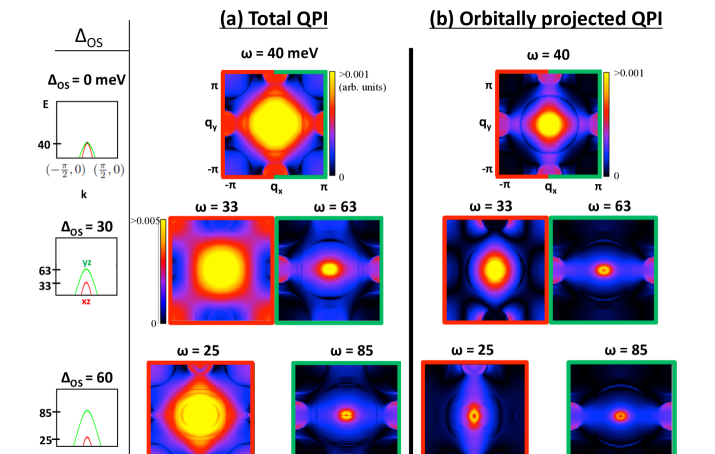
The LDOS identifies and tracks OS by BE splitting due to a large contribution to from the flat portions of the band structure. In Fig. 4, we plot LDOS patterns due to an impurity with . We show the LDOS evolution for several energies as temperature decreases, mimicked by an increase in in the figure’s left column. Patterns with finite exhibit symmetry breaking, but more detailed signatures are needed to distinguish OS from other sources of symmetry breaking such as the SDW. Just above at the zone center, there are two BE, one with character and another one with character. We follow the LDOS at their energies as the bands evolve with increasing . The LDOS patterns are outlined in red (green) at the energy of the BE of the () band. The patterns outlined at meV ( meV) for the () band are very similar to each other and distinct from the other patterns; When the energy of the band at the zone center shifts to a new value, there is a corresponding LDOS pattern that also shifts to this new value. In contrast, patterns at other energies are not as sensitive to small OS changes, as seen by comparing the two patterns not outlined at the energies or meV. We show this splitting effect at OS magnitudes of 30 and 60 meV, and it is robust down to the resolution limit of around 10 meV. This leads to one clear signature of OS: As one increases OS, there are two LDOS patterns that increasingly shift away from each other, leaving the other patterns unchanged. Measuring the energy separation between these two patterns yields the magnitude of OS.
These patterns display a rotation relation that is unique to OS: Applying a rotation about the axis to the LDOS pattern corresponding to the BE yields the pattern, because the orbitals themselves interchange under this rotation. The similarity is however not perfect because of contributions from other orbitals and different bands at these energies, as explained below. These two patterns superimpose at the same energy for , where the two BE are degenerate. OS is therefore identified by two patterns at nearby energies that mostly map onto each other under 90 rotation; these patterns superimpose at high temperatures where a putative OS is small.
Although QPI is the Fourier transform of the LDOS, it only exhibits part of the OS signatures and seems less suitable for tracking OS. Fig. 5(a) shows the QPI patterns at the same energies and values as in the outlined LDOS patterns in Fig. 4. The patterns at meV match, tracking the BE as OS increases. However, one does not obtain a pattern shifting at lower energies. There is thus no signature of two patterns that map onto each other under rotation. The reason is that the pattern is obscured by contributions from other orbitals. This is seen by projecting out these contributions in Fig. 5(b), plotting only the and contributions. This recovers the full OS signature: Two QPI patterns shift away from each other with increasing OS and these two patterns map onto each other under rotation (apart from minor obscuring at meV due to other contributions). However, this projection is not currently feasible in experiments. Conversely, in the total LDOS, contributions from other orbitals are concentrated within two sites of the impurity, but they are less significant at further distances where OS patterns appear. Therefore, the LDOS seems to be a better probe than QPI for detecting and measuring OS.
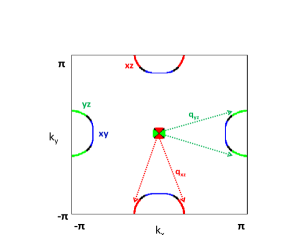
The reason that LDOS tracks BE is understood by considering the LDOS’s relation to the band structure. A BE can cause a distinct STS pattern due to its large spectral weight in a small part of space. The resulting QPI pattern resembles the constant energy contour (CEC) of the bands at the energy of the BE, similar to the observed spectra in the superconducting state. Hänke et al. (2012) The corresponding LDOS pattern follows the BE energy as it shifts. This also explains the rotation relation: due to intra-orbital scattering, the BE only scatters to portions of the CEC of similar orbital content, as shown in Fig. 6. Since the and portions follow the rotation relation, the same relation appears in the LDOS patterns. In summary, OS can be identified and tracked by the temperature (or ) dependence of two distinctive LDOS patterns, similar under rotation, that split in energies corresponding to the BE.
The measurement of the OS magnitude and the comparison to the SDW gap may clarify the dependence of OS on magnetism. We treated the case of large OS at the zone center, which is only predicted by theories such as ferroorbital ordering. Daghofer et al. (2012); Daghofer and Fischer (2012) In scenarios like OS driven by spin fluctuations, Fernandes et al. (2012) where OS at the zone center is much smaller, STS may still measure it. Also, OS is larger at other momenta, and BE at the corresponding energies would produce -rotated patterns. Another possibility is that SDW causes OS as bands of similar orbitals repel each other. This is noticeable in Fig. 1(b), where the gapping shifts the upper band above the band. However, this repulsion can shift two bands apart by at most the SDW gap magnitude. Moreover, we find the SDW-induced OS to be much smaller than the average SDW gap, by more than an order of magnitude at the zone center, for example (Fig. 1(b)). This is also suggested in Fig. 3(b) by the small difference in orbital occupation, reaching a maximum of 0.02. Therefore, observing OS of the same order as an SDW gap would imply that they are mostly independent of the SDW, and an even larger OS would definitively rule out SDW gaps as the sole cause. Conversely, a small OS allows for a dependence on the SDW, and momentum dependence may further support the connection to spin fluctuations.
III.2 Signatures of a Collinear Spin-Density Wave
In principle, any BE that shifts in energy leaves a signature in the LDOS. Here, we present signatures of BE splitting due to an SDW gap using . The inclusion of OS does not change the qualitative conclusions. For the SDW itself these signatures may not provide new information, as the spatially uniform DOS is often sufficient to measure gaps. However, to identify OS as in the previous section, one needs to distinguish it from other forms of BE splitting. We show several differences for the SDW and highlight that pattern similarity under 90 rotation is unique to OS.
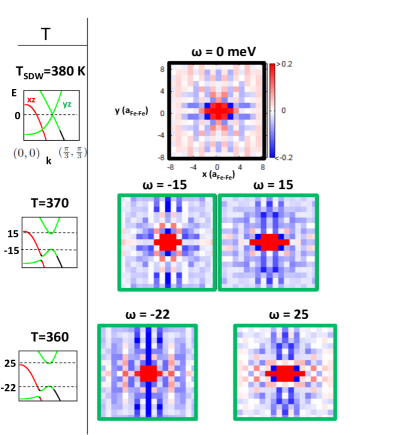
The LDOS may track an SDW gap magnitude by BE splitting in a manner different from OS, as shown in Fig. 7. As temperature decreases, an SDW band gap bordered by two BE grows. At each temperature, we plot the LDOS at the energies of the BE. As for OS alone, we find two patterns at meV ( meV) that are similar. For the SDW, these patterns track the gap magnitude. However, several features are attributed specifically to the SDW rather than OS: The patterns of the two BE are similar without any rotation; a strong positive is visible close to the impurity while a negative extends away from it in the y direction. This similarity is caused by BE on either gap edge having similar orbital content, since they originate from the same magnetic BZ (MBZ) crossing point. Additionally, unlike OS for , there is no BE pattern at , since the gap closes and its BE disappear. Furthermore, these signatures are not as clear as those of OS because the SDW reconstructs the bands, which alters the BE pattern as temperature decreases. Also, there are more contributions from other bands in the energy range of the SDW gaps than the BE that orbitally split. Note that these splitting effects are shown for SDW gaps of 30 and 60 meV and are robust down to the resolution limit of around 10 meV. Thus, although the LDOS patterns split for both SDW and OS, OS is distinguishable in several ways.
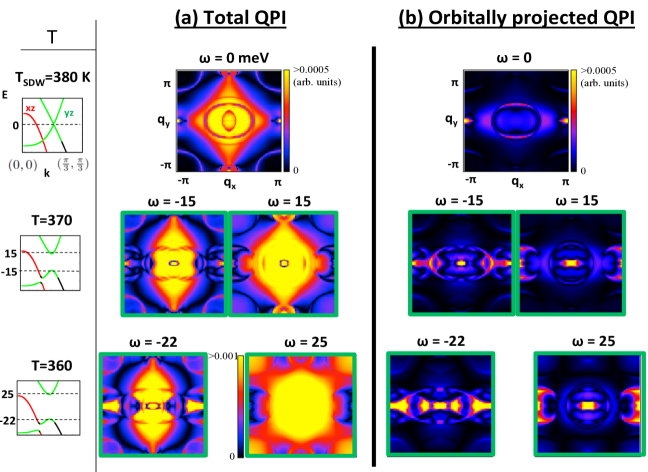
In QPI, these SDW signatures are again obscured by other orbitals, supporting the idea that BE signatures are easier to see in the LDOS rather than QPI. The LDOS patterns are not obscured by other orbital contributions that are concentrated near the impurity. Conversely, in Fig. 8(a), the full QPI at the same energies and temperatures as the LDOS’s in Fig. 7 do not show SDW signatures. Only when projecting out orbitals other than (Fig. 8(b)) are the two patterns at meV ( meV) similar, with features encircling and . Unlike OS, all four patterns bear some similarity without rotation. Again, this is understood by considering the CEC: Since both BE are of content, they scatter to the same portions of the CEC, resulting in patterns similar without rotation.
III.3 OS-SDW cooperation
Detecting and measuring OS magnitudes in the LDOS may be used to understand whether OS is driven by SDW order. OS and the SDW appear to cooperate, since they both decrease in magnitude with doping. Furthermore, theoretical studies have shown that OS enhances the magnetic moment. Lv and Phillips (2011) Our results also indicate that OS and SDW enhance each other, and there are LDOS features of BE splitting that can be attributed to this interdependence.
The emergence of SDW order in an orbitally split state increases the OS magnitude,Yi et al. (2011, 2012) which is observable in STS. We model again OS+SDW by with meV at K (vs. K), like the OS determined experimentally at . Yi et al. (2011) We find that the SDW increases the OS magnitude from 60 meV to 83 meV, observable in LDOS as an increase in the splitting between the BE patterns.
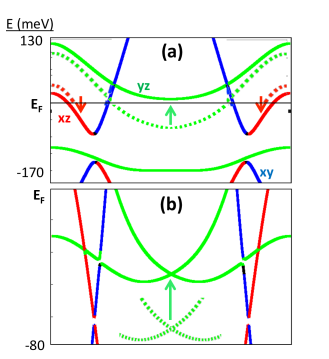
This OS enhancement is understood by considering the bands; it is an example of a more general cooperation with an SDW. Fig. 9(a) compares the bands for OS only to those of OS+SDW. It shows that the SDW moves the bands with () content near to higher (lower) energies, leading to an increase of the OS magnitude observed in the STS patterns. This occurs because the SDW involves bands of similar orbitals that repel each other (Sec. II). This OS enhancement occurs throughout the BZ since the SDW-induced repulsion moves bands with () content across (arrows in Fig. 9(a)), decreasing (increasing) its occupation. This is verified by an increase in the orbital polarization per site, , from 0.12 to 0.16.
On the other hand, OS also enhances the SDW: As highlighted by the arrow in Fig. 9(b), adding OS to the state with no mean fields () shifts a band crossing in the MBZ closer to . This improves the Fermi surface nesting and thereby SDW. Lv and Phillips (2011); Yi et al. (2012) The zero-temperature magnetic moment increases from 0.43 for SDW only to 0.68 for OS+SDW with meV. In summary, there is two-way cooperation between OS and SDW throughout the BZ, as exemplified by the increased OS magnitude in the STS splitting. This leaves the question whether OS not only cooperates but is even driven by the SDW, which LDOS signatures of OS may address.
IV Summary and Experimental Realization
In this work, we theoretically propose new experiments to identify features of each of OS and SDW and to clarify their interplay. Our theory employs a realistic five-orbital model with a self-consistently determined mean-field SDW. As temperature is decreased, two BE features in the LDOS are observed to shift away from each other, tracking OS or the SDW gap. These features are easier to detect in the LDOS than in QPI, where they are obscured by contributions from other orbitals. For OS, the features approximately map onto each other under rotation, whereas SDW features are similar without rotation. The energy difference between BE identified by STS patterns is the OS magnitude. This addresses OS dependence on magnetism because a small OS at the zone center would support spin fluctuations or allow SDW gaps as the cause. Conversely, an OS magnitude that exceeds gap magnitudes cannot be solely caused by SDW gaps. Also, observing OS above would address OS dependence on orthorhombicity. Finally, considering SDW and OS together, we obtained their magneto-orbital cooperation as the SDW onset increases OS.
These results suggest further steps to discover OS signatures in experiments. Unlike ARPES, STS can access energies above , which may allow one to probe OS at the BZ center. The model presented here employs a large OS for demonstration, but the existence and magnitude of OS in zone center bands above remains yet to be seen. If that OS is much smaller than at the zone boundary, this may support nematic spin fluctuations as the mechanism, Daghofer et al. (2012); Daghofer and Fischer (2012); Fernandes et al. (2012) consistent with - or -wave superconductivity. Kuroki et al. (2008); Mazin et al. (2008); Parish et al. (2008); Seo et al. (2008); Chen et al. (2009b); Wang et al. (2009) Conversely, if the OS is not momentum dependent, that would support the ferroorbital ordering mechanism, consistent with -wave superconductivity. Kontani and Onari (2010); Yanagi et al. (2010b)
To experimentally search for OS in conductance measurements, the following steps seem appropriate. A search within 100 mV above is promising because there is not much interference from other bands. The signatures are easier to distinguish from background in a temperature sweep (Fig. 4). Since the OS is the main change in the bands for , this temperature range is most suitable to avoid interfering effects. OS would appear as two 90 rotated patterns at nearby voltages that split with decreasing temperature. Further analysis may include an autocorrelation analysis and a subtraction between STS patterns at the same voltage for two nearby temperatures. Note that our model does not account for STS resolution issues and tunneling matrix elements. However, since the proposed signatures are qualitative, they may be observable.
We have analyzed BE splitting in the iron pnictides, but the concept of LDOS and QPI tracking a BE energy can naturally be applied to other materials of interest. Convenient materials would have fewer low energy bands to obscure the BE shifting, and BE at high symmetry points would present the clearest signatures. The advantage is that many experimental techniques, including STS, still lack systematic means of identifying orbital degrees of freedom. Therefore, our suggestion of observing OS in STS without the need for orbital resolution may be broadly applicable to transition metal oxide systems with partially filled orbitals.
Acknowledgements.
We would like to acknowledge helpful discussions with C. Arguello, C.-C. Chen, M. Claassen, R. Fernandes, J. Kang, B. Moritz, E. Nowadnick, A. Pasupathy, E. Rosenthal, M. Sentef, R. Thomale, and M. Yi. We acknowledge support from the U. S. Department of Energy, Office of Basic Energy Science, Division of Materials Science and Engineering, under Contract No. DE-AC02-76SF00515. S. G. and A. P. K. acknowledge support by the DFG through TRR 80.References
- Bednorz and Müller (1986) J. G. Bednorz and K. A. Müller, Z. Phys. B 64, 189 (1986).
- Kamihara et al. (2008) Y. Kamihara, T. Watanabe, M. Hirano, and H. Hosono, J. Am. Chem. Soc. 130, 3296 (2008).
- de la Cruz et al. (2008) C. de la Cruz, Q. Huang, J. W. Lynn, J. Li, W. Ratcliff, J. L. Zarestky, H. a. Mook, G. F. Chen, J. L. Luo, N. L. Wang, and P. Dai, Nature (London) 453, 899 (2008).
- Si and Abrahams (2008) Q. Si and E. Abrahams, Phys. Rev. Lett. 101, 076401 (2008).
- Fang et al. (2008) C. Fang, H. Yao, W.-F. Tsai, J. Hu, and S. A. Kivelson, Phys. Rev. B 77, 224509 (2008).
- Yildirim (2008) T. Yildirim, Phys. Rev. Lett. 101, 057010 (2008).
- Krüger et al. (2009) F. Krüger, S. Kumar, J. Zaanen, and J. van den Brink, Phys. Rev. B 79, 054504 (2009).
- Chen et al. (2010) C.-C. Chen, J. Maciejko, A. P. Sorini, B. Moritz, R. R. P. Singh, and T. P. Devereaux, Phys. Rev. B 82, 100504(R) (2010).
- Fernandes et al. (2012) R. M. Fernandes, A. V. Chubukov, J. Knolle, I. Eremin, and J. Schmalian, Phys. Rev. B 85, 024534 (2012).
- Kemper et al. (2009) A. F. Kemper, C. Cao, P. J. Hirschfeld, and H.-P. Cheng, Phys. Rev. B 80, 104511 (2009).
- Chuang et al. (2010) T.-M. Chuang, M. P. Allan, J. Lee, Y. Xie, N. Ni, S. L. Bud’ko, G. S. Boebinger, P. C. Canfield, and J. C. Davis, Science 327, 181 (2010).
- Hoffman (2011) J. E. Hoffman, Rep. Prog. Phys. 74, 124513 (2011).
- Yi et al. (2011) M. Yi, D. Lu, J.-H. Chu, J. G. Analytis, A. P. Sorini, A. F. Kemper, B. Moritz, S.-K. Mo, R. G. Moore, M. Hashimoto, L. W-S, Z. Hussain, T. P. Devereaux, I. R. Fisher, and Z.-X. Shen, Proc. Nat. Acad. Sci. USA 108, 6878 (2011).
- Kasahara et al. (2012) S. Kasahara, H. J. Shi, K. Hashimoto, S. Tonegawa, Y. Mizukami, T. Shibauchi, K. Sugimoto, T. Fukuda, T. Terashima, A. H. Nevidomskyy, and Y. Matsuda, Nature (London) 486, 382 (2012).
- Chu et al. (2010) J.-H. Chu, J. G. Analytis, K. De Greve, P. L. McMahon, Z. Islam, Y. Yamamoto, and I. R. Fisher, Science (New York, N.Y.) 329, 824 (2010).
- He et al. (2010) C. He, Y. Zhang, B. P. Xie, X. F. Wang, L. X. Yang, B. Zhou, F. Chen, M. Arita, K. Shimada, H. Namatame, M. Taniguchi, X. H. Chen, J. P. Hu, and D. L. Feng, Phys. Rev. Lett. 105, 117002 (2010).
- Tanatar et al. (2010) M. A. Tanatar, E. C. Blomberg, A. Kreyssig, M. G. Kim, N. Ni, A. Thaler, S. L. Bud’ko, P. C. Canfield, A. I. Goldman, I. I. Mazin, and R. Prozorov, Phys. Rev. B 81, 184508 (2010).
- Dusza et al. (2011) A. Dusza, A. Lucarelli, F. Pfuner, J.-H. Chu, I. R. Fisher, and L. Degiorgi, Europhys. Lett. 93, 37002 (2011).
- Harriger et al. (2011) L. W. Harriger, H. Q. Luo, M. S. Liu, C. Frost, J. P. Hu, M. R. Norman, and P. Dai, Phys. Rev. B 84, 054544 (2011).
- (20) Y. K. Kim, W. S. Jung, G. R. Han, K. Y. Choi, K. H. Kim, C.-C. Chen, T. P. Devereaux, A. Chainani, J. Miyawaki, Y. Takata, Y. Tanaka, M. Ouara, S. Shin, A. P. Singh, J.-Y. Kim, and C. Kim, arXiv:1112.2243 (unpublished) .
- Kuo et al. (2011) H.-H. Kuo, J.-H. Chu, S. C. Riggs, L. Yu, P. L. McMahon, K. De Greve, Y. Yamamoto, J. G. Analytis, and I. R. Fisher, Phys. Rev. B 84, 054540 (2011).
- Song et al. (2011) C.-L. Song, Y.-L. Wang, P. Cheng, Y.-P. Jiang, W. Li, T. Zhang, Z. Li, K. He, L. Wang, J.-F. Jia, H.-H. Hung, C. Wu, X. Ma, X. Chen, and Q.-K. Xue, Science 332, 1410 (2011).
- Arham et al. (2012) H. Z. Arham, C. R. Hunt, W. K. Park, J. Gillett, S. D. Das, S. E. Sebastian, Z. J. Xu, J. S. Wen, Z. W. Lin, Q. Li, G. Gu, A. Thaler, S. Ran, S. L. Bud’ko, P. C. Canfield, D. Y. Chung, M. G. Kanatzidis, and L. H. Greene, Phys. Rev. B 85, 214515 (2012).
- Dusza et al. (2012) A. Dusza, A. Lucarelli, A. Sanna, S. Massidda, J.-H. Chu, I. R. Fisher, and L. Degiorgi, New. J. Phys. 14, 023020 (2012).
- Jesche et al. (2012) A. Jesche, F. Nitsche, S. Probst, T. Doert, P. Müller, and M. Ruck, Phys. Rev. B 86, 134511 (2012).
- Yi et al. (2012) M. Yi, D. H. Lu, R. G. Moore, K. Kihou, C.-H. Lee, A. Iyo, H. Eisaki, T. Yoshida, A. Fujimori, and Z.-X. Shen, New. J. Phys. 14, 073019 (2012).
- Zhang et al. (2012) Y. Zhang, C. He, Z. R. Ye, J. Jiang, F. Chen, M. Xu, Q. Q. Ge, B. P. Xie, J. Wei, M. Aeschlimann, X. Y. Cui, M. Shi, J. P. Hu, and D. L. Feng, Phys. Rev. B 85, 085121 (2012).
- Xu et al. (2008) C. Xu, M. Müller, and S. Sachdev, Phys. Rev. B 78, 020501(R) (2008).
- Haule et al. (2008) K. Haule, J. H. Shim, and G. Kotliar, Phys. Rev. Lett. 100, 226402 (2008).
- Mazin and Johannes (2008) I. I. Mazin and M. D. Johannes, Nat. Phys. 5, 141 (2008).
- Yin et al. (2008) Z. P. Yin, S. Lebègue, M. J. Han, B. P. Neal, S. Y. Savrasov, and W. E. Pickett, Phys. Rev. Lett. 101, 047001 (2008).
- Han et al. (2009) M. J. Han, Q. Yin, W. E. Pickett, and S. Y. Savrasov, Phys. Rev. Lett. 102, 107003 (2009).
- Wysocki et al. (2011) A. L. Wysocki, K. D. Belashchenko, and V. P. Antropov, Nat. Phys. 7, 485 (2011).
- Stanek et al. (2011) D. Stanek, O. P. Sushkov, and G. S. Uhrig, Phys. Rev. B 84, 064505 (2011).
- Kamiya et al. (2011) Y. Kamiya, N. Kawashima, and C. D. Batista, Phys. Rev. B 84, 214429 (2011).
- Daghofer et al. (2012) M. Daghofer, A. Nicholson, and A. Moreo, Phys. Rev. B 85, 184515 (2012).
- Daghofer and Fischer (2012) M. Daghofer and A. Fischer, Supercond. Sci. Technol. 25, 084003 (2012).
- (38) R. R. P. Singh, arXiv:0903.4408 (unpublished) .
- Chen et al. (2009a) C.-C. Chen, B. Moritz, J. van den Brink, T. P. Devereaux, and R. R. P. Singh, Phys. Rev. B 80, 180418(R) (2009a).
- Lv et al. (2009) W. Lv, J. Wu, and P. Phillips, Phys. Rev. B 80, 224506 (2009).
- Lee et al. (2009) C.-C. Lee, W.-G. Yin, and W. Ku, Phys. Rev. Lett. 103, 267001 (2009).
- Kubo and Thalmeier (2009) K. Kubo and P. Thalmeier, J. Phys. Soc. Jpn. 78, 083704 (2009).
- Lv et al. (2010) W. Lv, F. Krüger, and P. Phillips, Phys. Rev. B 82, 045125 (2010).
- Bascones et al. (2010) E. Bascones, M. J. Calderón, and B. Valenzuela, Phys. Rev. Lett. 104, 227201 (2010).
- Yanagi et al. (2010a) Y. Yanagi, Y. Yamakawa, N. Adachi, and Y. Ono, J. Phys. Soc. Jpn. 79, 123707 (2010a).
- Kontani et al. (2011) H. Kontani, T. Saito, and S. Onari, Phys. Rev. B 84, 024528 (2011).
- Lv and Phillips (2011) W. Lv and P. Phillips, Phys. Rev. B 84, 174512 (2011).
- (48) A. H. Nevidomskyy, arXiv:1104.1747 (unpublished) .
- Applegate et al. (2012) R. Applegate, R. R. P. Singh, C.-C. Chen, and T. P. Devereaux, Phys. Rev. B 85, 054411 (2012).
- Cvetkovic and Tesanovic (2009) V. Cvetkovic and Z. Tesanovic, Europhys. Lett. 85, 37002 (2009).
- Knolle et al. (2010a) J. Knolle, I. Eremin, A. V. Chubukov, and R. Moessner, Phys. Rev. B 81, 140506(R) (2010a).
- Brydon and Timm (2009) P. M. R. Brydon and C. Timm, Phys. Rev. B 79, 180504(R) (2009).
- Zhai et al. (2009) H. Zhai, F. Wang, and D.-H. Lee, Phys. Rev. B 80, 064517 (2009).
- Kontani and Onari (2010) H. Kontani and S. Onari, Phys. Rev. Lett. 104, 157001 (2010).
- Yanagi et al. (2010b) Y. Yanagi, Y. Yamakawa, and Y. Ono, Phys. Rev. B 81, 054518 (2010b).
- Kuroki et al. (2008) K. Kuroki, S. Onari, R. Arita, H. Usui, Y. Tanaka, H. Kontani, and H. Aoki, Phys. Rev. Lett. 101, 087004 (2008).
- Mazin et al. (2008) I. I. Mazin, D. J. Singh, M. D. Johannes, and M. H. Du, Phys. Rev. Lett. 101, 057003 (2008).
- Parish et al. (2008) M. M. Parish, J. Hu, and B. A. Bernevig, Phys. Rev. B 78, 144514 (2008).
- Seo et al. (2008) K. Seo, B. A. Bernevig, and J. Hu, Phys. Rev. Lett. 101, 206404 (2008).
- Chen et al. (2009b) W.-Q. Chen, K.-Y. Yang, Y. Zhou, and F.-C. Zhang, Phys. Rev. Lett. 102, 047006 (2009b).
- Wang et al. (2009) F. Wang, H. Zhai, Y. Ran, A. Vishwanath, and D.-H. Lee, Phys. Rev. Lett. 102, 047005 (2009).
- Zhou et al. (2011) X. Zhou, C. Ye, P. Cai, X. Wang, X. Chen, and Y. Wang, Phys. Rev. Lett. 106, 087001 (2011).
- Machida et al. (2012) T. Machida, K. Kogure, T. Kato, H. Nakamura, H. Takeya, T. Mochiku, S. Ooi, Y. Mizuguchi, Y. Takano, K. Hirata, and H. Sakata, J. Phys. Soc. Jpn. 81, 074714 (2012).
- Allan et al. (2013) M. P. Allan, T.-M. Chuang, F. Massee, Y. Xie, N. Ni, S. L. Bud’ko, G. S. Boebinger, Q. Wang, D. S. Dessau, P. C. Canfield, M. S. Golden, and J. C. Davis, Nat. Phys. 9, 220 (2013).
- (65) E. P. Rosenthal, E. F. Andrade, C. J. Arguello, R. M. Fernandes, L. Y. Xing, X. C. Wang, C. Q. Jin, A. J. Millis, and A. N. Pasupathy, arXiv:1307.3526 (unpublished) .
- Knolle et al. (2010b) J. Knolle, I. Eremin, A. Akbari, and R. Moessner, Phys. Rev. Lett. 104, 257001 (2010b).
- Huang et al. (2011) H. Huang, Y. Gao, D. Zhang, and C. S. Ting, Phys. Rev. B 84, 134507 (2011).
- Mazin et al. (2011) I. I. Mazin, S. A. J. Kimber, and D. N. Argyriou, Phys. Rev. B 83, 052501 (2011).
- Inoue et al. (2012) Y. Inoue, Y. Yamakawa, and H. Kontani, Phys. Rev. B 85, 224506 (2012).
- Kang and Tešanović (2012) J. Kang and Z. Tešanović, Phys. Rev. B 85, 220507(R) (2012).
- (71) M. N. Gastiasoro, P. J. Hirschfeld, and B. M. Andersen, arXiv:1307.4913 (unpublished) .
- Graser et al. (2009) S. Graser, T. A. Maier, P. J. Hirschfeld, and D. J. Scalapino, New. J. Phys. 11, 025016 (2009).
- Deng et al. (2009) S. Deng, J. Köhler, and A. Simon, Phys. Rev. B 80, 214508 (2009).
- Kusakabe and Nakanishi (2009) K. Kusakabe and A. Nakanishi, J. Phys. Soc. Jpn. 78, 124712 (2009).
- Oles’ and Stollhoff (1984) A. Oles’ and G. Stollhoff, Phys. Rev. B 29, 314 (1984).
- Saito et al. (2010) T. Saito, S. Onari, and H. Kontani, Phys. Rev. B 82, 144510 (2010).
- Daghofer et al. (2010) M. Daghofer, Q.-L. Luo, R. Yu, D. X. Yao, A. Moreo, and E. Dagotto, Phys. Rev. B 81, 180514 (2010).
- Han and Wang (2009) Q. Han and Z. D. Wang, New. J. Phys. 11, 025022 (2009).
- Balatsky et al. (2006) A. V. Balatsky, I. Vekhter, and J.-X. Zhu, Rev. Mod. Phys. 78, 373 (2006).
- Andersen (2003) B. M. Andersen, Phys. Rev. B 68, 094518 (2003).
- Hirschfeld et al. (1988) P. J. Hirschfeld, P. Wölfle, and D. Einzel, Phys. Rev. B 37, 83 (1988).
- Nakamura et al. (2011) K. Nakamura, R. Arita, and H. Ikeda, Phys. Rev. B 83, 144512 (2011).
- Berlijn et al. (2012) T. Berlijn, C.-H. Lin, W. Garber, and W. Ku, Phys. Rev. Lett. 108, 207003 (2012).
- Vishik et al. (2009) I. M. Vishik, E. A. Nowadnick, W. S. Lee, Z. X. Shen, B. Moritz, T. P. Devereaux, K. Tanaka, T. Sasagawa, and T. Fujii, Nat. Phys. 5, 718 (2009).
- Zhang (2009) D. Zhang, Phys. Rev. Lett. 103, 186402 (2009).
- Hänke et al. (2012) T. Hänke, S. Sykora, R. Schlegel, D. Baumann, L. Harnagea, S. Wurmehl, M. Daghofer, B. Büchner, J. van den Brink, and C. Hess, Phys. Rev. Lett. 108, 127001 (2012).