Molecular Quantum Magnetism in LiZn2Mo3O8
Abstract
Inelastic neutron scattering for temperatures below 30 K from a powder of LiZn2Mo3O8 demonstrates this triangular-lattice antiferromagnet hosts collective magnetic excitations from spin 1/2 Mo3O13 molecules. Apparently gapless ( meV) and extending at least up to 2.5 meV, the low energy magnetic scattering cross section is surprisingly broad in momentum space and involves one third of the spins present above 100 K. The data are compatible with the presence of valence-bonds involving nearest-neighbor and next-nearest-neighbor spins forming a disordered or dynamic state.
pacs:
07.55.Db 75.10.Jm 75.10.Kt 75.10.KtInsulating spin systems have demonstrated their potential to host new states of matter emerging from electronic correlations, quantum fluctuations and entanglement Anderson73 ; Lee08 . They offer a unique and controlled avenue for quantitative comparisons between quantum many-body theory and experimental observations Stone03 ; Lake10 ; Coldea10 . Considerable theoretical efforts are now devoted to understanding the ground-state and excitations of two-dimensional (2D) antiferromagnets where spin interactions are frustrated as for the triangular and Kagome lattices Hao09 ; Balents10 . Neutron scattering investigations of materials with such lattices discovered important features associated with the concept of the quantum spin-liquid Balents10 , such as the absence of static correlations down to very low temperatures deVries09 ; Fak12 and deconfined fractional spin excitations Coldea01 ; Han12 .
To make quantitative comparisons with theory, the sensitivity to defects and site mixing inherent to magnetic transition metal oxides is a significant challenge Freedman10 , particularly for gapless spin liquids. Beyond single-molecule magnets with purely local spin dynamics Baker12 , spin degrees of freedom that are delocalized on stable organic molecules Blundell04 ; Tamura09 ; Pratt11 or inorganic clusters Sheckelton12 , can host collective electronic and magnetic phenomena controlled by interactions between magnetic molecules Blundell04 ; Tamura09 ; Pratt11 ; Masuda08 ; Canevet10 ; Yamaguchi13 . Contrasting in the range and nature of interaction and disorder, different collective properties might be possible in such materials.
In this letter, we investigate the spin dynamics of LiZn2Mo3O8, an insulating compound where spin 1/2 carrying Mo3O13 clusters form a triangular lattice with dominant antiferromagnetic interactions Sheckelton12 . Our inelastic neutron scattering data from powder specimens of LiZn2Mo3O8 provide evidence for collective molecular magnetism. We observe a low-temperature spectrum from 0.2 meV to at least 2.5 meV compatible with the presence of valence-bonds entangling nearest- and next-nearest-neighbor Mo3O13 spin clusters and spectral weight corresponding to at most 1/3 of the spins.
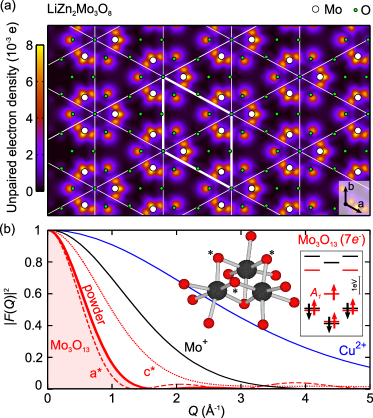
The structure of LiZn2Mo3O8 (resp. Zn2Mo3O8) comprises Mo3O13 clusters organized in the hexagonal plane of the (resp. ) space-group. These planes are stacked along and separated by non-magnetic Zn and Li ions (resp. Zn) with six (resp. two) layers per unit-cell Torardi85 ; Sheckelton12 . The Mo3O13 units maintain point-symmetry down to at least 12 K with an internal Mo–Mo distance Å, and a greater distance Å between Mo atoms of adjacent clusters Sheckelton12 . This results in an effective triangular lattice of Mo3O13 units, Fig. 1(a), with nearest-neighbor distance Å between molecular centers. There are seven valence electrons (7) per cluster in LiZn2Mo3O8 and six (6) in Zn2Mo3O8.
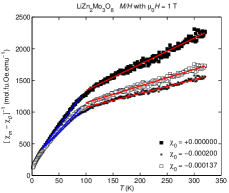
Electronic structure calculations for Mo3O13(7) Sheckelton12 find a single unpaired electron delocalized in a non-degenerate molecular orbital. With the point-group symmetry of Mo3O13, the wave-function is primarily concentrated on molybdenum with substantial weight on three oxygen atoms (marked in Fig. 1(b)). This leads to a donut-shaped electron density of mean radius Å [Fig. 1(a)]. The large gap to higher-energy molecular levels suggests Mo3O13(7) carries spin [Fig. 1(b)]. These theoretical predictions are corroborated by electron spin resonance (ESR) Sheckelton13 and high-temperature susceptibility Torardi85 ; Sheckelton12 measurements on powder-samples of LiZn2Mo3O8 that are respectively described by an isotropic gyromagnetic tensor (with upper bounds on anisotropy 0.8 to 1.2) and a matching effective moment Suppl , obtained by subtracting emu.mol-1.Oe-1 from the data of Ref. Sheckelton12 . In contrast, the very small and temperature-independent susceptibility of Zn2Mo3O8 Abe09 ; Sheckelton12 suggests that Mo3O13(6) is non-magnetic.
Antiferromagnetic interactions between Mo3O13(7e) spins in LiZn2Mo3O8 are indicated by a large negative Weiss constant K Suppl for temperatures K. These may be primarily ascribed to super-exchange between adjacent clusters via short Mo–O–Mo (angles and ) paths. Below K, the susceptibility enters another effective Curie-Weiss regime with K and . This corresponds to an apparent loss of 71(4)% () of the spins and was interpreted in Ref. Sheckelton12 as a result of valence bond condensation. Despite a large , specific-heat shows no evidence for a transition to magnetic long-range order down to K but an upturn in the magnetic part of from K to 0.1 K Sheckelton12 , consistent with a gapless magnetic excitation spectrum.
To probe the corresponding magnetic excitations we carried-out inelastic neutron scattering experiments using the MACS spectrometer Rodriguez08 at the NIST Center for Neutron Research and the ARCS spectrometer Abernathy12 at the ORNL Spallation Neutron Source. Powder samples of 7LiZn2Mo3O8 ( g) and Zn2Mo3O8 ( g) were held in Al cans and cooled to K and K, respectively. The low energy regime () was explored on MACS using fixed final neutron energies meV, 3.7 meV and 5.0 meV and appropriate combinations of cooled Be and BeO filters before and after the sample to suppress higher-order contamination. Higher energies () were studied on ARCS configured with a fixed incident energy meV and a chopper frequency of 600 Hz. The corresponding Full Width at Half Maximum (FWHM) energy resolutions were 0.10 meV, 0.18 meV, 0.21 meV and 6.6 meV. Contributions from the empty cryostat were subtracted and the measured intensity was normalized to Bragg scattering from the sample Xu13 .
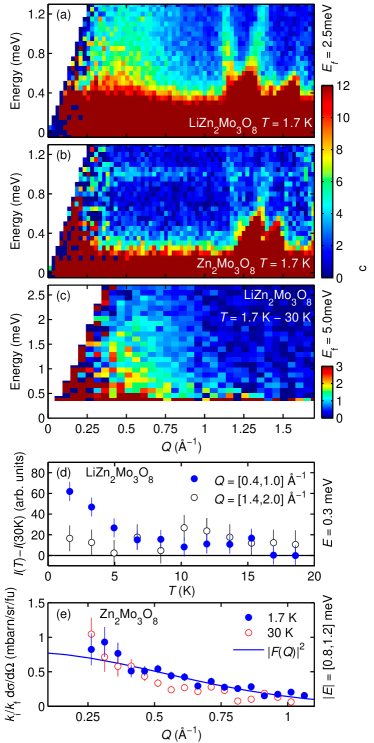
We start with the low energy experiment for which the cross-section is plotted in Fig. 2(a,b) as function of neutron energy-transfer and momentum-transfer . Besides elastic nuclear scattering, there is for LiZn2Mo3O8 a broad plume of scattering extending from the elastic line up to the highest measured meV, concentrated at small Å-1, and with a temperature-dependent characteristic wave-vector [Fig. 2(a)]. There is no such signal for Zn2Mo3O8 in the same -range but instead, a weak flat mode at meV the intensity of which decreases with and vanishes by Å-1 [Fig. 2(b)]. For larger Å-1, both samples display V-like ridges of intensity emerging from nuclear Bragg reflections. This spurious signal is temperature independent and results from incoherent elastic scattering from the monochromator or analyzer and a nuclear Bragg reflection from the sample.
Our observations can be compared to the cross-section for inelastic magnetic neutron scattering associated with Mo3O13 spins, . Here is the dynamical spin correlation function, the spherically averaged form-factor for unpaired electrons in the sample and cm. Within the dipole approximation Lovesey84 and assuming a quenched orbital contribution for Mo3O13(7), we obtain the spin-only from-factor from the unpaired electron density of Fig. 1(a).
The spherically averaged squared amplitude decreases with increasing and drops to 10% of its initial value by Å-1 [Fig. 1(b)]. This resembles the trend observed experimentally for small in Fig. 2(a,b), suggesting that both the broad signal in LiZn2Mo3O8 and the flat excitation in Zn2Mo3O8 have a magnetic origin. For LiZn2Mo3O8 this is reinforced by the temperature evolution of the signal, determined by subtracting K data from lower temperature measurements. Upon cooling to K, the intensity increases for Å-1 and from the elastic line up to at least meV [Fig. 2(c)]. A more detailed temperature dependence focusing on meV reveals a substantial decrease of the Å-1 signal from K to K while the Å-1 is -independent [Fig. 2(d)].
In contrast, the signal observed in Zn2Mo3O8 [Fig. 2(b)] consists of a weak resonant mode with integrated intensity that follows remarkably well, particularly for Å-1 [Fig. 2(e)]. This flat mode carries a temperature independent spectral weight corresponding to % of that observed in LiZn2Mo3O8 [Fig. 2(a)] or about 3% of that expected from one per Mo3O13 cluster. We associate this scattering with a local intra-molecular excitation of Mo3O13() that validates the general trend of our ab-initio predictions for the form-factor [Fig. 1(b)].
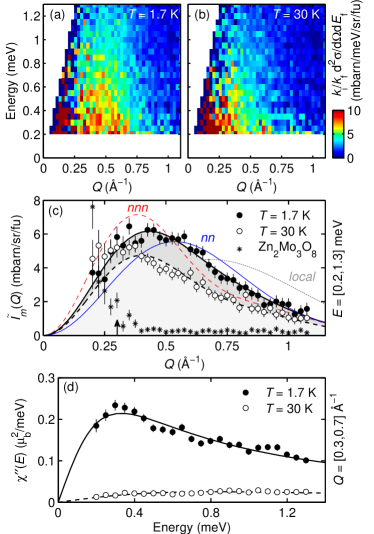
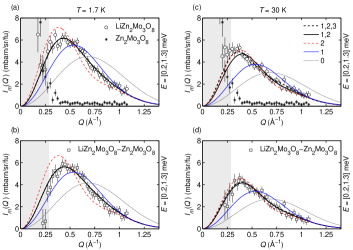
For a more quantitative understanding, we isolated the inelastic magnetic scattering contribution, , by subtracting the sample elastic nuclear scattering. Specifically, the elastic incoherent lineshape observed in Zn2Mo3O8 for meV and Å-1 was scaled to the intensity of LiZn2Mo3O8 and subtracted [Fig. 3(a,b)].
The momentum dependence of the resulting intensity, , was extracted by integrating over meV. A peak is observed for Å-1 at K which shifts to a lower Å-1 upon warming to K [Fig. 3(c)]. This indicates the signal is a collective excitation of the Mo3O13(7e) spins rather than a local intra-molecular excitation. The latter would peak at a much higher , see the dotted line in Fig. 3(c), and be temperature independent.
We modeled using the powder-averaged equal-time structure factor of a valence bond, with the distance between antiferromagnetically interacting spins. Fits to the data in the range Å-1 with variable (not shown) yield an effective Å at K indicating temperature-dependent correlations that are longer-ranged than the nearest-neighbor spacing of Å. Fixing to (blue solid line) or to the next-nearest-neighbor distance Å (red dashed line) does not yield a satisfactory fit to the K data [Fig. 3(c)]. A much better fit is obtained by allowing the superposition of valence bonds for several near neighbors where with the squared moment per formula unit entangled in a valence-bond . Fits to this model, shown in Fig. 3(c) for K (solid bold line) and K (dashed bold line), yield ( of ) and () at 1.7 K, and () and () at 30 K. These results are independent of the background subtraction within error bars Suppl . Including a third neighbor distance does not significantly improve the fits and strongly depends on the background subtraction. While limited to low energy, our findings are consistent with the superposition of valence-bonds involving first and second nearest-neighbors at 1.7 K. The structure factor shifts to lower upon warming to 30 K, a phenomenology also observed in the Kagome quantum spin liquid Kapellasite Fak12 .
The energy dependence of the signal was analyzed through the imaginary part of the dynamical susceptibility . The momentum-integrated susceptibility is shown in Fig. 3(d) for meV. There is no discernible gap or resonance and the data are well described by a relaxation response with relaxation-rate meV at 1.7 K and meV at 30 K. The temperature dependence of and its similarity in magnitude to meV again point to a collective phenomenon.
The inelastic spectral weight per formula-unit can be directly compared to derived from bulk susceptibility data for K and associated with of the spins. Accounting for the intensity on the neutron energy gain side and integrating over the range meV and Å-1 yields at 1.7 K and at 30 K. This agrees well with obtained above and yields (and thus only ). The shortfall is attributed to the limited range of -integration. To overcome this, we modeled the dynamic structure factor as where with a high-energy cutoff and a dimensionless prefactor to ensure normalization . With the parameters from the best fits, the reconstructed spectral weight extrapolates to for a cutoff energy meV, indicating that a maximum of 1/3 of the spins participate in this low-energy signal.
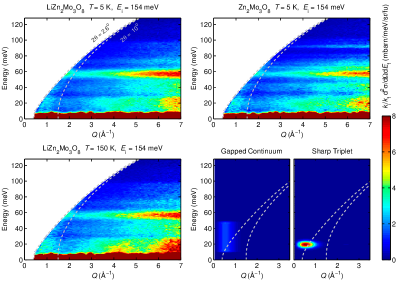
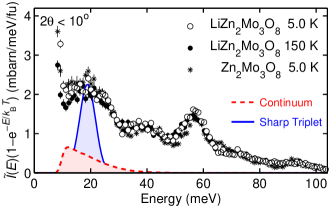
Searching for higher energy spectral weight, Fig. 4 presents the energy dependence of the neutron scattering intensity meV) at low scattering angles (). The scattering is dominated by broad features centered around 20 meV, 42 meV and 57 meV that are common to LiZn2Mo3O8 and Zn2Mo3O8. With an intensity that increases with Suppl and varies with in accordance with the Bose factor, they are associated with acoustic and optical phonons. Their large density-of-states at low-energies hints them to Mo3O13 clusters, thus confirming the stability of these molecular units. In contrast, no magnetic signal is apparent.
Using an average exchange interaction meV, we modeled the energy dependence of for a singlet to triplet transition with distance and integrated spectral-weight in two cases: a resolution-limited transition at and a gapped continuum with and bandwidth [Fig. 4]. While the sharp excitation, if present, would be clearly visible at low scattering angles, the continuum mostly develops out of the kinematic range of our experiment Suppl with a very weak accessible intensity, representing a fraction of the phonon contribution. While we cannot exclude a sharp excitation with meV, the analysis suggests the missing spectral weight may as well hide in a weak – meV continuum obscured by phonon scattering.
The magnetism of LiZn2Mo3O8 differs radically from that of the spin-1/2 triangular lattice Heisenberg antiferromagnet, which has long-range spin order Huse88 ; Jolicoeur89 . Along with previously published thermo-magnetic data Sheckelton12 , our neutron scattering data indicate a quantum fluctuating low temperature state with low-energy excitations carrying at most a third of the spectral weight expected from the high-temperature effective moment. The low-energy spin correlations are compatible with valence-bonds involving first and second nearest neighbor Mo3O13 clusters. The apparently gapless spectrum indicates disorder or longer-range valence bonds than directly detectable here. Correspondingly, the absence of detectable sharp excitation at higher energies is consistent with a disordered valence bond solid or a resonating valence bond state.
Potentially relevant deviations from the Heisenberg model that may explain these results include exchange anisotropies, longer-range interactions, multi-spin exchange, and magneto-elasticity. Recently, a mechanism based on the cooperative rotation of Mo3O13 clusters resulting in an emergent honeycomb lattice has been proposed for LiZn2Mo3O8 Flint13 . Another interesting direction is Schwinger boson mean-field theory Messio11 . It may be possible to distinguish between these scenarios through lower inelastic data or by examining the magnetic field dependence of the present data.
We thank R. Flint, P. A. Lee, O. Tchernyshyov and Y. Wan for discussion and Y. Qiu for assistance with the MACS experiment and data treatment. The work at IQM was supported by the US Department of Energy, office of Basic Energy Sciences, Division of Material Sciences and Engineering under grant DE-FG02-08ER46544. This work utilized facilities supported in part by the National Science Foundation under Agreement No. DMR-0944772. Research at Oak Ridge National Laboratory’s Spallation Neutron Source is sponsored by the US Department of Energy, office of Basic Energy Sciences, Scientific User Facilities Division.
References
- (1) P. W. Anderson, Mater. Res. Bull. 8, 153-160 (1973).
- (2) P. A. Lee, Reports on Progress in Physics 71, 012501 (2008).
- (3) M. B. Stone, D. H. Reich, C. Broholm, K. Lefmann, C. Rischel, C. P. Landee, and M. M. Turnbull, Phys. Rev. Lett. , 91, 037205 (2003).
- (4) B. Lake, A. M. Tsvelik, S. Notbohm, D. A. Tennant, T. G. Perring, M. Reehuis, C. Sekar, G. Krabbes, and B. Büchner, Nature Physics 6, 50-55 (2010).
- (5) R. Coldea, D. A. Tennant, E. M. Wheeler, E. Wawrzynska, D. Prabhakaran, M. Telling, K. Habicht, P. Smeibidl, and K. Kiefer, Science 327, 177-180 (2010).
- (6) Z. Hao and O. Tchernyshyov, Phys. Rev. Lett. 103, 187203 (2009).
- (7) L. Balents, Nature (London), 464, 199 (2010)
- (8) M. A. de Vries, J. R. Stewart, P. P. Deen, J. O. Piatek, G. J. Nilsen, H. M. Rønnow, and A. Harrison, Phys. Rev. Lett. 103, 237201 (2009).
- (9) B. Fåk, E. Kermarrec, L. Messio, B. Bernu, C. Lhuillier, F. Bert, P. Mendels, B. Koteswararao, F. Bouquet, J. Ollivier, A. D. Hillier, A. Amato, R. H. Colman, and A. S. Wills, Phys. Rev. Lett. 109, 037208 (2012).
- (10) R. Coldea, D. A. Tennant, A. M. Tsvelik, and Z. Tylczynski, Phys. Rev. Lett. 86, 1335 (2011).
- (11) T.-H. Han, J. S. Helton, S. Chu, D. G. Nocera, J. A. Rodriguez-Rivera, C. Broholm, and Y. S. Lee, Nature (London) 492, 406-410 (2012).
- (12) D. E. Freedman, T. H. Han, A. Prodi, P. Mueller, Q.-Z. Huang, Y.-S. Chen, S. M. Webb, Y. S. Lee, T. M. McQueen, and D. G. Nocera, J. Am. Chem. Soc. 132, 16185-90 (2010).
- (13) M. L. Baker, T. Guidi, S. Carretta, J. Ollivier, H. Mutka, H. U. Güdel, G. A. Timco, E. J. L. McInnes, G. Amoretti, R. E. P. Winpenny, and P. Santini, Nature Physics 8, 906-911 (2012).
- (14) M. Tamura and R. Kato, Sci. Technol. Adv. Mater. 10 024304 (2009).
- (15) F. L. Pratt, P. J. Baker, S. J. Blundell, T. Lancaster, S. Ohira-Kawamura, C. Baines, Y. Shimizu, K. Kanoda, I. Watanabe, and G. Saito, Nature (London) 471, 612 (2011).
- (16) S. J. Blundell, and F. L. Pratt, J. Phys.: Condens. Matter 16, R771-R828 (2004).
- (17) J. P. Sheckelton, J. R. Neilson, D. G. Soltan, and T. M. McQueen, Nature Mater. 11, 493–496 (2012).
- (18) T. Masuda, S. Takamizawa, K. Hirota, M. Ohba, and S. Kitagawa, J. Phys. Soc. Jpn. 77, 083703 (2008).
- (19) E. Canévet, B. Grenier, Y. Yoshida, N. Sakai, L.-P. Regnault, T. Goto, Y. Fujii, and T. Kawae, Phys. Rev. B 82, 132404 (2010).
- (20) H. Yamaguchi, A. Toho, K. Iwase, T. Ono, T. Kawakami, T. Shimokawa, A. Matsuo and Y. Hosokoshi, J. Phys. Soc. Jpn. 82, 043713 (2013).
- (21) C. C. Torardi, and R. E. McCarley, Inorg. Chem. 24, 476–481 (1985).
- (22) J. P. Sheckelton, F. R. Foronda, LiDong Pan, C. Moir, R. D. McDonald, T. Lancaster, P. J. Baker, N. P. Armitage, T. Imai, S. J. Blundell, and T. M. McQueen, arXiv:1312.0955 (2013).
- (23) See Supplemental Material for details of the Curie-Weiss analysis, valence-bond fits and meV neutron scattering spectra.
- (24) H. Abe, A. Sato, N. Tsujii, T. Furubayashi, and M. Shimoda, J. Sol. St. Chem. 183, 379-384 (2010).
- (25) J. A. Rodriguez et al., Meas. Sci. Technol. 19, 034023 (2008).
- (26) D. L. Abernathy et al., Review of Scientific Instruments 83, 15114 (2012).
- (27) G. Xu, Z. Xu, and J. M. Tranquada, arXiv:1305.5521 (2013).
- (28) S. W. Lovesey, Theory of Neutron Scattering from Condensed Matter (Claredon Press, Oxford, 1984).
- (29) D. A. Huse and V. Elser, Phys. Rev. Lett. 60, 2531-2534 (1988).
- (30) Th. Jolicoeur and J. C. Le Guillou, Phys. Rev. B 40, 2727-2729 (1989).
- (31) R. Flint and P. A. Lee, Phys. Rev. Lett. 111, 217201 (2013).
- (32) L. Messio, C. Lhuillier, and G. Misguich, Phys. Rev. B 83, 184401 (2011); Phys. Rev. B 87, 125127 (2013).
Supplementary online material for “Molecular Quantum Magnetism in LiZn2Mo3O8”
1. Curie-Weiss analysis of the bulk susceptibility
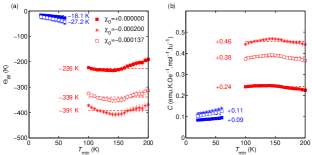
In Ref. Sheckelton12 , diamagnetic contributions () to the susceptibility of LiZn2Mo3O8 were determined using an equimolar amount of the non-magnetic sample Zn2Mo3O8 mounted on the same sample holder. This approach has the advantage of being independent of the data analysis procedure, but has limitations related to the stability of the instrumentation. In this work we determine by fitting the data of Ref. 16 for temperatures between and 330 K with K. The fit yields (emu/mol fu Oe) in excellent agreement with the empirical estimate (emu/mol fu Oe). The errorbar represents the standard deviation of over the range of . The inverse susceptibility of LiZn2Mo3O8 corrected for is presented in Fig. S1 along with representative non-linear least-squares fits of the two distinct K and K Curie-Weiss regimes. In Fig. S2, the fit results are presented versus fitting range and . Statistically averaged values over the range of are summarized in Tab. S1 along with comparison to predictions for spins with (free electron), (obtained by ESR in Ref. 22) or (obtained in Ref. 16) and or spins per formula-unit. The results are , for and , for .
| (a) | (b) | |||||||||
|---|---|---|---|---|---|---|---|---|---|---|
| -0.00000(0) | K | -226(15) | 0.24(1) | 1.96(6) | 1.40(4) | K | -18(7) | 0.09(1) | 0.70(3) | 0.84(3) |
| -0.00137(45) | K | -339(12) | 0.38(1) | 3.08(6) | 1.76(3) | K | -27(6) | 0.11(1) | 0.88(6) | 0.94(6) |
| -0.00200(0) | K | -391(12) | 0.46(1) | 3.68(6) | 1.91(4) | K | -32(7) | 0.12(1) | 0.97(7) | 0.99(7) |
| – | 0.24 | 1.92 | 1.39 | – | 0.08 | 0.64 | 0.80 | |||
| – | 0.33 | 2.70 | 1.64 | – | 0.11 | 0.90 | 0.95 | |||
| – | 0.37 | 3.00 | 1.73 | – | 0.12 | 1.00 | 1.00 |
| Valence Bonds | |||||||||
|---|---|---|---|---|---|---|---|---|---|
| (a) raw | 1.7 K | + + | 0.63 | 0.10(1) | 0.08(1) | 0.00(2) | – | – | |
| + | 0.61 | 0.10(1) | 0.08(1) | – | – | – | |||
| 4.07 | – | 0.16(3) | – | – | – | ||||
| 3.76 | 0.19(3) | – | – | – | – | ||||
| 21.74 | – | – | – | 0.47(1) | – | ||||
| Å | 1.11 | – | – | – | – | 0.17(1) | |||
| (c) sub | 1.7 K | + + | 0.58 | 0.11(1) | 0.07(1) | 0.00(0) | – | – | |
| + | 0.54 | 0.11(1) | 0.07(1) | – | – | – | |||
| 3.57 | – | 0.15(3) | – | – | – | ||||
| 2.23 | 0.18(3) | – | – | – | – | ||||
| 15.64 | – | – | – | 0.44(1) | – | ||||
| Å | 1.41 | – | – | – | – | 0.12(1) | |||
| (b) raw | 30 K | + + | 0.64 | 0.04(1) | 0.00(0) | 0.09(1) | – | – | |
| + | 0.96 | 0.03(1) | 0.09(1) | – | – | – | |||
| 1.41 | – | 0.12(2) | – | – | – | ||||
| 5.84 | 0.13(0) | – | – | – | – | ||||
| 18.31 | – | – | – | 0.32(1) | – | ||||
| Å | 1.11 | – | – | – | – | 0.17(1) | |||
| (d) sub | 30 K | + + | 0.50 | 0.04(1) | 0.05(3) | 0.03(3) | – | – | |
| + | 0.50 | 0.03(1) | 0.08(1) | – | – | – | |||
| 0.92 | – | 0.11(2) | – | – | – | ||||
| 3.15 | 0.12(0) | – | – | – | – | ||||
| 11.59 | – | – | – | 0.28(1) | – | ||||
| Å | 1.11 | – | – | – | – | 0.10(1) |
2. Valence-bond fits
Details of valence-bond fits to are shown in Fig. S3 with the cut-off Å-1 indicated by the gray area. The raw LiZn2Mo3O8 data [Fig. S3(a,c)] is plotted along with an empirical background obtained for Zn2Mo3O8 in the range meV. Background subtracted data [Fig. S3(b,d)] are not shown in the main text because the background is obtained on a different and limited energy range compared to the signal. Fit results are plotted using the same convention as in the main text and results summarized in Tab. S2 using fixed distances , , , and free .
3. High-energy neutron scattering spectra