Glycolaldehyde formation via the
dimerisation of the formyl radical
Abstract
Glycolaldehyde, the simplest monosaccharide sugar, has recently been detected in low- and high-mass star-forming cores. Following on from our previous investigation into glycolaldehyde formation (Woods et al., 2012), we now consider a further mechanism for the formation of glycolaldehyde that involves the dimerisation of the formyl radical, HCO. Quantum mechanical investigation of the HCO dimerisation process upon an ice surface is predicted to be barrierless and therefore fast. In an astrophysical context, we show that this mechanism can be very efficient in star-forming cores. It is limited by the availability of the formyl radical, but models suggest that only very small amounts of CO are required to be converted to HCO to meet the observational constraints.
Subject headings:
astrochemistry — circumstellar matter — ISM: abundances — ISM: clouds — ISM: molecules — stars: formation1. Introduction
The complex organic molecule (COM) glycolaldehyde, CH2OHCHO, has been a subject of special interest among astrochemists in the last few years. It has a number of useful qualities, including:
-
i.
glycolaldehyde is distributed on compact spatial scales in star-forming regions, centred on protostellar cores, making it a tracer of early star formation;
-
ii.
it is linked to prebiotic chemistry, being involved in the formation of the complex sugar, ribose;
-
iii.
understanding the chemistry of glycolaldehyde and its relationship to its two isomers methyl formate (HCOOCH3) and acetic (ethanoic) acid (CH3COOH) gives an insight into the physical and chemical conditions of the star-forming core, e.g., estimates of the abundance ratio between these isomers in Sagittarius B2(N) indicate that the structural configuration C–O–C belonging to methyl formate is preferred in this environment over the C–C–O arrangement of glycolaldehyde and acetic acid (see Mehringer et al., 1997; Millar et al., 1988). Additionally, the spatial distribution of acetic acid is coincident with other complex species which form on grain surfaces, indicating that acetic acid is also the product of a grain surface chemistry (Mehringer et al., 1997) rather than a gas-phase one (as suggested by Huntress & Mitchell, 1979, for example).
Glycolaldehyde has been detected towards the high-mass molecular core G31.41+0.31 (catalog ) (Beltrán et al., 2009) and the low-mass binary protostellar system IRAS 16293-2422 (catalog ) (Jørgensen et al., 2012) on arcsecond spatial scales. This equates to 80 AU in the case of IRAS 16293-2422 (catalog ): Solar System sizes. Its first detection in space was towards the Galactic Centre cloud Sagittarius B2(N) (Hollis et al., 2000), where its distribution was widespread, in contrast to the condensed emission regions towards the young stellar objects.
Such COMs are becoming increasingly commonly detected. In addition to COMs detected in warm or hot cores such as G31.41+0.31 (catalog ), COMs are being detected in cold, prestellar cores (e.g., Bacmann et al., 2012; Cernicharo et al., 2012, and references therein). In hot cores, it is postulated that COMs are formed in the prestellar phase at temperatures of 10 K, and subsequently are evaporated into the gas phase as the forming protostar warms its surroundings (Charnley et al., 1992). It is not clear at this stage to what extent COMs form in the intermediate warm-phase (20–50 K), where the temperatures potentially provide energy for (large) grain-bound species to traverse the grain surface and react before the products thermally desorb into the gas phase (e.g., Garrod & Herbst, 2006). For large radicals, H atoms, which are mobile on grain surfaces at low temperatures, are the dominant reaction partner. However, recent experimental work (Fuchs et al., 2009) indicates that hydrogenation (applied in this case to the hydrogenation of CO ices) has a limited temperature window in which it is effective: above 15 K, the end stage of hydrogenation (in this case CH3OH) is underproduced, probably due to the fact that at these warmer temperatures H atoms desorb from surfaces more readily. H2 also desorbs at these temperatures, and since H atoms stick to H2 better than they do to CO ice, hydrogenation is inhibited. At temperatures less than 10 K, H atom migration is slow. At 3 K, hydrogenation is suppressed due to the condensation of H2, meaning that no saturated products are seen (Pirim et al., 2010). Thus this window of 3–15 K, which is available in collapsing prestellar cores, but is less available in warming protostellar cores, could potentially be crucial to the formation of complex organic species such as glycolaldehyde.
Our understanding of the chemistry of glycolaldehyde is developing. Several authors have suggested possible formation routes under astrophysical conditions in the literature, and a summary is given in Woods et al. (2012). In that paper we discussed which of those formation mechanisms are feasible in terms of reaction rates and the availability of reactants. We focused on the isothermal collapse of a massive molecular core, similar to that of G31.41+0.31. Using the UCL_CHEM chemical model (Viti et al., 2004) we probed the efficiency of five different mechanisms of glycolaldehyde synthesis found in the astrophysical literature, considering a large parameter space. Of these five mechanisms (labelled A–E), only two grain-surface routes looked plausible under the conditions we tested:
| (1) | |||||
| (2) |
Our focus in this paper is a possible pathway to glycolaldehyde formation not previously considered in the literature, and we study this method using quantum chemical techniques and astrochemical modelling with the UCL_CHEM code. The proposed pathway involves the dimerisation of the formyl radical, HCO, followed by hydrogenation:
| (3) | |||||
| (4) | |||||
| (5) |
We consider these reactions both in the gas phase and on the surface of dust grains. From a reaction chemistry approach, this mechanism looks promising: two reactive radicals combine to form an intermediate, which is then hydrogenated to form glycolaldehyde. HCO is known to exist in the gas phase in cold cores (Cernicharo et al., 2012) and photon-dominated regions (Gerin et al., 2009), for example, and is also known to exist as an intermediate in the grain surface formation of COMs, e.g., methanol (Tielens & Hagen, 1982; Woon, 2002). Hydrogenation of adsorbed species is thought to be efficient (e.g., Watanabe et al., 2003), and thus this reaction scheme is viable. We place these reactions into an astrophysical context to understand their significance in glycolaldehyde formation. We have considered both the cis- and trans- conformers of HOCCOH, and find that the cis- conformer (leading to cis-glycolaldehyde) is most energetically favourable in the solid phase. Henceforth, we only consider cis-glycolaldehyde, which is the conformer that has been detected in the interstellar medium.
2. Calculations
| Reaction | Ice-surface barrier | Gas-phase barrier | ||
|---|---|---|---|---|
| (kJ mol-1) | (K) | (kJ mol-1) | (K) | |
| 2HCO HOCCOH | 0.00 | 0 | 0.00 | 0 |
| HOCCOH + H CH2OCHO | 9.18 | 1 108 | 10.87 | 1 312 |
| CH2OCHO + H CH2OHCHO | 0.00 | 0 | 0.00 | 0 |
In this work we have used a combination of periodic and aperiodic Density Functional Theory (DFT) approaches to explore the influence of a proto-dust grain on the mechanism of glycolaldehyde formation. A 3D periodic slab was used to model the ice surface, onto which reactants are adsorbed. It has been assumed that most of the interstellar ice that coats an ISM dust grain takes the form of amorphous solid water (ASW; Gibb et al., 2000). Modelling such a high degree of local disorder would require a large unit cell, making hybrid functional DFT calculations prohibitively expensive. Therefore, as a first-order approximation, to probe the influence of the substrate chemistry, we employ a two bilayer crystalline slab containing 96 water molecules, with a 35 Å vacuum gap. The crystalline ice phase used, Ih, exhibits orientational disorder in the hydrogen positions. Within the constraints of the lattice, each tetrahedrally coordinated water molecule can have one of six different positions, but must obey the Bernal-Fowler-Pauling ice rules, which require that each oxygen atom has two nearest neighbour hydrogen atoms to form a water molecule, and there must be exactly one hydrogen atom on a hydrogen bond joining two nearest neighbour oxygen atoms. Rick and Haymet’s “move” algorithm (Rick & Haymet, 2003) was used to generate disordered configurations without violating the ice rules. It has been demonstrated that proton disorder on the ice surface has a much larger effect on surface energy than on the bulk cohesive energy (see Pan et al., 2010). Here, we selected an approximately random surface ordering (an order parameter of 3.3, using the notation of Pan et al.) to provide a variety of adsorption sites (see Watkins, VandeVondele & Slater, 2010; Watkins et al., 2011).
The Quickstep module of the CP2K suite (VandeVondele et al., 2005) was used for all surface calculations since the recently implemented Auxillary Density Matrix Method (ADMM; Guidon et al., 2010) allows hybrid DFT calculations to be completed on a similar timescale to Generalised Gradient Approximation (GGA) calculations. Andersson & Grüning (2004) showed that for astrochemical reactions, hybrid functionals are often essential to describe barriers reasonably well. We opted to use the BHandHLYP hybrid density functional together with Goedecker-Teter-Hutter (GTH) pseudopotentials and double-zeta (DZVP) basis sets, a 400 Ry plane wave cutoff and the DFT-D3 (Grimme et al., 2010) dispersion correction with a cutoff of 10 Å. The BHandHLYP functional performs significantly better than, for example, B3LYP, for calculating reaction heats and barriers where one of the reactants is a hydrogen atom (Andersson & Grüning, 2004). It consistently and significantly (but not catastrophically, like B3LYP) underestimates barriers for the gas phase reactions; however, since we are interested in changes in the barriers, and in the absence of more finely tuned functionals such as M05-2x, it is a reasonable choice. Convergence tolerances were set to a minimum energy change of 10-6 Ha for electronic steps, and a maximum displacement of 10-3 Bohr and a maximum force of 510-5 Ha/Bohr for ionic steps. The cpFIT3 auxiliary basis set was used for the ADMM, with a Coulomb truncation radius of 5 Å.
The focus of our calculations in this paper can be seen in Table 1, which shows our new pathway for the formation of glycolaldehyde. Two of the three reactions of interest in the mechanism are barrierless in the gas phase and they are also found to be barrierless on the surface. Only the reaction HOCCOH + H CH2OCHO has a substantial barrier and we find a very modest reduction in the barrier height of 1.7 kJ mol-1 (200 K) when the reaction is carried out on the substrate. Reverse barriers for the reactions have also been calculated, and all are sufficiently larger than the forward reaction barrier (all reverse barriers are 100 kJ mol-1 (12 000 K) in height), suggesting that the reverse reaction is unlikely.
Since only one step in the reaction pathway discussed here has a substantial barrier, we consider the nature of the barrier and factors which could influence the predicted barrier. Before addition of H to HOCCOH can occur, two HCO molecules must combine. We calculated the migration barrier for self-diffusion of HCO on the ice surface, by rastering the molecule over the surface (using a fixed distance constraint and incrementally moving the HCO radical by 0.1Å along the -axis of the slab) and found that migration across the surface encounters barriers of 2 kJ mol-1 (240 K), according to the DFT model used. This barrier is sufficiently small that it will be overcome under the low temperature conditions considered here. The BHandHLYP estimate of the reaction barrier height of the gas phase is around a third of the CCSD(T) estimate, hence the barrier height on the surface is likely to be underestimated. However, we only considered a small sample of adsorption sites on the ice surface and it is likely that more favourable adsorption sites exist in porous ASW, which would reduce the barrier (i.e., a stronger adsorption of HOCCOH on the ice would activate the site on the carbon atom for an attack by H). The absolute rate of reaction is expected to be dominated by tunnelling and indeed the crossover temperature is estimated to be 172 K (Gillan et al., 1987), confirming that tunnelling will account for the apparent rate. A recent study of H addition to polycyclic aromatic hydrocarbons showed that rate coefficients are dramatically enhanced by tunnelling and indeed tunnelling becomes the dominant mechanism at ISM temperatures (Goumans, 2011a). Previous studies indicate that the quantum tunnelling rate can be 105 faster than the classical rate at the temperature range relevant here and for reactions with similar barrier heights. In Andersson, Goumans & Arnaldsson (2011), bimolecular addition of H to CO has a barrier of 12 kJ mol-1 (1440 K, in close agreement with our value for H addition to a C centre) which was found to yield a quantum tunnelling rate dominated value of 710-17 cm3 s-1. This rate informs our sensitivity study in the following section.
We also note that reaction 3 in our mechanism, HCO + HCO HOCCOH, will compete with the hydrogenation of HCO on grain surfaces to form H2CO. This hydrogenation reaction is also barrierless, and co-incidentally forms a part of another route towards the formation of glycolaldehyde which we discussed previously (mechanism D, Woods et al., 2012), and which is adopted by other authors (e.g., Garrod & Herbst, 2006; Garrod et al., 2008). We will show in a future paper that both these pathways for the reaction of HCO (via dimerisation or via formaldehyde and hydroxymethyl intermediates) could potentially lead to glycolaldehyde. For the remainder of this paper, however, we turn our attention back to the dimerisation of HCO.
3. Chemical modelling
In order to understand the effectiveness of this pathway to glycolaldehyde formation, we simulate an astrophysical environment with a chemical model. We use the UCL_CHEM chemical model in much the same way as in Woods et al. (2012): we consider the isothermal free-fall collapse of a prestellar core (see Rawlings et al., 1992) from a diffuse medium until a density appropriate for a star-forming core is reached: 107 cm-3 for a high-mass core; 108 cm-3 for a low-mass core. These densities are typical for the molecular regions near the centre of pre-/proto-stellar cores. The process of the isothermal collapse of the core we call Phase i. As the collapse progresses in our model, gas-phase molecules are accreted onto the surface of dust grains, where they may undergo hydrogenation or reactions which may lead to the formation of glycolaldehyde only (reactions 3–5). Imposing this constraint means that we take a conservative approach in terms of method, and a generous approach in terms of the formation of glycolaldehyde. Since we consider only the most favourable formation of glycolaldehyde, we derive an upper limit to abundance estimates for this particular route of formation. Within this model, CO is hydrogenated to CH3OH via intermediates HCO and H2CO, C hydrogenated to CH4, N hydrogenated to NH3 and O hydrogenated to H2O, etc. Thus adsorbed HCO, which is important for our formation mechanism, can be formed either through the hydrogenation of adsorbed CO or through the freeze-out of gas-phase HCO.
Following the collapse, there is a “warm-up” phase, which we call Phase ii, where the collapse ceases and grain mantles are evaporated as the protostar warms its surroundings. No grain-surface reactions occur in the model in this phase, due to the large uncertainties in the treatment of the process.
3.1. A note on reaction rate coefficients
We have investigated whether glycolaldehyde production via the mechanism described in reactions 3–5 is efficient and significant. Reaction rates for the latter two reactions have not been measured to our knowledge; however, rates for the reaction of HCO with itself have been quantified experimentally in the gas phase (e.g., Friedrichs et al., 2002; Yee Quee & Thynne, 1968, see Table 2). Three branches have been identified:
and measured reaction rate coefficients can be found in Table 2.
In the modelling of reaction 3, 2HCO HOCCOH, we adopt a reaction rate coefficient of 2.810-13 cm3 s-1, as measured in the gas phase by Yee Quee & Thynne (1968), for both gas-phase and solid-phase reactions. This has little physical significance as a surface reaction rate, but we use the numerical value as an equivalent. We have estimated the diffusion barrier to be 240 K, which is reasonably overcome at 10 K, since the molecules are physisorbed 3Å above the surface.
The rate coefficients for the remaining two reactions, 4 and 5, have not been measured to our knowledge. In the gas phase, these reactions are presumably slow associations, and would more readily occur as protonation reactions. Comparison with similar reactions in the UMIST and KIDA databases show that reaction rate coefficients are vanishingly small at 10 K, and most lead to two products, one of which is H2 (i.e., abstraction dominates over addition). Given that rate coefficients for these reactions are 10-11 cm3 s-1, and we expect H-addition to be a minor channel, we adopt gas-phase rate coefficients of 110-14 cm3 s-1 for reactions 4 and 5. The choice of gas-phase rate coefficient for this reaction is not crucial to the results of the model.
In the solid phase, as previously mentioned, Andersson, Goumans & Arnaldsson (2011) calculated a rate coefficient of 710-17 cm3 s-1 for H + CO at 20 K, including a tunnelling correction. This reaction has a classical barrier of 1 500–1 850 K. Similarly, Goumans (2011b) calculated a rate coefficient of 10-21 cm3 s-1 for H + H2CO at 20 K (with a barrier of 2 318 K). Since HOCCOH and OCH2CHO are approximately twice as massive as H2CO we can crudely expect an increase in the rate of hydrogen addition, and we consider the range of rate coefficients from 10-16 to 10-21 cm3 s-1 reasonable for these reactions. To maintain consistency we assume that on grain surfaces these two hydrogenation reactions proceed at the same rate as the other grain surface hydrogenation reactions previously mentioned. For these two reactions, this rate coefficient is on the order of 10-19 cm3 s-1, which falls neatly within the acceptable range.
Reaction 4 is retarded by a factor , where is the energy barrier for the reaction, in Kelvin. As mentioned above, reaction 4 is subject to an activation energy barrier of at least 1 312 K in the gas phase, and 1 108 K on a water ice surface. Tunnelling of H atoms may be possible through both these barriers, as discussed in Section 2 and above. In our modelling we experiment with different values for the energy barriers, but maintain the reaction rate coefficient mentioned above.
| Reaction | Rate coef. (cm3 s-1) | Source | Reference |
|---|---|---|---|
| 2HCO CO + H2CO | 7.510-11 | NIST | Baggott et al. (1986) |
| 6.310-11 | NIST | Reilly et al. (1978) | |
| 5.010-11 | KIDA | undisclosed, probably Baulch et al. (1992) | |
| 4.510-11 | KIDA | Friedrichs et al. (2002) | |
| 3.410-11 | NIST | Veyret, Roussel & Lesclaux (1984) | |
| 3.010-11 | UDFA | probably Sarkisov et al (1984) | |
| 2HCO HOCCOH111Reported in the original paper as (CHO)2. | 5.010-11 | NIST | Stoeckel et al. (1985, unconfirmed)† |
| 2.810-13 | – | Yee Quee & Thynne (1968) | |
| 2HCO 2CO + H2 | 3.610-11 | KIDA | Yee Quee & Thynne (1968) |
Note. — Sources: NIST (http://kinetics.nist.gov); UDFA (http://udfa.net); KIDA (http://kida.obs.u-bordeaux1.fr). †Stoeckel et al. (1985) give this gas-phase rate coefficient in relation to the recombination of the HCO radical, but the reaction products are not stated.
| # | Gas-phase | Grain-surface | CO HCO | Non-thermal | (CH2OHCHO) | (CH2OHCHO) | ||
|---|---|---|---|---|---|---|---|---|
| barrier (K) | barrier (K) | (%) | (yr) | desorption | Phase i | Phase ii | ||
| 1 | 1 312 | 1 108 | … | 0.10 | n.c. | … | negligible | 6.010-18 |
| 2 | 1 312 | … | … | 0.10 | n.c. | … | 2.410-12 | 2.410-12 |
| 3 | 656 | … | … | 0.10 | n.c. | … | 2.410-12 | 2.410-12 |
| 4 | 1 312 | … | 25 | 0.10 | n.c. | … | 7.910 | 7.910 |
| 5 | 1 312 | … | 25 | 0.10 | 107 | … | 1.310 | 1.310 |
| 6 | 1 312 | … | 25 | 0.10 | n.c. | H2 formation | 1.110 | 1.110 |
| 7 | 1 312 | … | 25 | 0.10 | n.c. | all | 1.110 | 1.110 |
| 8 | 1 312 | … | 25 | 0.20 | n.c. | … | 7.410 | 7.410 |
| 9 | 1 312 | … | 25 | 0.05 | n.c. | … | 4.510 | 4.510 |
Note. — Reaction energy barriers refer to reaction 4. In this table, n.c. indicates ‘no constraint’ upon . Typically this means that the collapse reaches in 5106 yr. for all models is 107 cm-3. The conversion between CO and HCO happens via grain-surface hydrogenation upon freeze-out (column 4; see text.) Glycolaldehyde abundances are given in the solid phase for Phase i and gas phase for Phase ii.
3.2. Modelling a high-mass (25 M⊙) core
G31.41+0.31 (catalog ) contains a high-mass hot core with an approximate mass of 25 M⊙ (Osorio et al., 2009). Observational estimates of glycolaldehyde fractional abundance give (CH2OHCHO)10-8±2 (Beltrán, priv. comm., based on Beltrán et al., 2009). We therefore use this as a benchmark by which to judge whether the chemical pathways we test are sufficiently productive in context. We have explored a number of parameters through chemical models, all of which are detailed in Table 3.
3.2.1 The efficiency of gas-phase routes to glycolaldehyde formation in hot cores
Initially we tested whether there was sufficient HCO formed in the gas phase to make reactions 3–5 an efficient pathway to the production of glycolaldehyde (see models 1–3 in Table 3). To this end, we disabled the grain-surface formation of HCO from CO, so that the only pathway for glycolaldehyde formation was through reactions 3–5 using gas-phase HCO, both in the gas phase and the solid phase via freeze-out. This resulted in no formation of glycolaldehyde after Phase i, and only traces of glycolaldehyde after Phase ii. We repeated this test, but without an energy barrier in the grain-surface hydrogenation of HOCCOH (reaction 4; i.e., simulating the tunnelling of the adsorbed H atom through the energy barrier). This resulted in the formation of small amounts of glycolaldehyde, (CH2OHCHO)210-12 (model 2). Reducing the gas-phase barrier had a negligible effect on the abundance of glycolaldehyde (model 3). From model 1 we see that a very small amount of glycolaldehyde is formed in Phase ii; this essentially tells us about the efficiency of the gas-phase formation route for glycolaldehyde. Using the adopted rate coefficients for reactions 4 and 5, (CH2OHCHO) = 10-18 is formed, an amount that is insignificant compared to grain-surface formation mechanisms which occur during Phase i. There is a dependence on the values of these rate coefficients: for instance, increasing the rate coefficients for these two hydrogenations from 10-14 to 10-10 cm3 s-1 (which is an exceptionally large value for such a gas-phase reaction at 10 K) results only in a fractional abundance of (CH2OHCHO)10-10. Since this is at the very lower limit of our observational range, we may conclude, as in Woods et al. (2012), that a gas-phase production method of glycolaldehyde is unlikely.
3.2.2 The efficiency of grain-surface routes to glycolaldehyde formation in hot cores
Given the lack of HCO in the gas phase, we investigated a grain-surface formation route for glycolaldehyde in more detail. Adopting a conversion efficiency of 25% for the production of HCO from freezing-out CO222The remainder becomes CH3OH (5%), H2CO (10%) or stays unhydrogenated, as CO (60%), and again presuming that reaction 4 is barrierless due to the tunnelling of H, we considered several more models (models 4–9 in Table 3). With a standard collapse time of 5 Myr, we attain a fractional abundance of glycolaldehyde of 810-6 (model 4), several orders of magnitude larger than with no grain-surface hydrogenation of CO to HCO (model 2). This final abundance is also sufficient to meet our observationally-constrained criterion for the abundance of glycolaldehyde in G31.41+0.31.
Glycolaldehyde is increased significantly in abundance if we allow the collapsed core (with a representative density of 107 cm-3) to persist for another 5 Myr without further collapse. In this case, the abundance of glycolaldehyde reaches 1.310-5 (model 5), an increase of a factor of 2 when the collapse timescale is doubled. Since observationally it is not easy to pinpoint “=0”, collapse timescales cannot be accurately assessed. From our modelling, we see that the longer the chemistry is allowed to evolve in Phase i, the more beneficial it is for the development of complex chemistry.
Models 6 and 7 test the impact of non-thermal desorption mechanisms on the development. The mechanisms themselves are described in Viti et al. (2004) and Roberts et al. (2007). They have the effect of slightly increasing the abundance of glycolaldehyde, since they remove CO from the grain surfaces, which can then re-accrete to generate more adsorbed HCO.
Finally, we adjusted the sticking coefficient (the ‘fr’ parameter of Viti et al., 2004), but for all reasonable values of this variable (fr = 0.05–0.2, where our standard value was fr = 0.10), the final fractional abundance of glycolaldehyde did not vary beyond the range 4.5–7.410-6.
3.2.3 The impact of barrier size in grain-surface routes to glycolaldehyde formation
Using model 4 as a basis, we investigated whether it was the size of the reaction barrier or the amount of CO converted to HCO on freezeout that affected the final abundance of glycolaldehyde, in models 4.1–4.9. Results of these models are shown in Table 4.
| # | Grain-surface | CO hydrogenation | (CH2OHCHO) | (CH2OHCHO) |
|---|---|---|---|---|
| barrier (K) | (%) | Phase i | Phase ii | |
| (4) | … | 60% CO, 25% HCO, 10% H2CO, 5% CH3OH | 7.910 | 7.910 |
| 4.1 | 1 108 | 60% CO, 25% HCO, 10% H2CO, 5% CH3OH | negligible | 2.010-14 |
| 4.2 | 554 | 60% CO, 25% HCO, 10% H2CO, 5% CH3OH | negligible | 2.010-14 |
| 4.3 | 277 | 60% CO, 25% HCO, 10% H2CO, 5% CH3OH | 1.410-17 | 2.010-14 |
| 4.4 | 139 | 60% CO, 25% HCO, 10% H2CO, 5% CH3OH | 1.510-11 | 1.510-11 |
| 4.5 | 70 | 60% CO, 25% HCO, 10% H2CO, 5% CH3OH | 1.310 | 1.310 |
| 4.6 | … | 60% CO, 10% HCO, 20% H2CO, 10% CH3OH | 2.910-6 | 2.910-6 |
| 4.7 | … | 60% CO, 5% HCO, 22.5% H2CO, 12.5% CH3OH | 1.310-6 | 1.310-6 |
| 4.8 | … | 60% CO, 1% HCO, 24.5% H2CO, 14.5% CH3OH | 1.510-7 | 1.510-7 |
| 4.9 | … | 60% CO, 0.1% HCO, 25% H2CO, 14.9% CH3OH | 2.910-9 | 2.910-9 |
Note. — Reaction energy barriers refer to reaction 4. The conversion between CO and HCO happens via grain-surface hydrogenation upon freeze-out (column 3; see text.) Glycolaldehyde abundances are given in the solid phase for Phase i and gas phase for Phase ii.
From models 4.1–4.5 we see that the barrier height in reaction 4 has a significant effect, with only small amounts of glycolaldehyde being formed if the barrier is significantly larger than 150 K. Once the energy barrier drops below 100 K, observational estimates of glycolaldehyde in G31.41+0.41 (catalog ) are met, with a 25% conversion from CO to HCO.
3.2.4 The impact of CO HCO conversion in grain-surface routes to glycolaldehyde formation
Given that the reaction energy barrier in reaction 4 is reduced sufficiently by H-atom tunnelling, the amount of CO converted to HCO following freeze-out becomes important. If this conversion is very efficient (25%, model 4), the glycolaldehyde fractional abundance can be as large as 810-6. However, even with a low conversion efficiency of 0.1%, enough glycolaldehyde is produced to match our observational constraints (model 4.9 in Table 4).
3.3. Modelling a low-mass (1 M⊙) core
| # | Gas-phase | Grain-surface | CO HCO | (CH2OHCHO) | (CH2OHCHO) | |
|---|---|---|---|---|---|---|
| barrier (K) | barrier (K) | (%) | Phase i | Phase ii | ||
| 10 | 1 312 | 1 108 | … | 0.012 | negligible | 3.210-21 |
| 11 | 1 312 | … | … | 0.012 | 7.210-14 | 7.210-14 |
| 12 | 1 312 | 1 108 | 25 | 0.012 | negligible | 5.410-15 |
| 13 | 1 312 | … | 25 | 0.012 | 1.310 | 1.310 |
| 14 | 1 312 | … | 1 | 0.012 | 4.410 | 4.410 |
| 15 | 1 312 | … | 0.1 | 0.012 | 2.410 | 2.410 |
Note. — Reaction energy barriers refer to reaction 4. for all models is 108 cm-3. The conversion between CO and HCO happens via grain-surface hydrogenation upon freeze-out (column 4; see text.) Glycolaldehyde abundances are given in the solid phase for Phase i and gas phase for Phase ii.
Since glycolaldehyde has recently been detected in the low-mass binary protostellar system, IRAS16293-2422 (catalog ) (Jørgensen et al., 2012), towards both protostars, we have modelled a low-mass core with a nominal mass of 1 M⊙. We use the time-dependent temperature profile of Awad et al. (2010):
| (6) |
(for core age, ) which fits the empirical data of Schöier et al. (2002) well.
Jørgensen et al. (2012) estimate that the fractional abundance of glycolaldehyde towards IRAS16293-2422 (catalog ) is 610-9, which adds a constraint to our modelling. Results of selected models are shown in Table 5. We see a similar result to that in the high-mass case, that with a reduction of the energy barrier in the grain-surface hydrogenation of HOCCOH (via the tunnelling of an H atom, for example), sufficient glycolaldehyde can be formed to match observational estimates for IRAS16293-2422 (catalog ). We stress that the calculated abundances are upper limits, since we do not consider destruction of glycolaldehyde, and neither do we consider alternative reaction channels for HCO, for example.
Models 10 and 12 indicate that a reaction barrier of 1 108 K on the surface is prohibitive for the formation of glycolaldehyde via our suggested mechanism. Removal of this barrier means that glycolaldehyde formation becomes more efficient, although the efficiency is limited by the amount of HCO on grain surfaces. Even a small amount (0.1%) of conversion of CO to HCO via grain-surface hydrogenation is sufficient to meet the observationally-derived estimate for IRAS16293-2422 (catalog ) (model 15). The fact that the final abundance of glycolaldehyde produced in the model is governed by the amount formed in Phase i shows that gas-phase formation of glycolaldehyde is inefficient, even at the higher density of the low-mass core model.
4. Discussion and conclusions
The detection of COMs in recent years, particularly in star-forming regions, gives a hint of the molecular complexity of the local universe that awaits discovery. The standard approaches of chemical modelling or performing laboratory experiments to understand and explain the presence of these COMs are powerful, but more so when combined together. Here we have combined quantum chemical calculations on the energetics of a particular formation route with the modelling of a large network of chemical reactions. From a reaction chemistry perspective, the proposed formation mechanism looks promising, but an investigation into the potentially limiting parameters (e.g., the availability of HCO) is necessary to test its viability.
As in our previous work (Woods et al., 2012), we were able to exclude a gas-phase formation mechanism for glycolaldehyde. Gas-phase formation only becomes effective once the temperature of the core reaches 100 K, and its yield is dependent on the available resources of gas-phase HCO. The gas-phase abundance of HCO towards the end of Phase ii of the model matches the observational determination of HCO abundance in core B1-b (catalog ) well (10-11, Cernicharo et al., 2012). However, at earlier times, when glycolaldehyde is forming, the gas-phase abundance of HCO in the model is very low. The grain-surface pathway proposed in reactions 3–5 produces significant amounts of glycolaldehyde ((CH2OHCHO) 810-6) at lower temperatures, under the conditions of: i) a grain-surface reaction barrier for reaction 4 of less than 100 K and ii) a conversion efficiency of grain-surface CO to HCO greater than 0.1%. Our estimate of the barrier in reaction 4 is 1 108 K, which is likely a lower limit according to CCSD(T) calculations. However, the barrier can be tunnelled through by H atoms, and so effectively it will be significantly lower than our estimate. Unfortunately estimates of the height of the barrier for tunnelling are computationally expensive, and would take an unfeasibly long amount of time to calculate.
The second condition is also likely, since observed ratios of CH3OH:CO can be 1:2 (e.g., Whittet et al., 2011), significantly larger than 0.1%. Since CH3OH is thought to form exclusively through grain-surface hydrogenation of CO in hot cores, the ratio of CH3OH:CO gives us some idea of the ratio of HCO:CO on grain surfaces.
A further effect which may boost the abundance of glycolaldehyde and other COMs is that of time. Longer collapse timescales mean more time available for complex molecule formation.
In conclusion, fractional abundances of glycolaldehyde which match the observed estimates in hot molecular core G31.41+0.31 (catalog ) and low-mass binary protostar IRAS 16293-2422 (catalog ) are attainable through a previously undiscovered formation mechanism which we have investigated and quantified using combined techniques of quantum chemical calculations and chemical modelling. The efficiency of the mechanism relies upon there being a small (100 K) activation energy barrier, including tunnelling considerations, for the reaction HOCCOH + H OCH2CHO and the availability of adsorbed HCO, both of which are to be expected.
This mechanism adds to our understanding of potential formation routes of glycolaldehyde. Our previously-favoured mechanisms for the formation of glycolaldehyde were:
| (1) | |||||
| (2) |
We have added a new potential route,
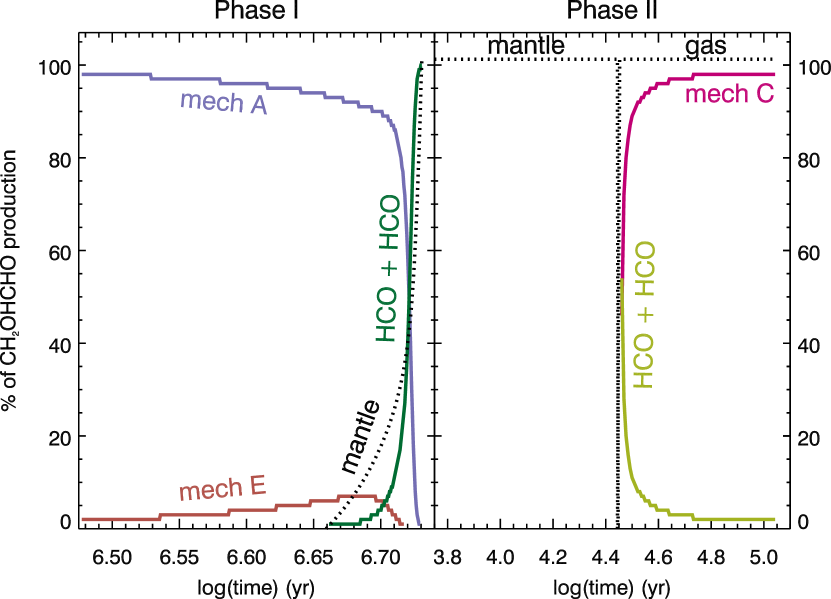
As an illustrative exercise, we have run a model with all six formation pathways for glycolaldehyde in effect: the five mechanisms from Woods et al. (2012), and the dimerisation of HCO. We use the “standard rates” for mechanisms A–E, and the model 4 parameters for the model in general. In Fig. 1 we show which mechanisms dominate the formation of glycolaldehyde. As in Woods et al. (2012), mechanism A dominates at early times in Phase I, when there is little glycolaldehyde formed. The dimerisation mechanism is very effective at late times, and produces the bulk of glycolaldehyde in this case. It replaces mechanism D as most efficient, i.e., HCO + HCO dominates over CH2OH + HCO. HCO is typically 100 times more abundant than CH2OH in the model, with a 25% CO HCO conversion rate. In Phase II, glycolaldehyde is mostly solid until the temperature of the core rises to 100 K. There is no grain-surface chemistry in Phase II of our model, so glycolaldehyde is not formed. Mechanism C is responsible for the majority of production once the ices are desorbed from the grain mantle, but as described above, gas-phase formation of glycolaldehyde only occurs at very low levels, even at warm (100 K) temperatures.
References
- Andersson, Goumans & Arnaldsson (2011) Andersson, S., Goumans, T. P. M., & Arnaldsson, A. 2011, Chem. Phys. Lett., 513, 31
- Andersson & Grüning (2004) Andersson, S., & Grüning, M. 2004, J. Phys. Chem. A, 108, 7621
- Awad et al. (2010) Awad, Z., Viti, S., Collings, M. P., & Williams, D. A. 2010, MNRAS, 407, 2511
- Bacmann et al. (2012) Bacmann, A., Taquet, V., Faure, A., Kahane, C., & Ceccarelli, C. 2012, A&A, 541, L12
- Baggott et al. (1986) Baggott, J. E., Frey, H. M., Lightfoot, P. D., & Walsh, R. 1986, Chem. Phys. Lett., 132, 225
- Baulch et al. (1992) Baulch, D. L., Cobos, C. J., Cox, R. A., et al. 1992, J. Phys. Chem. Ref. Data, 21, 411
- Beltrán et al. (2009) Beltrán, M. T., Codella, C., Viti, S., Neri, R., & Cesaroni, R. 2009, ApJ, 690, L93
- Bennett et al. (2007) Bennett, C. J., Chen, S.-H., Sun, B.-J., Chang, A. H. H., & Kaiser, R. I. 2007, ApJ, 660, 1588
- Blöchl (1995) Blöchl, P. E. 1995, J. Chem. Phys., 103, 7422
- Cernicharo et al. (2012) Cernicharo, J., Marcelino, N., Roueff, E., et al. 2012, ApJ, 759, L43
- Charnley et al. (1992) Charnley, S. B., Tielens, A. G. G. M., & Millar, T. J. 1992, ApJ, 399, L71
- Friedrichs et al. (2002) Friedrichs, G., Herbon, J. T., Davidson, D. F., & Hanson, R. K. 2002, Phys. Chem. Chem. Phys., 4, 5778
- Fuchs et al. (2009) Fuchs, G. W., Cuppen, H. M., Ioppolo, S., et al. 2009, A&A, 505, 629
- Garrod & Herbst (2006) Garrod, R. T., & Herbst, E. 2006, A&A, 457, 927
- Garrod et al. (2008) Garrod, R. T., Weaver, S. L. W., & Herbst, E. 2008, ApJ, 682, 283
- Gerin et al. (2009) Gerin, M., Goicoechea, J. R., Pety, J., & Hily-Blant, P. 2009, A&A, 494, 977
- Gibb et al. (2000) Gibb, E. L., Whittet, D. C. B., Schutte, W. A., et al. 2000, ApJ, 536, 347
- Gillan et al. (1987) Gillan, M. 1987, J. Phys. C: Solid State Phys., 20, 3621
- Goumans (2011a) Goumans, T. P. M. 2011a, MNRAS, 415, 3129
- Goumans (2011b) Goumans, T. P. M. 2011b, MNRAS, 413, 2615
- Goumans et al. (2007) Goumans, T. P. M., Wander, A., Catlow, C. R. A., & Brown, W. A. 2007, MNRAS, 382, 1829
- Grimme et al. (2010) Grimme, S., Antony, J., Ehrlich, S., & Krieg, H. 2010, J. Chem. Phys., 132, 154104
- Guidon et al. (2010) Guidon, M., Hutter, J., & VandeVondele, J. 2010, J. Chem. Theor. Comput., 6, 2348
- Herbst (2005) Herbst, E. 2005, J. Phys. Chem. A, 109, 4017
- Hollis et al. (2000) Hollis, J. M., Lovas, F. J., & Jewell, P. R. 2000, ApJ, 540, L107
- Huntress & Mitchell (1979) Huntress, W. T., Jr., & Mitchell, G. F. 1979, ApJ, 231, 456
- Jørgensen et al. (2012) Jørgensen, J. K., Favre, C., Bisschop, S. E., et al. 2012, ApJ, 757, L4
- Mehringer et al. (1997) Mehringer, D. M., Snyder, L. E., Miao, Y., & Lovas, F. J. 1997, ApJ, 480, L71
- Millar et al. (1988) Millar, T. J., Brown, P. D., Olofsson, H., & Hjalmarson, A. 1988, A&A, 205, L5
- Neese (2012) Neese, F. 2012, WIREs Comput. Mol. Sci., 2, 73
- Osorio et al. (2009) Osorio, M., Anglada, G., Lizano, S., & D’Alessio, P. 2009, ApJ, 694, 29
- Pan et al. (2010) Pan, D., Liu, L. M., Tribello, G. A., Slater, B., Michaelides, A., & Wang, E. 2010, J. Phys. Cond. Mat., 22, 074209
- Pirim et al. (2010) Pirim, C., Krim, L., Laffon, C., Parent, Ph., Pauzat, F., Pilmé, J., & Ellinger, Y. 2010, J. Phys. Chem. A, 114, 3320
- Rawlings et al. (1992) Rawlings, J. M. C., Hartquist, T. W., Menten, K. M., & Williams, D. A. 1992, MNRAS, 255, 471
- Reilly et al. (1978) Reilly, J. P., Clark, J. H., Moore, C. B., & Pimentel, G. C., 1978, J. Chem. Phys., 69, 4381
- Rick & Haymet (2003) Rick, S. W., & Haymet, A. D. J. 2003, J. Chem. Phys., 118, 9291
- Roberts et al. (2007) Roberts, J. F., Rawlings, J. M. C., Viti, S., & Williams, D. A. 2007, MNRAS, 382, 733
- Sarkisov et al (1984) Sarkisov, O. M., Cheskis, S. G., Nadtochenko, V. A., Sviridenkov, E. A., & Vedeneev, V. I., 1984, Arch. Combust., 4, 111
- Schöier et al. (2002) Schöier, F. L., Jørgensen, J. K., van Dishoeck, E. F., & Blake, G. A. 2002, A&A, 390, 1001
- Stoeckel et al. (1985) Stoeckel, F., Schuh, M. D., Goldstein, N., & Atkinson, G. H., 1985, Chem. Phys., 95, 135
- Tielens & Hagen (1982) Tielens, A. G. G. M., & Hagen, W. 1982, A&A, 114, 245
- Tsang & Hampson (1986) Tsang, W., & Hampson, R. F. 1986, J. Phys. Chem. Ref. Data, 15, 1087
- Valiev et al. (2010) Valiev, M., Bylaska, E. J., Govind, N., Kowalski, K., Straatsma, T. P., Van Dam, H. J. J., Wang, D., Nieplocha, J., Apra, E., Windus, T. L., & de Jong, W. A. 2010, Comp. Phys. Comm., 181, 1477
- VandeVondele et al. (2005) Vandevondele, J., Krack, M., Mohamed, F., Parrinello, M., Chassaing, T., & Hutter, J. 2005, Comp. Phys. Comm., 167, 103
- Veyret, Roussel & Lesclaux (1984) Veyret, B., Roussel, P., & Lesclaux, R., 1984, Chem. Phys. Lett., 103, 389
- Viti et al. (2004) Viti, S., Collings, M. P., Dever, J. W., McCoustra, M. R. S., & Williams, D. A. 2004, MNRAS, 354, 1141
- Watanabe et al. (2003) Watanabe, N., Shiraki, T., & Kouchi, A. 2003, ApJ, 588, L121
- Watkins, VandeVondele & Slater (2010) Watkins, M., VandeVondele, J., & Slater, B. 2010, Proc. Natl. Acad. Sci. USA, 1001087107
- Watkins et al. (2011) Watskins, M., Pan, D., Wang, E. G., Michaelides, A., VandeVondele, J., & Slater, B. 2011, Nature Materials, 10, 794
- Whittet et al. (2011) Whittet, D. C. B., Cook, A. M., Herbst, E., Chiar, J. E., & Shenoy, S. S. 2011, ApJ, 742, 28
- Woods et al. (2012) Woods, P. M., Kelly, G., Viti, S., et al. 2012, ApJ, 750, 19
- Woon (2002) Woon, D. E. 2002, ApJ, 569, 541
- Yee Quee & Thynne (1968) Yee Quee, M. J., & Thynne, J. C. J., 1968, Ber. Bunsenges Phy. Chem., 72, 211