Enhancement of the Superconducting Transition Temperature in FeSe Epitaxial Thin Films by Anisotropic Compression
Abstract
In order to investigate the effects of in-plane strain on the superconductivity of FeSe, epitaxial thin films of FeSe were fabricated on CaF2 substrates. The films are compressed along the -axis and their superconducting transition temperatures reach 11.4 K, which is approximately 1.5 times higher than that of bulk crystals. The values are weakly dependent on the ratio of the lattice constants, /, compared to that of Fe(Se,Te). Our results indicate that even a binary system FeSe has room for improvement, and will open a new route for the application of Fe-based superconductors.
The discovery of iron-based materials with a high superconducting transition temperature has attracted much attention for both fundamental studies and practical applications. Kamihara et al. (2008) Iron-chalcogenide superconductors Hsu et al. (2008) (Fe), Fe(Se,Te), have the simplest crystal structure, consisting of only two-dimensional conducting planes. Although the values of these materials are low compared with those of other families, the values are strongly dependent on the applied pressure. In fact, the onset of the resistive transition, , reaches 37 K under a hydrostatic pressure of approximately 4 GPa. Masaki et al. (2009); Medvedev et al. (2009) Therefore, anisotropic pressure effects on of Fe are of great interest.
Studies on the film growth of the optimally doped Fe(Se,Te) have suggested that the in-plane (-plane) compressive strain can increase the value above that of bulk crystals; such studies have also found enhanced superconducting properties. Bellingeri et al. (2010); Iida et al. (2011); Tsukada et al. (2011); Si et al. (2012) Additionally, under a hydrostatic pressure, Horigane et al. (2009) FeSe shows a large increase in compared to optimally doped Fe(Se,Te). Thus, we expect FeSe thin films to have values higher than those of bulk single crystals when in-plane compressive strain is successfully introduced in the films. Recently, high superconductivity was reported in single-unit-cell-thick FeSe films on SrTiO3 substrates. Qing-Yan et al. (2012) Although it is unclear whether this phenomenon is characteristic of the interface, this report provides another example showing that FeSe has potential as a very high superconductor. Thus, a very important question is whether we can realize this high superconductivity as a bulk nature. Additionally, from this viewpoint, we should investigate the effects of anisotropic strain in FeSe films.
Several groups have reported the growth of FeSe films using oxide substrates. Han et al. (2009); Nie et al. (2009); Wang et al. (2009); Jourdan and ten Haaf (2010); Jung et al. (2010); Chen et al. (2011); Schneider et al. (2012) However, the values of the FeSe films reported to date are rather low, and there are few reports on the fabrication of FeSe thin films with good superconducting properties. The lattice constants of these FeSe films were similar to those of bulk crystals. In a previous study of Fe(Se,Te) thin film fabrication, Imai et al. (2010a) we found that is positively correlated with the ratio of the lattice parameters, . A subsequent study Tsukada et al. (2011) revealed that compared with oxide substrates, the use of CaF2 substrates can introduce a strong in-plane compressive strain in the films. We expect to observe the same effect for FeSe films and also expect an enhancement of superconducting properties, such as an increased .
In this Letter, we report the fabrication of high-quality epitaxial thin films of FeSe on CaF2 substrates using a pulsed laser deposition (PLD) method. We demonstrate that the films are compressed along the -axis and their superconducting transition temperatures reach 11.4 K, which is approximately 1.5 times higher than that of bulk crystals. Our results in this binary system are very promising, and will open a new route for the application of Fe-based superconductors.
All of the films in this study were grown by the PLD method with a KrF laser. Imai et al. (2010b, a) FeSe polycrystalline pellets were used as targets. The substrate temperature, the laser repetition rate, and the back pressure were 280, 10 Hz and 10-6 Torr, respectively. Commercially available CaF2 (100) substrates were used for the present experiments. Although some groups have reported that crystal orientation along the (101) direction, accomplished by using substrate temperatures of as high as 500∘C, is the key for the fabrication of FeSe thin films with high values, Wang et al. (2009); Jung et al. (2010) we adopted lower substrate temperatures and obtained -axis preferred orientation. Nevertheless, as will be described later, our films show very good superconducting properties. Indeed, films with -axis orientation are advantageous for measurements of the in-plane (-plane) conductivity. We prepared eight thin films with different thicknesses. The films were fabricated in a six-terminal shape through the use of a metal mask. The measured area was 0.95 mm long and 0.2 mm wide. The thicknesses of the grown films were measured using a Dektak 6M stylus profiler and were estimated to be 60 - 235 nm. The films are designated as C1 - C8 in order of the film thickness. The specifications of all of the films are summarized in table 1. The crystal structures and the orientations of the films were characterized by four-circle X-ray diffraction (XRD) with Cu K radiation at room temperature. The -axis and -axis lattice constants of the films were calculated from the positions of the 001-004 reflections and the 200 reflection, respectively. The electrical resistivity was measured using a physical property measurement system (PPMS) from 2 to 300 K under magnetic fields of up to 9 T applied perpendicularly to the film surface. Superconductivity was also confirmed by the magnetization measurement.
| thickness (nm) | -axis (Å) | -axis (Å) | (K) | (K) | (K) | |
|---|---|---|---|---|---|---|
| C1 | 60 | 3.761 | 5.537 | 6.43 | 5.42 | 4.2 |
| C2 | 75 | 3.747 | 5.549 | 8.60 | 7.48 | 6.11 |
| C3 | 85 | 3.720 | 5.560 | 11.67 | 10.51 | 8.41 |
| C4 | 92 | 3.730 | 5.567 | 11.53 | 10.80 | 9.33 |
| C5 | 120 | 3.715 | 5.578 | 11.71 | 11.46 | 10.82 |
| C6 | 150 | 3.714 | 5.584 | 12.35 | 11.92 | 11.38 |
| C7 | 205 | 3.722 | 5.582 | 11.74 | 11.44 | 10.38 |
| C8 | 235 | 3.730 | 5.579 | 11.24 | 11.03 | 10.47 |
Fig. 1(a) shows the -2 X-ray diffraction patterns of the eight FeSe thin films grown on CaF2 (100) substrates (C1 - C8). These films show only the 00 reflections of the tetragonal PbO structure, indicating that the films are well-oriented along the -axis. Fig. 1(b) shows the scans of the 101 reflection of film C6. A clear four-fold symmetry reflection was obtained. The full widths at half maximum (FWHM) is (shown in the inset of fig. 1(b)), which is comparable to those of Fe(Se,Te) films on CaF2 substrates. Tsukada et al. (2011) We have also confirmed the in-plane orientation to be FeSe[100] CaF2[110], similar to Fe(Se,Te). The calculated - and -axis lengths of the grown films are shown in table 1. It is clear that the -axis lengths are dependent on the film thickness; the -axis decreases as the film thickness increases up to 150 nm, and then the -axis slightly increases for films with larger thickness. This behavior is similar to that observed in Fe(Se,Te) films on LaAlO3. Bellingeri et al. (2010) The authors in ref. Bellingeri et al. (2010) explained that this thickness dependence is due to Volmer-Weber type growth of the Fe(Se,Te) film, which we believe is also the case with FeSe films on CaF2. Compared with the lattice parameters for bulk single crystals ( Å, Å), McQueen et al. (2009); de Souza et al. (2010); Hu et al. (2011) the films grown on CaF2 are compressed along the -axis and are simultaneously elongated along the -axis. Such short -axis lengths of the FeSe films can not be explained simply by the difference between the lattice constants of the substrate and the overlayer because the lattice constants of CaF2 ( Å) are longer than the -axis of FeSe. The penetration of F- ions from the CaF2 substrates into the films has been proposed as a possible mechanism for the contraction of the -axis lengths of the Fe(Se,Te) films. Ichinose et al. (2013) The substitution of small F- ions for large Se2- ions shortens the -axis. Thus it is natural to consider that the short -axis lengths of the FeSe films on CaF2 can be explained by the same mechanism proposed for Fe(Se,Te) films. We should note that the diffusion of other atoms (Fe, Te and Ca) was not detected in the previous measurement. Ichinose et al. (2013)
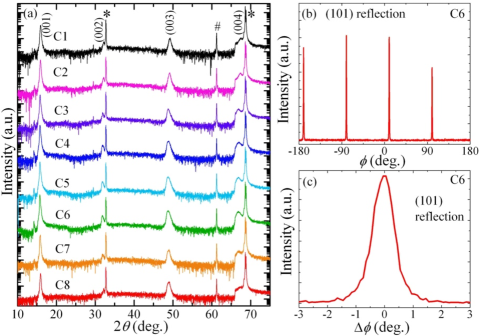
Fig. 2(a) shows the temperature dependence of the resistivities of the grown films (C1 - C8). The temperature dependence of the resistivity shows metallic behavior similar to that of the bulk samples. The magnitudes of the resistivity at room temperature are 0.35 - 0.6 mcm, which are smaller than those of bulk single crystalline samples. McQueen et al. (2009); de Souza et al. (2010); Hu et al. (2011) All of the films show the onset of the superconducting transition at temperatures above 4.2 K, and zero resistivity was observed in all films except film C1. As the thickness becomes smaller for films with thickness less than 100 nm, the magnitude of the resistivity increases, and decreases correspondingly. Although the tendency that decreases with decreasing thickness has also been reported for FeSe films with -axis preferred orientation Schneider et al. (2012) before, our films on CaF2 show higher even for films with much smaller thickness than those reported in ref. Schneider et al. (2012). It should be noted that for FeSe films with thicknesses less than 100 nm, = 9.33 K is also far better than the previously reported results for films on oxide substrates with (101) orientation ( 6.5 K for 140 nm, 8 K for 1.5 m). Wang et al. (2009); Jung et al. (2010) The thickness dependence of is similar to that of the -axis length of the films; increases with increasing film thickness up to 150 nm and further increase of thickness results in the decrease in . It is remarkable that films C4 - C8 show values higher than those of the bulk crystals. In particular, film C6 has a of 11.4 K, which is approximately 1.5 times higher than those of the bulk samples. This is the first report demonstrating that FeSe films show higher values than bulk single crystals, except for possible interface superconductivity Qing-Yan et al. (2012) between FeSe and SrTiO3. It should also be noted that these films do not require any buffer layers.
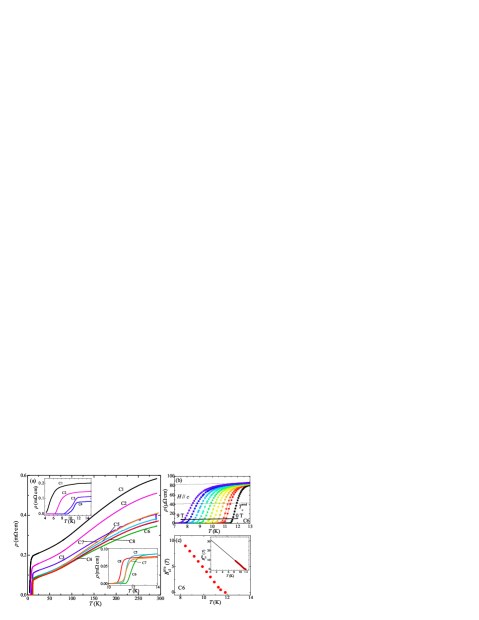
Fig. 2(b) shows the temperature dependence of the resistivity of film C6 under magnetic fields up to T applied along the -axis. The superconducting transition temperature decreases as the magnetic field increases. In fig. 2(c) the upper critical field, , is plotted as a function of , the temperature at which the resistivity drops to a half of its value in the normal state. increases almost linearly as the temperature decreases. The slight positive curvature of () observed at very low fields may derive from the multiband nature of this material. Imai et al. (2012) For multiband superconductors, it is hard to predict the upper critical field at 0 K, , from the low field data. Nevertheless, we show some estimated values in order to compare them to the data in the literature. The upper critical field at 0 K is estimated by linear extrapolation to be T. The conventional Werthamer-Helfand-Hohenberg theory () predicts that 22.8 T; this value is higher than any reported value for FeSe thin films that was estimated in the same way. Jourdan and ten Haaf (2010); Chen et al. (2011) Using , we can get a Ginzburg-Landau coherence length of Å, which is longer than that of FeSe0.5Te0.5 thin films on CaF2 substrates. Tsukada et al. (2011) These aspects of FeSe thin films on CaF2 should be beneficial for applications of these materials. Our results for this binary system will open a new path for applied studies of iron-based superconductors.
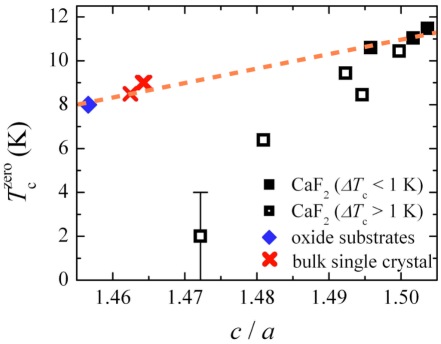
Finally we discuss the relation between and the lattice parameters. As previously described, we expected that the in-plane compression of the films, represented by large values, would increase . Indeed our results support this expectation. In fig. 3, we plot the dependence of for the eight films and for bulk single crystals McQueen et al. (2009); de Souza et al. (2010); Hu et al. (2011) and films on oxide substrates. Jung et al. (2010) of the FeSe films on CaF2 increases monotonically as increases, similar to that observed for FeSe0.5Te0.5 films. Imai et al. (2010a) However, in contrast to FeSe0.5Te0.5, the values of single crystals and films on oxide substrates do not seem to exhibit the same dependence on . One possible explanation for this new complexity is the effect of disorders. It is well-known that the excess Fe, which occupies an additional Fe site, strongly affects the superconductivity in FeSe. McQueen et al. (2009) We speculate that because of the high vapor pressure of Se, the ratio of Se to Fe becomes smaller than the stoichiometric value near the surface of the film, leading to the increase in the amount of Fe which occupies the extra Fe site. Our result is that resistivity increases and decreases with decreasing thickness for films with thickness smaller than 100 nm. This is interpreted that the influence of the regions with excess Fe becomes dominant as the films gets thinner. If we consider the superconducting transition width, (), to be an index of the crystal quality and consider only the data for films with K, seems to correlate with , as shown by an orange dashed line in fig. 3. In this case, dependence of of FeSe is weak compared to that of Fe(Se,Te), and the values of FeSe films under anisotropic compression are unlikely to reach 37 K, which is accomplished by hydrostatic pressure. Masaki et al. (2009); Medvedev et al. (2009) Therefore, the simultaneous compression of the - and -axis lengths may be a key to realize a very high material. We should note, however, that the relation between and is simplistic and is only a guiding principle in the search for high materials. To understand the relation between and crystal structure, we should evaluate specific structural parameters, such as the -Fe- angle Lee et al. (2008) and/or the height from the Fe layer. Mizuguchi and Takano (2010)
In summary, in order to investigate the effects of in-plane strain on the superconductivity of FeSe, we fabricated high-quality FeSe epitaxial thin films oriented along the -axis on CaF2 substrates. X-ray diffraction analysis showed that our films have shorter -axis and longer -axis lengths in comparison to bulk single crystals, demonstrating that a large in-plane compressive strain was introduced in the FeSe films. We demonstrated that can reach 11.4 K, which is approximately 1.5 times greater than the values of bulk crystals. Further studies of strain effects will lead to higher values. Our results in this binary system are very promising and will open a new route for the application of Fe-based superconductors.
Acknowledgements.
We would like to thank S. Komiya and A. Ichinose for fruitful discussion. We also thank K. Fukawa at the Institute of Engineering Innovation, School of Engineering, University of Tokyo for supporting in the XRD measurements of the films. This research was supported by the Strategic International Collaboration Research Program (SICORP), Japan Science and Technology Agency.References
- Kamihara et al. (2008) Y. Kamihara, T. Watanabe, M. Hirano, and H. Hosono, Journal of the American Chemical Society 130, 3296 (2008).
- Hsu et al. (2008) F.-C. Hsu, J.-Y. Luo, K.-W. Yeh, T.-K. Chen, T.-W. Huang, P. M. Wu, Y.-C. Lee, Y.-L. Huang, Y.-Y. Chu, D.-C. Yan, and M.-K. Wu, Proceedings of the National Academy of Sciences 105, 14262 (2008).
- Masaki et al. (2009) S. Masaki, H. Kotegawa, Y. Hara, H. Tou, K. Murata, Y. Mizuguchi, and Y. Takano, Journal of the Physical Society of Japan 78, 063704 (2009).
- Medvedev et al. (2009) S. Medvedev, T. M. McQueen, I. A. Troyan, T. Palasyuk, M. I. Eremets, R. J. Cava, S. Naghavi, F. Casper, V. Ksenofontov, G. Wortmann, and C. Felser, Nature Materials 8, 630 (2009).
- Bellingeri et al. (2010) E. Bellingeri, I. Pallecchi, R. Buzio, A. Gerbi, D. Marrè, M. R. Cimberle, M. Tropeano, M. Putti, A. Palenzona, and C. Ferdeghini, Applied Physics Letters 96, 102512 (2010).
- Iida et al. (2011) K. Iida, J. Hanisch, M. Schulze, S. Aswartham, S. Wurmehl, B. Buchner, L. Schultz, and B. Holzapfel, Applied Physics Letters 99, 202503 (2011).
- Tsukada et al. (2011) I. Tsukada, M. Hanawa, T. Akiike, F. Nabeshima, Y. Imai, A. Ichinose, S. Komiya, T. Hikage, T. Kawaguchi, H. Ikuta, and A. Maeda, Applied Physics Express 4, 053101 (2011).
- Si et al. (2012) W. Si, S. J. Han, X. Shi, S. N. Ehrlich, J. Jaroszynski, A. Goyal, and Q. Li, Nat. Commun. 4, 1347 (2012).
- Horigane et al. (2009) K. Horigane, N. Takeshita, C.-H. Lee, H. Hiraka, and K. Yamada, Journal of the Physical Society of Japan 78, 063705 (2009).
- Qing-Yan et al. (2012) W. Qing-Yan, L. Zhi, Z. Wen-Hao, Z. Zuo-Cheng, Z. Jin-Song, L. Wei, D. Hao, O. Yun-Bo, D. Peng, C. Kai, W. Jing, S. Can-Li, H. Ke, J. Jin-Feng, J. Shuai-Hua, W. Ya-Yu, W. Li-Li, C. Xi, M. Xu-Cun, and X. Qi-Kun, Chinese Physics Letters 29, 037402 (2012).
- Han et al. (2009) Y. Han, W. Y. Li, L. X. Cao, S. Zhang, B. Xu, and B. R. Zhao, Journal of Physics: Condensed Matter 21, 235702 (2009).
- Nie et al. (2009) Y. F. Nie, E. Brahimi, J. I. Budnick, W. A. Hines, M. Jain, and B. O. Wells, Applied Physics Letters 94, 242505 (2009).
- Wang et al. (2009) M. J. Wang, J. Y. Luo, T. W. Huang, H. H. Chang, T. K. Chen, F. C. Hsu, C. T. Wu, P. M. Wu, A. M. Chang, and M. K. Wu, Phys. Rev. Lett. 103, 117002 (2009).
- Jourdan and ten Haaf (2010) M. Jourdan and S. ten Haaf, Journal of Applied Physics 108, 023913 (2010).
- Jung et al. (2010) S.-G. Jung, N. Lee, E.-M. Choi, W. Kang, S.-I. Lee, T.-J. Hwang, and D. Kim, Physica C: Superconductivity 470, 1977 (2010).
- Chen et al. (2011) L. Chen, C.-F. Tsai, Y. Zhu, Z. Bi, and H. Wang, Physica C: Superconductivity 471, 515 (2011).
- Schneider et al. (2012) R. Schneider, A. G. Zaitsev, D. Fuchs, and H. v. Löhneysen, Phys. Rev. Lett. 108, 257003 (2012).
- Imai et al. (2010a) Y. Imai, T. Akiike, M. Hanawa, I. Tsukada, A. Ichinose, A. Maeda, T. Hikage, T. Kawaguchi, and H. Ikuta, Applied Physics Express 3, 043102 (2010a).
- Imai et al. (2010b) Y. Imai, R. Tanaka, T. Akiike, M. Hanawa, I. Tsukada, and A. Maeda, Japanese Journal of Applied Physics 49, 023101 (2010b).
- McQueen et al. (2009) T. M. McQueen, Q. Huang, V. Ksenofontov, C. Felser, Q. Xu, H. Zandbergen, Y. S. Hor, J. Allred, A. J. Williams, D. Qu, J. Checkelsky, N. P. Ong, and R. J. Cava, Phys. Rev. B 79, 014522 (2009).
- de Souza et al. (2010) M. de Souza, A.-A. Haghighirad, U. Tutsch, W. Assmus, and M. Lang, The European Physical Journal B 77, 101 (2010).
- Hu et al. (2011) R. Hu, H. Lei, M. Abeykoon, E. S. Bozin, S. J. L. Billinge, J. B. Warren, T. Siegrist, and C. Petrovic, Phys. Rev. B 83, 224502 (2011).
- Ichinose et al. (2013) A. Ichinose, F. Nabeshima, I. Tsukada, M. Hanawa, S. Komiya, T. Akiike, Y. Imai, and A. Maeda, Superconductor Science and Technology 26, 075002 (2013).
- Imai et al. (2012) Y. Imai, F. Nabeshima, T. Yoshinaka, K. Miyatani, R. Kondo, S. Komiya, I. Tsukada, and A. Maeda, Journal of the Physical Society of Japan 81, 113708 (2012).
- Lee et al. (2008) C.-H. Lee, A. Iyo, H. Eisaki, H. Kito, M. T. Fernandez-Diaz, T. Ito, K. Kihou, H. Matsuhata, M. Braden, and K. Yamada, Journal of the Physical Society of Japan 77, 083704 (2008).
- Mizuguchi and Takano (2010) Y. Mizuguchi and Y. Takano, Journal of the Physical Society of Japan 79, 102001 (2010).