Searches for resonances in the tb and tc final states at the high-luminosity LHC
Abstract
We study resonances decaying to one top quark and one additional quark ( or ) at the low-luminosity and high-luminosity 14 TeV LHC and at a future 33 TeV hadron collider in the context of Snowmass 2013. A heavy boson that preferentially couples to quarks can be found through its decay to . A Kaluza-Klein gluon might have a significant branching ratio to . The final state in these searches has a lepton and neutrino from a W boson decay plus two jets, at least one of which is -tagged. We give expected limits as a function of boson and masses for different collider energy and integrated luminosity options.
pacs:
14.65.Jk, 14.65.Ha, 12.60.-i, 14.80.RtI Introduction
The Large Hadron Collider (LHC) is the highest-energy particle accelerator ever built, probing physics at the TeV scale. The Higgs boson discovery Aad et al. (2012a); Chatrchyan et al. (2012) was the first, but more discoveries are likely as the LHC covers the energy range where new physics is expected. Searches for high-mass resonances take advantage of the high center-of-mass (CM) energy of the LHC and have been performed in many final states. The mode, where corresponds to and , is particularly sensitive to a heavy partner of the boson, i.e. a boson coupling primarily to quarks and the third generation Tait and Yuan (2000). Such a boson appears in new physics models that have additional symmetries, such as universal extra dimensions Datta et al. (2000) or little Higgs models Perelstein (2007).
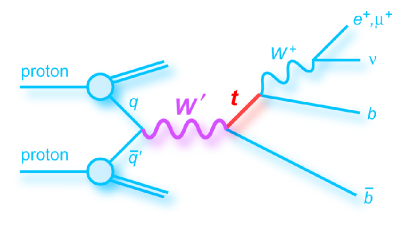
Searches for a boson have been performed by ATLAS Aad et al. (2012b, 2013) and CMS Chatrchyan et al. (2013), with mass limits approaching 2 TeV for different couplings. The Feynman diagram for production is shown in Fig. 1. We focus on bosons with purely right-handed couplings, the sensitivity to left-handed or mixed couplings is similar.
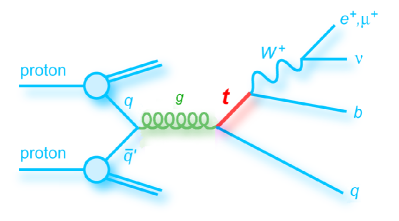
Another possibility that has not been explored experimentally yet is the flavor-changing neutral current (FCNC) decay of a Kaluza-Klein gluon () Aquino et al. (2007). We study a that has a non-negligible branching ratio to , where corresponds to and Delaunay et al. (2011). The Feynman diagram for production is shown in Fig. 2. It is likely that such a particle will be discovered first in its dominant decay mode, and we present the 95% confidence level (C.L.) limit as a function of the mass for the process , at a cross-section corresponding to a 40 of the cross-section Agashe et al. (2006), which is evaluated at next-to-leading order (NLO) in QCD Chivukula et al. (2011) by scaling the leading order (LO) cross section by a factor 1.3.
In this paper we explore the sensitivity of 14 TeV and 33 TeV proton-proton colliders to bosons and in three different scenarios under investigation for the Snowmass 2013 process: 300 fb-1 at 14 TeV with an average pileup of 50 events, 3000 fb-1 at 14 TeV with an average pileup of 140 events, and 3000 fb-1 at 33 TeV with an average pileup of 140 events. For each scenario the Snowmass LHC detector models are used Anderson et al. (2013).
II Signal and Background Modeling
The and events are generated with Madgraph5 Alwall et al. (2011) and passed through Pythia8 Sjöstrand et al. (2001) for showering and Delphes3 De Favereau J., Delaere C., Demin P., Giammanco A., Lemaître V., Mertens A., Selvaggi M. (2013) for detector modeling, using the Snowmass settings Anderson et al. (2013).
At each mass point, and events are generated with equal amounts of top and antitop events, 50,000 each. Only boson decays to an electron or a muon are included.
In addition to these signal samples, background samples generated for Snowmass are used Avetisyan et al. (2013). Those samples are diboson, +Jets, , , -channel, and -channel single top. Each background is normalized according to the corresponding sample cross-section. The signal samples are normalized to NLO cross-sections Sullivan (2013) as shown in Table 1. The samples are normalized to 40% of the corresponding cross-section at NLO as shown in Table 2.
| Mass [TeV] | 14 TeV | 33 TeV | ||
|---|---|---|---|---|
| [pb] | [pb] | [pb] | [pb] | |
| 1 TeV | 9.97E+00 | 4.68E+00 | 3.84E+01 | 2.29E+01 |
| 2 TeV | 5.14E-01 | 1.86E-01 | 3.29E+00 | 1.62E+00 |
| 3 TeV | 5.55E-02 | 1.81E-02 | 6.65E-01 | 2.81E-01 |
| 4 TeV | 7.72E-03 | 2.62E-03 | 1.88E-01 | 7.21E-02 |
| 5 TeV | 1.37E-03 | 5.35E-04 | 6.37E-02 | 2.26E-02 |
| 6 TeV | 3.71E-04 | 1.61E-04 | 2.40E-02 | 8.09E-03 |
| 7 TeV | 1.57E-04 | 6.99E-05 | 9.53E-03 | 3.18E-03 |
| 8 TeV | 4.00E-03 | 1.35E-03 | ||
| 9 TeV | 1.76E-03 | 6.09E-04 | ||
| 10 TeV | 8.12E-04 | 2.97E-04 | ||
| 11 TeV | 3.95E-04 | 1.55E-04 | ||
| 12 TeV | 2.08E-04 | 8.71E-05 | ||
| Mass [TeV] | 14 TeV | 33 TeV |
|---|---|---|
| 1 TeV | 9.83E+00 | 4.43E+01 |
| 2 TeV | 5.20E-01 | 3.55E+00 |
| 3 TeV | 6.55E-02 | 6.97E-01 |
| 4 TeV | 1.28E-02 | 1.99E-01 |
| 5 TeV | 3.90E-03 | 6.92E-02 |
| 6 TeV | 1.42E-03 | 2.77E-02 |
| 7 TeV | 6.60E-04 | 1.24E-02 |
| 8 TeV | 5.98E-03 | |
| 9 TeV | 3.11E-03 | |
| 10 TeV | 1.72E-03 | |
| 11 TeV | 1.03E-03 | |
| 12 TeV | 8.06E-04 |
III Analysis
Signal and background events are required to pass the following basic selection cuts for both and . Signal-specific cuts are applied in a second step described in Section IV.
where and correspond to the transverse momentum and pseudorapidity of the lepton, and and are the transverse momentum and pseudorapidity of each jet. Jets are reconstructed using the Cambridge-Aachen (CA) jet clustering algorithm A Cambridge-Aachen based Jet Algorithm for boosted top-jet tagging(2009) (C-A) with a radius parameter of , ideal for the high- jets and top quark decays associated with our signal and backgrounds.
Information about the flavor content of jets is obtained by looking for a match within with a -tagged anti-kt jet M. Cacciari, G.P. Salam and G. Soyez (2008) with radius parameter .
All samples are weighted to cross-section times integrated luminosity, including event-specific weights:
| (2) |
Here, the cross-section corresponds to the signal and background cross-sections described in II. The and cross-sections from Tables 1 and 2 are multiplied by an additional factor of to account for the boson decay branching ratios to or .
Tables 3 and 4 give the expected event yields for and and the backgrounds, respectively, for each of the scenarios under consideration. The signal-to-background ratio is shown in Table 5 for the analysis and in Table 6 for the analysis. The dominant background for 300 at 14 TeV is production, followed by //+jets. For the 3000 scenarios at both 14 TeV and 33 TeV, //+jets is the dominant background followed by .
| Preselection | 14 TeV | 33 TeV | |
|---|---|---|---|
| 300 | 3000 | 3000 | |
| Diboson | 1.20E+05 | 6.51E+06 | 3.75E+07 |
| //+Jets | 2.39E+06 | 5.80E+08 | 5.39E+09 |
| 4.24E+06 | 2.28E+08 | 1.59E+09 | |
| single top | 3.30E+05 | 1.75E+07 | 1.14E+08 |
| -channel single top | 3.31E+05 | 2.36E+07 | 1.17E+08 |
| (1 TeV) | 3.43E+05 | 4.51E+06 | 1.73E+07 |
| (2 TeV) | 1.66E+04 | 1.76E+05 | 1.14E+06 |
| (3 TeV) | 1.24E+03 | 1.27E+04 | 1.53E+05 |
| (4 TeV) | 1.25E+02 | 1.30E+03 | 2.95E+04 |
| (5 TeV) | 1.79E+01 | 1.88E+02 | 7.45E+03 |
| (6 TeV) | 4.88E+00 | 5.50E+01 | 2.26E+03 |
| (7 TeV) | 2.63E+00 | 3.41E+01 | 7.61E+02 |
| (8 TeV) | 2.87E+02 | ||
| (9 TeV) | 1.15E+02 | ||
| (10 TeV) | 5.25E+01 | ||
| (11 TeV) | 2.47E+01 | ||
| (12 TeV) | 1.36E+01 | ||
| Preselection | 14 TeV | 33 TeV | |
|---|---|---|---|
| 300 | 3000 | 3000 | |
| Diboson | 1.20E+05 | 6.51E+06 | 3.75E+07 |
| //+Jets | 2.39E+06 | 5.80E+08 | 5.39E+09 |
| 4.24E+06 | 2.28E+08 | 1.59E+09 | |
| single top | 3.30E+05 | 1.75E+07 | 1.14E+08 |
| -channel single top | 3.31E+05 | 2.36E+07 | 1.17E+08 |
| (1 TeV) | 1.60E+05 | 2.28E+06 | 9.38E+06 |
| (2 TeV) | 8.85E+03 | 1.03E+05 | 6.34E+05 |
| (3 TeV) | 8.77E+02 | 1.03E+04 | 9.45E+04 |
| (4 TeV) | 1.52E+02 | 1.91E+03 | 2.17E+04 |
| (5 TeV) | 4.65E+01 | 6.20E+02 | 6.90E+03 |
| (6 TeV) | 1.77E+01 | 2.47E+02 | 2.71E+03 |
| (7 TeV) | 8.44E+00 | 1.21E+02 | 1.26E+03 |
| (8 TeV) | 6.57E+02 | ||
| (9 TeV) | 3.61E+02 | ||
| (10 TeV) | 2.09E+02 | ||
| (11 TeV) | 1.28E+02 | ||
| (12 TeV) | 8.36E+01 | ||
| Preselection | 14 TeV | 33 TeV | |
|---|---|---|---|
| 300 | 3000 | 3000 | |
| (1 TeV) | 4.63E-02 | 5.25E-03 | 6.22E-05 |
| (2 TeV) | 2.24E-03 | 2.04E-04 | 4.20E-06 |
| (3 TeV) | 1.67E-04 | 1.48E-05 | 6.27E-07 |
| (4 TeV) | 1.69E-05 | 1.51E-06 | 1.44E-07 |
| (5 TeV) | 2.42E-06 | 2.19E-07 | 4.58E-08 |
| (6 TeV) | 6.59E-07 | 6.39E-08 | 1.80E-08 |
| (7 TeV) | 3.56E-07 | 3.96E-08 | 8.37E-09 |
| (8 TeV) | 4.36E-09 | ||
| (9 TeV) | 2.40E-09 | ||
| (10 TeV) | 1.39E-09 | ||
| (11 TeV) | 8.51E-10 | ||
| (12 TeV) | 5.55E-10 | ||
| Preselection | 14 TeV | 33 TeV | |
|---|---|---|---|
| 300 | 3000 | 3000 | |
| (1 TeV) | 2.16E-02 | 2.67E-03 | 1.29E-03 |
| (2 TeV) | 1.19E-03 | 1.20E-04 | 8.74E-05 |
| (3 TeV) | 1.18E-04 | 1.20E-05 | 1.30E-05 |
| (4 TeV) | 2.05E-05 | 2.24E-06 | 3.00E-06 |
| (5 TeV) | 6.28E-06 | 7.25E-07 | 9.52E-07 |
| (6 TeV) | 2.39E-06 | 2.89E-07 | 3.74E-07 |
| (7 TeV) | 1.14E-06 | 1.42E-07 | 1.74E-07 |
| (8 TeV) | 9.06E-08 | ||
| (9 TeV) | 4.98E-08 | ||
| (10 TeV) | 2.89E-08 | ||
| (11 TeV) | 1.77E-08 | ||
| (12 TeV) | 1.15E-08 | ||
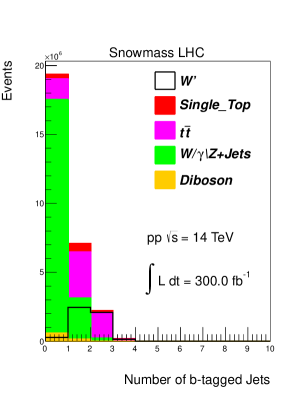
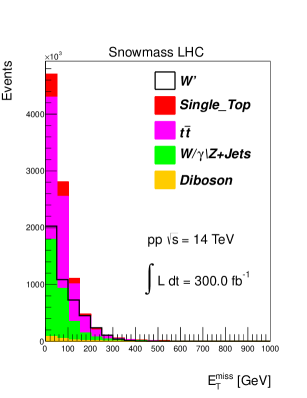
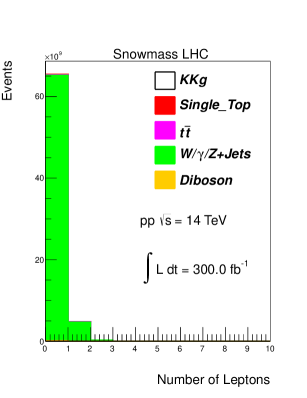
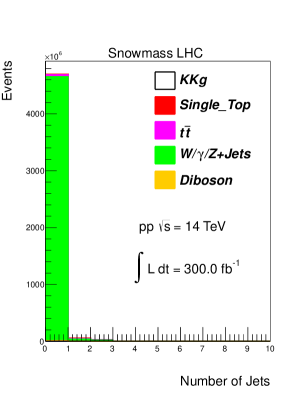
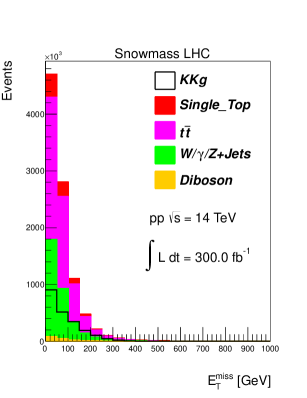
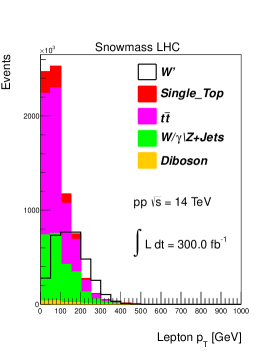
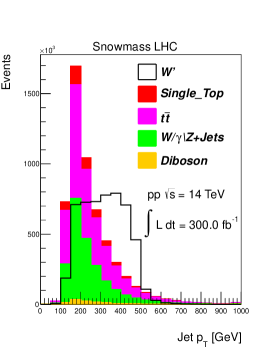
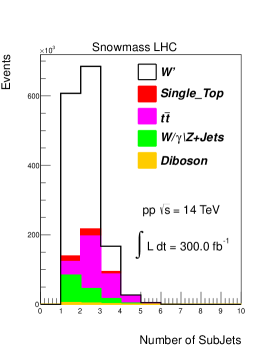
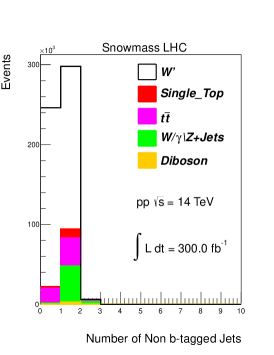
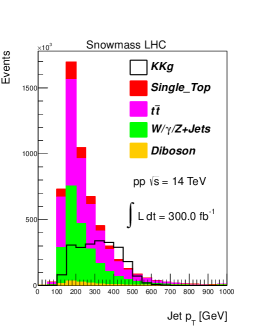
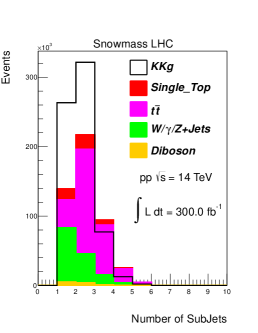
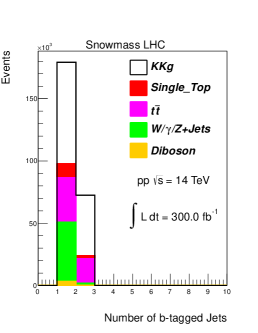
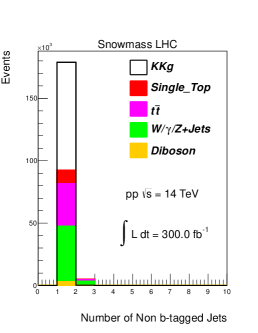
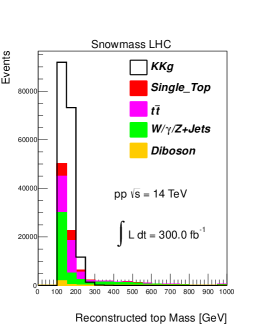
Figures 4 and 3 show kinematic distributions for these preselection variables when cuts are applied in the order given in Eq. LABEL:eq:basiccut, for and , respectively.

IV Event selection
To improve the signal to background ratio, events are required to pass the following additional selection cuts in the analysis:
| (3) |
The cuts are chosen from a larger set of available variables and cuts through a systematic approach. For each cut on a given variable, the integral of the signal over the square root of the background is computed. In addition, since the event yields in this analysis are large, the systematic uncertainty on the background (10%) is taken into account by defining the figure of merit () as
| (4) |
where () is the number of expected signal (background) events passing the cut.
Figure 6 shows the kinematic distributions for these analysis variables for events that pass the preselection cuts (Eq. LABEL:eq:basiccut) and the cuts from Eq. 3 up to the variable in question.

Similar, though not identical, cuts are used for the analysis:
| (5) |
Figure 5 shows the kinematic distributions for these analysis variables for events that pass the preselection cuts (Eq. LABEL:eq:basiccut) and the cuts from Eq. 5 up to the variable in question.
In each case, the neutrino is reconstructed from the , , lepton , lepton , and lepton using a boson mass constraint, which results in a quadratic equation that yields either one solution, two solutions, or imaginary solutions for the neutrino . In the case of two solutions, the smaller solution of the two is chosen. In the case of imaginary solutions, the neutrino is scaled such that a solution is obtained with the . The is reconstructed by adding the reconstructed neutrino to the lepton. The top is reconstructed using the reconstructed and the jet that gives a top mass closest to 172.0 GeV. The and are both reconstructed using the reconstructed and the two leading jets.
V Results
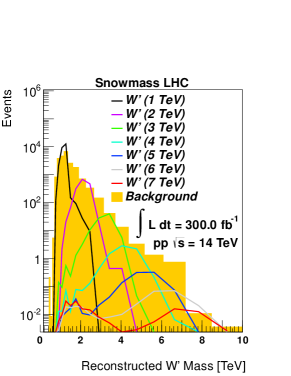
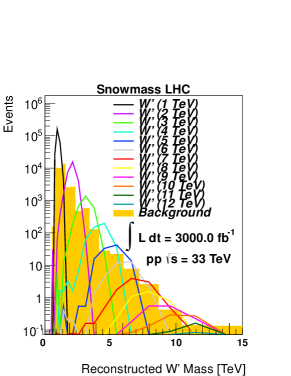
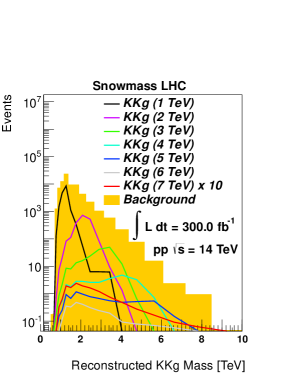
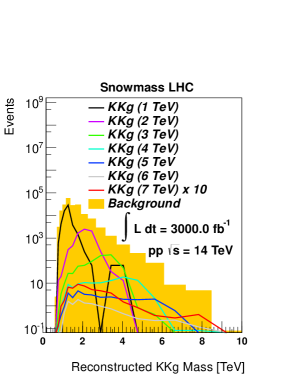
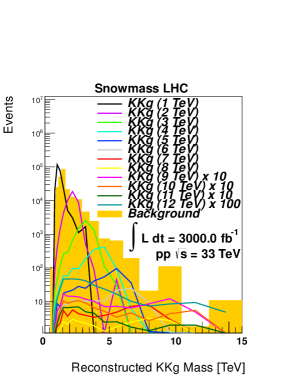
The reconstructed resonance mass for events passing the selection cuts are shown in Fig. 7 for the analysis and in Fig. 8 for the analysis.
Tables 7 and 8 show the number of signal and background events passing the final selection described above for the and analyses, respectively, at various pileup configurations, luminosities, and energies.
| Final Selection | 14 TeV | 33 TeV | |
|---|---|---|---|
| 300 | 3000 | 3000 | |
| (1 TeV) | 2.23E+04/1.76E+04 | 7.07E+04/3.89E+04 | 2.24E+05/4.02E+04 |
| (2 TeV) | 1.07E+03/1.09E+03 | 3.50E+03/2.50E+03 | 1.95E+04/3.89E+03 |
| (3 TeV) | 5.60E+01/8.46E+01 | 1.78E+02/2.19E+02 | 1.79E+03/6.92E+02 |
| (4 TeV) | 4.19E+00/1.10E+01 | 1.29E+01/1.86E+01 | 2.85E+02/8.37E+01 |
| (5 TeV) | 4.56E-01/2.36E+00 | 1.59E+00/4.29E+00 | 5.60E+01/3.31E+01 |
| (6 TeV) | 9.69E-02/7.83E-01 | 2.85E-01/1.05E+00 | 1.48E+01/1.10E+01 |
| (7 TeV) | 1.93E-02/2.20E-02 | 5.71E-02/3.92E-02 | 4.64E+00/5.00E+00 |
| (8 TeV) | 1.79E+00/2.78E+00 | ||
| (9 TeV) | 6.87E-01/6.95E-01 | ||
| (10 TeV) | 3.70E-01/6.95E-01 | ||
| (11 TeV) | 2.04E-01/2.73E-01 | ||
| (12 TeV) | 8.55E-02/1.34E-01 | ||
| Final Selection | 14 TeV | 33 TeV | |
|---|---|---|---|
| 300 | 3000 | 3000 | |
| (1 TeV) | 1.49E+04/6.41E+04 | 5.01E+04/1.71E+05 | 2.26E+05/2.14E+05 |
| (2 TeV) | 1.21E+03/7.34E+03 | 4.43E+03/2.06E+04 | 2.80E+04/3.28E+04 |
| (3 TeV) | 7.69E+01/1.13E+03 | 2.81E+02/2.67E+03 | 3.61E+03/7.12E+03 |
| (4 TeV) | 6.84E+00/1.98E+02 | 2.67E+01/5.72E+02 | 6.29E+02/1.95E+03 |
| (5 TeV) | 7.93E-01/2.33E+01 | 3.04E+00/1.07E+02 | 1.35E+02/9.91E+02 |
| (6 TeV) | 7.88E-02/3.51E+00 | 3.49E-01/1.32E+01 | 3.56E+01/2.40E+02 |
| (7 TeV) | 9.12E-03/1.51E+00 | 4.98E-02/5.17E+00 | 1.28E+01/1.48E+02 |
| (8 TeV) | 4.74E+00/1.30E+02 | ||
| (9 TeV) | 1.43E+00/1.22E+02 | ||
| (10 TeV) | 7.16E-01/1.44E+01 | ||
| (11 TeV) | 2.40E-01/1.15E+01 | ||
| (12 TeV) | 6.52E-02/1.09E+01 | ||
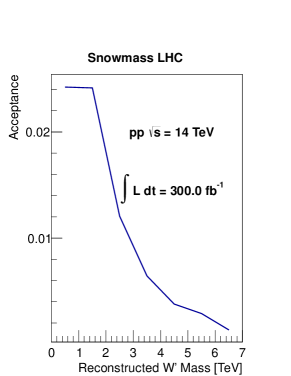
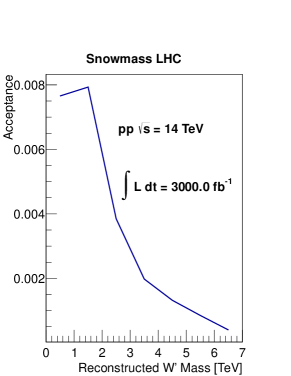
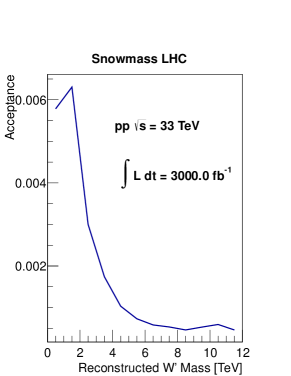
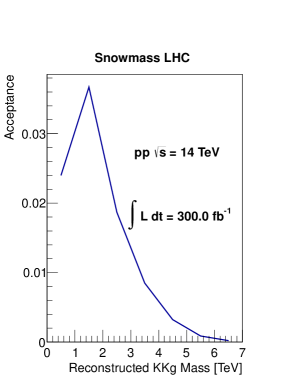
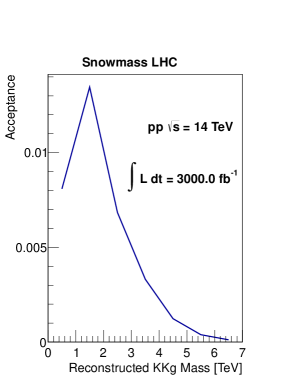
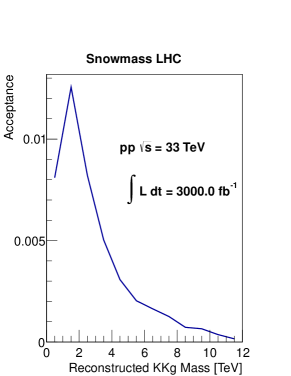
We define the acceptance as the ratio of the initial number of events ( or events including decay to electron or muon) and the final number of selected events. The acceptance for events to pass the selection cuts as a function of the mass is shown in Fig. 9. The acceptance for events to pass the selection cuts as a function of the mass is shown in Fig. 10.
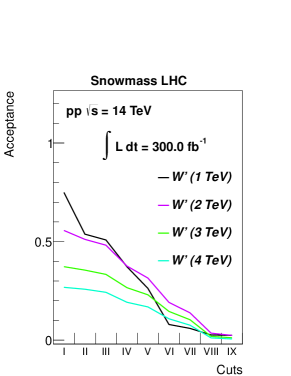
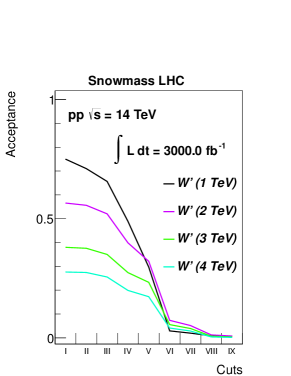
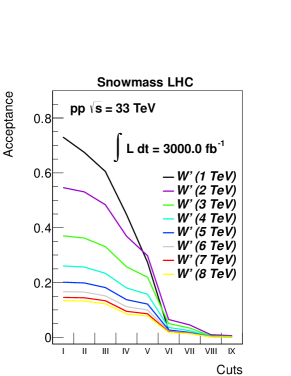
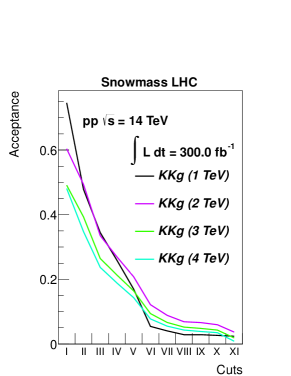
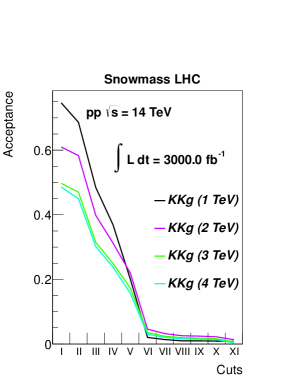
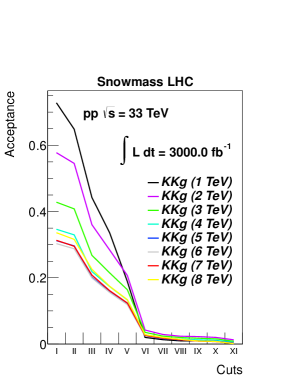
It is also interesting to view the acceptance as a function of the cut made, as for the analysis in Fig. 11 and for the analysis in Fig. 12.
V.1 Cross-Section Limits
Finally, 95 confidence limits on the and KKg cross-sections are set assuming a background normalization uncertainty of 10. The cross-section limits are converted into mass limits using the theoretical dependence on the resonance mass.
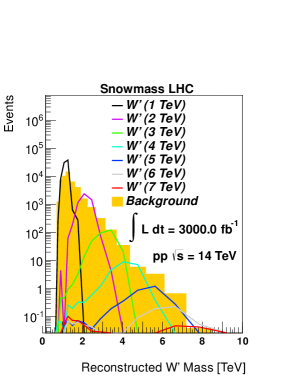
Fig. 13 shows the cross-section times branching ratio as a function of the mass at 14 TeV and 33 TeV for different luminosities.
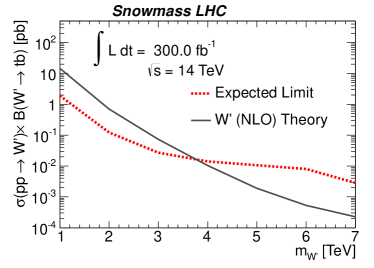
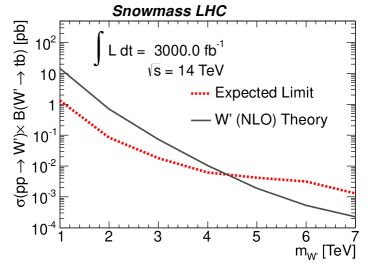
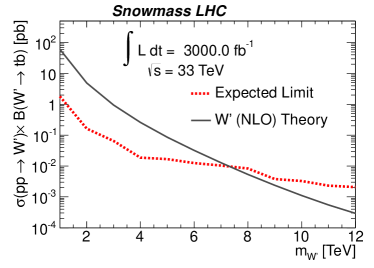
The mass limit at 14 TeV is 3.8 TeV and 4.4 TeV for 300 and 3000 luminosity, respectively. The mass limit at 33 TeV and 3000 luminosity is 7.3 TeV. The expected cross-sections are show at Table 9.
| Mass [TeV] | 14 TeV [pb] | 33 TeV [pb] | |
|---|---|---|---|
| 300 | 3000 | 3000 | |
| 1 TeV | 1.9E+00 | 1.3E+00 | 1.8E+00 |
| 2 TeV | 1.2E-01 | 8.4E-02 | 1.6E-01 |
| 3 TeV | 2.7E-02 | 1.8E-02 | 6.4E-02 |
| 4 TeV | 1.4E-02 | 6.2E-03 | 1.9E-02 |
| 5 TeV | 1.1E-02 | 4.2E-03 | 1.7E-02 |
| 6 TeV | 8.0E-03 | 3.2E-03 | 1.3E-02 |
| 7 TeV | 2.9E-03 | 1.3E-03 | 1.0E-02 |
| 8 TeV | 8.3E-03 | ||
| 9 TeV | 3.8E-03 | ||
| 10 TeV | 3.3E-03 | ||
| 11 TeV | 2.3E-03 | ||
| 12 TeV | 2.1E-03 | ||
V.2 KKg Cross-Section Limits
Fig. 14 shows the cross-section times branching ratio as a function of the mass at 14 TeV and 33 TeV for different luminosities for the analysis.
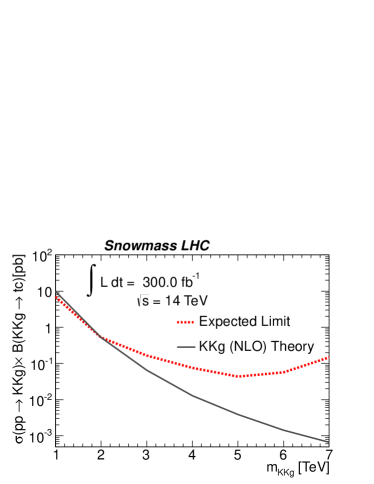
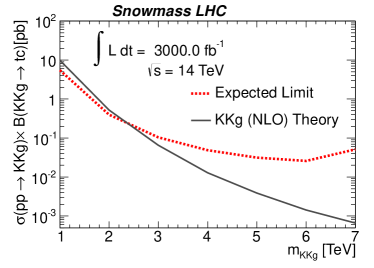
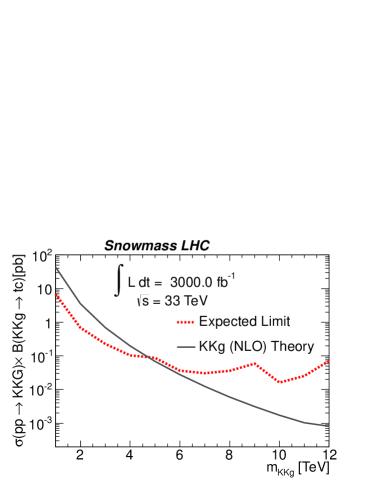
The mass limit for at 14 TeV and 300 luminosity is 2.0 TeV, at 14 TeV and 3000 luminosity is 2.4 TeV, and 33 TeV and 3000 luminosity is 4.7 TeV. The expected cross sections for the analysis are show at Table 10.
| Mass [TeV] | 14 TeV [pb] | 33 TeV [pb] | |
|---|---|---|---|
| 300 | 3000 | 3000 | |
| 1 TeV | 7.0E+00 | 5.5E+00 | 6.9E+00 |
| 2 TeV | 5.2E-01 | 4.0E-01 | 6.8E-01 |
| 3 TeV | 1.7E-01 | 1.0E-01 | 2.3E-01 |
| 4 TeV | 7.5E-02 | 4.9E-02 | 1.0E-01 |
| 5 TeV | 4.3E-02 | 3.1E-02 | 8.8E-02 |
| 6 TeV | 5.7E-02 | 2.6E-02 | 3.7E-02 |
| 7 TeV | 1.5E-01 | 5.1E-02 | 3.0E-02 |
| 8 TeV | 3.6E-02 | ||
| 9 TeV | 5.6E-02 | ||
| 10 TeV | 1.6E-02 | ||
| 11 TeV | 2.5E-02 | ||
| 12 TeV | 7.1E-02 | ||
VI Conclusions
We have presented the possibilities for future searches for beyond the standard model particles at the LHC. The 14 TeV LHC is sensitive to bosons decaying to with right-handed couplings masses up to 3.8 TeV with 300 fb-1 and up to 4.0 TeV with 300 fb-1. A 33 TeV collider can reach masses up to 7 TeV. This will greatly improve the current limit of about 2 TeV set by ATLAS Aad et al. (2012b, 2013) and CMS Chatrchyan et al. (2013).
The sensitivity for FCNC is not as good because the final state only has one quark, leading to large backgrounds. Only for a cross section as large as 40 of the NLO cross-section it will be possible to set limits, and even then only for masses up to 2 TeV at the 14 TeV LHC. The situation is better at a 33 TeV hadron collider which has sensitivity up to 5 TeV for a cross-section that is 40 of the NLO cross-section. At low masses, a 33 TeV hadron collider has sensitivity to with a cross-section of about 5% of the NLO cross-section.
Acknowledgements.
This work was supported in part by the U.S. National Science Foundation under Grants No. PHY-0952729 and PHY-1068318.References
- Aad et al. (2012a) G. Aad et al. (ATLAS Collaboration), Phys.Lett. B716, 1 (2012a), eprint 1207.7214.
- Chatrchyan et al. (2012) S. Chatrchyan et al. (CMS Collaboration), Phys.Lett. B716, 30 (2012), eprint 1207.7235.
- Tait and Yuan (2000) T. M. P. Tait and C. P. Yuan, Phys. Rev. D 63, 014018 (2000), eprint hep-ph/0007298.
- Datta et al. (2000) A. Datta, P. O’Donnell, Z. Lin, X. Zhang, and T. Huang, Phys.Lett. B483, 203 (2000), eprint hep-ph/0001059.
- Perelstein (2007) M. Perelstein, Prog.Part.Nucl.Phys. 58, 247 (2007), eprint hep-ph/0512128.
- Aad et al. (2012b) G. Aad et al. (ATLAS Collaboration), Phys.Rev.Lett. 109, 081801 (2012b), eprint 1205.1016.
- Aad et al. (2013) G. Aad et al. (ATLAS Collaboration), ATLAS-CONF-2013-050 (2013).
- Chatrchyan et al. (2013) S. Chatrchyan et al. (CMS Collaboration), Phys.Rev.B. 718, 1229 (2013), eprint 1208.0956.
- Aquino et al. (2007) P. M. Aquino, G. Burdman, and O. J. Eboli, Phys.Rev.Lett. 98, 131601 (2007), eprint hep-ph/0612055.
- Delaunay et al. (2011) C. Delaunay, O. Gedalia, S. J. Lee, G. Perez, and E. Ponton, Phys.Rev. D83, 115003 (2011), eprint 1007.0243.
- Agashe et al. (2006) K. Agashe, A. Belyaev, T. Krupovnickas, G. Perez, and J. Virzi, Phys. Rev. D. 77, 015003 (2006), eprint 0612015.
- Chivukula et al. (2011) R. S. Chivukula, A. Farzinnia, R. Foadi, and E. H. Simmons, Phys.Rev.D. 85, 054005 (2011), eprint 1111.7261.
- Anderson et al. (2013) J. Anderson, A. Avetisyan, R. Brock, S. Chekanov, T. Cohen, et al. (2013), eprint 1309.1057.
- Alwall et al. (2011) J. Alwall, M. Herquet, F. Maltoni, O. Mattelaer, and T. Stelzer, JHEP 1106, 128 (2011), eprint 1106.0522.
- Sjöstrand et al. (2001) T. Sjöstrand et al., Computer Phys. Commun. 135, 238 (2001), eprint hep-ph/0010017.
- De Favereau J., Delaere C., Demin P., Giammanco A., Lemaître V., Mertens A., Selvaggi M. (2013) De Favereau J., Delaere C., Demin P., Giammanco A., Lemaître V., Mertens A., Selvaggi M. (2013), eprint 1307.6346.
- Avetisyan et al. (2013) A. Avetisyan, J. M. Campbell, T. Cohen, N. Dhingra, J. Hirschauer, et al. (2013), eprint 1308.1636.
- Sullivan (2013) Z. Sullivan (2013), eprint 1308.3797.
- A Cambridge-Aachen based Jet Algorithm for boosted top-jet tagging(2009) (C-A) A Cambridge-Aachen (C-A) based Jet Algorithm for boosted top-jet tagging, cds.cern.ch/record/1194489 (2009).
- M. Cacciari, G.P. Salam and G. Soyez (2008) M. Cacciari, G.P. Salam and G. Soyez, JHEP 04, 63 (2008), eprint arxiv:0802.1189.