SPICA spectroscopic cosmological surveys to unravel galaxy evolution
Abstract
The main energy-generating mechanisms in galaxies are black hole (BH) accretion and star formation (SF) and the interplay of these processes is driving the evolution of galaxies. MIR/FIR spectroscopy are able to distinguish between BH accretion and SF, as it was shown in the past by infrared spectroscopy from the space by the Infrared Space Observatory and Spitzer. Spitzer and Herschel spectroscopy together can trace the AGN and the SF components in galaxies, with extinction free lines, almost only in the local Universe, except for a few distant objects. One of the major goals of the study of galaxy evolution is to understand the history of the luminosity source of galaxies along cosmic time. This goal can be achieved with far-IR spectroscopic cosmological surveys. SPICA in combination with ground based large single dish submillimeter telescopes, such as CCAT, will offer a unique opportunity to do this. We use galaxy evolution models linked to the observed MIR-FIR counts (including Herschel) to predict the number of sources and their IR lines fluxes, as derived from observations of local galaxies. A shallow survey in an area of 0.5 square degrees, with a typical integration time of 1 hour per pointing, will be able to detect thousands of galaxies in at least three emission lines, using SAFARI, the far-IR spectrometer onboard of SPICA.
1 Introduction
One of the major goals of the cosmological studies of galaxy evolution is to understand the full cosmic history of energy generation by stars (through the fusion process) and black holes (through accretion of matter). This history cannot only be retrieved by high luminosity objects, i.e. the quasars, but mainly by low to intermediate luminosity galaxies, such as those objects corresponding to the Seyfert galaxies in the local Universe, which dominate at the knee of the Luminosity Function. The importance of measuring these energy production rates lies also in the fact that these provide a measure of the built up of the mass of the central black hole, on one side, and of galactic stars, on the other side and must–ultimately–be consistent. This will lead us to understand the inter-relation of quasar activity and star formation, and ultimately the key processes responsible for shaping the mass and luminosity functions of galaxies.
Optical continuum measurements alone are completely inadequate to obtain these data and even optical spectroscopy on a massive scale cannot yield definitive answers because dust reddening may block our view at short wavelengths. What is needed therefore is spectroscopy at longer rest wavelengths to uncover how much of this emission is partly or heavily extinguished.
2 Why we need SPICA?
2.1 Comparing different techniques and regimes for separating AGN and SF
No single criteria can be used to distinguish AGN and SF, but there are limits and potentialities of different observational techniques:
– UV/Optical/NIR observations are able to measure galaxy morphology and spectra, however they seriously suffer from dust obscuration.
– X-ray observations are good tracers of AGN, however only weak X-ray emission can be detected from star formation and, even more importantly, heavily-obscured AGN (Compton-thick) are completely lost.
– Radio observations (with planned facilities like EVLA, SKA) can detect AGN and SF to large z and can see through gas and dust, they can measure morphology and spectral energy distributions (SED), detect polarization and variability, however not always redshifts can be measured. At its highest frequencies, SKA could be able to measure redshifted molecular lines in the ISM of galaxies.
– mm/submm observations (e.g. ALMA, CCAT) will provide spectra from SF (redshifted CO, [CII], etc.), however we need to find AGN tracers at the longest FIR wavelengths.
One candidate is CO: spectral line energy distributions (SLED) are in fact different from PDR (SF) and XDR (AGNs).
Another candidate can be OH at 119 m (that at redshift of z 2 gets into the 350 m atmospheric window) that can measure high velocity AGN driven outflows (see, e.g., Fischer et al. 2010; Spoon et al. 2013).
– Rest-frame MIR/FIR imaging spectroscopy can provide a complete view of galaxy evolution by measuring the role of BH and SF because it can (provided that large field of view and high sensitivity can be reached) trace simultaneously both SF and AGN, measure redshifts and see through large amounts of dust. It seems therefore to be the most promising technique.
2.2 The power of infrared spectroscopy
Figure 1-a shows how well the IR fine structure lines cover the density-ionization parameter space which characterizes the photoionized and photon dissociated gas (see, e.g., Spinoglio & Malkan 1992). A combination of these lines and line ratios can trace both star formation and black hole accretion. The long wavelengths of these lines, ranging from the far-IR for the photodissociation and HII region lines through the mid-IR for the AGN lines, to the near-IR for the coronal lines, ensure that we can observe these different tracers by minimizing the effect of dust extinction.
The rich rest-frame mid-IR spectra, that have been recently observed in active and starburst galaxies in the local Universe with the mid-IR spectrometer IRS (Houck et al. 2004) onboard the Spitzer satellite (Werner et al. 2004) can be observed in the far-IR in the redshift range of 0.4z3.0.
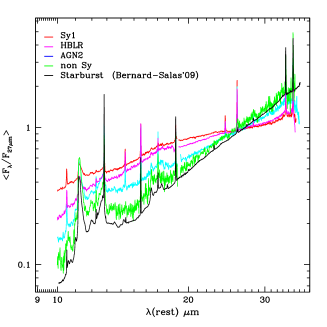
Figure 1-b shows the average Spitzer IRS high-resolution mid-IR spectra (Tommasin et al. 2010) of subclasses of Seyfert galaxies from the the 12m Seyfert galaxy sample of Rush et al. (1993). For comparison, we also show the average spectrum of starburst galaxies (Bernard-Salas et al. 2009). The quality of the data is very high and shows the many features that can distinguish between AGN and star formation processes, such as the high-ionization lines from [NeV] at 14.3m and 24.3m originated exclusively from AGN or the 11.2m PAH feature and the low ionization lines from [NeII] and [SIII], typical of HII and star forming regions. Mid-/far-IR imaging spectroscopy is therefore able to trace galaxy evolution throughout cosmic times in an unbiased way by minimizing dust extinction.
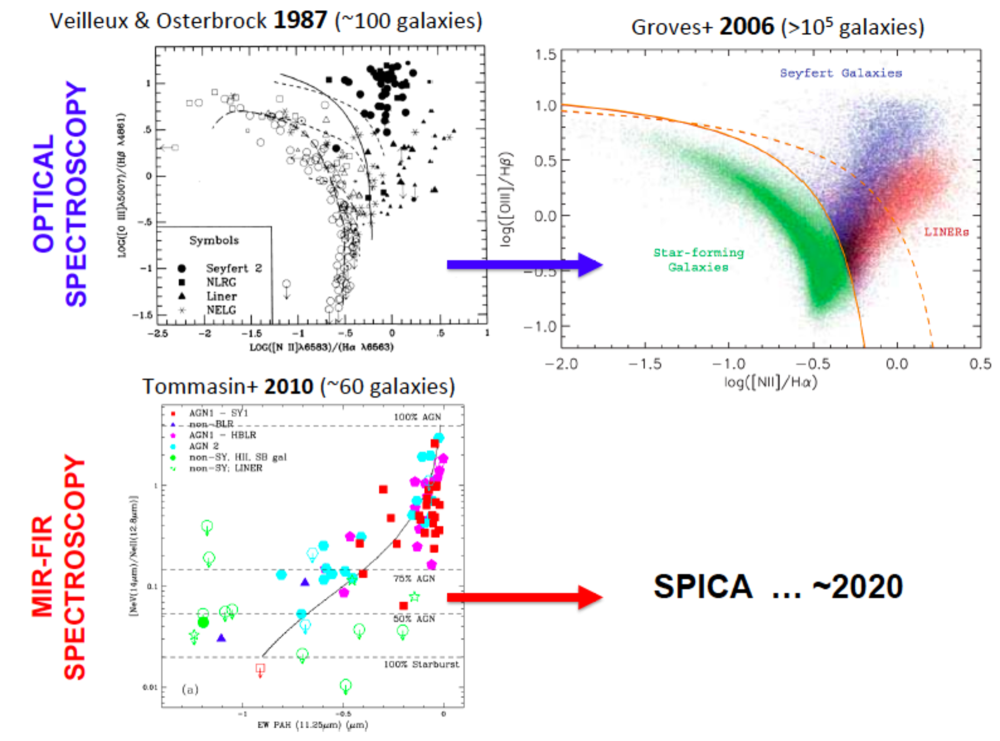
As one can see from the line ratio diagrams in Figure 2, mid-IR and far-IR extragalactic spectroscopy is currently at the same stage as optical spectroscopy more than one decade ago. Due both to the atmospheric absorption, which leaves open only a few sparse windows in the near- and mid-IR, and to the high thermal background at room temperature at IR wavelengths, it has soon been realised that infrared astronomy to be successful had to be done from space telescopes, as it was demonstrated by the success of the IRAS (Neugebauer et al. 1984), ISO (Kessler et al. 1996), Spitzer (Werner et al. 2004), AKARI (Murakami et al. 2007) and finally Herschel (Pilbratt et al. 2010) missions. However, due to the sensitivity limits and the poor multiplexing power of the spectrographs onboard of these spacecrafts, only a few limited samples of distant objects have been successfully observed (e.g. Yan et al. 2007; Menéndez-Delmestre et al. 2009; Sturm et al. 2010), while most of the spectroscopic work has been done in the Local Universe. Substantial progress in studying galaxy evolution therefore can only be achieved by using direct mid- to far-IR spectroscopic surveys, which will provide measured (rather than estimated) redshifts and also unambiguously characterise the detected sources, by measuring the AGN and starburst contributions to their bolometric luminosities over a wide range of cosmological epochs through the spectroscopic signatures of both AGN and star formation emission.
SPICA (Nakagawa et al. 2011) will be the next-generation, space infrared observatory, which, for the first time, will contain a large (3.2-meter) actively cooled telescope (down to 6K), providing an extremely low background environment. With its instrument suite, designed with state-of-the art detectors to fully exploit this low background, SPICA will provide not only high spatial resolution and unprecedented sensitivity in mid- and far-infrared imaging, but especially large field medium spectral resolution imaging spectroscopy. These characteristics put SPICA among the best planned facilities to perform spectroscopic cosmological surveys in the mid- to far-IR. Using theoretical models for galaxy formation and evolution constrained by the luminosity functions observed with both Spitzer and Herschel and the relations between line and continuum far-IR luminosity, as measured in the local Universe for active and starburst galaxies, Spinoglio et al. (2012) have predicted, as a function of redshift, the intensities of key lines able to trace AGN and star formation activity along cosmic history.
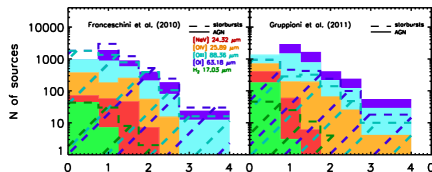
Figure 3 shows graphically the number of galaxies that can be detected by the far-IR FTS spectrometer SAFARI (Roelfsema et al. 2012) planned to be onboard of SPICA, in each spectral line for the two different populations of AGN-dominated and starburst-dominated galaxies, comparing the output of two models used. The total numbers of detectable objects agree, taking the different models, to within a factor of 2-3 for most lines and z ranges. At least a thousand galaxies will be simultaneously detected in four lines at 5 over a half square degree. A survey of the given assumptions will lead to the detection of bright lines (e.g., [O I] and [O III]) and PAH features in thousands of galaxies at z1. Hundreds of z1 AGN will be detected in the [O IV] line, and several tens of z1 sources will be detected in [Ne V] and H2.
On the other hand, the Cerro Chajnantor Atacama Telescope (CCAT) (Sebring 2010) will be highly complementary to SPICA, being able to observe the [OIII]88m line at z 1.3, where this line leaves the SAFARI spectral range. We also find that CCAT will be a most efficient instrument for studies of [CII], an important coolant of the interstellar medium (ISM), at all z 5. At 3 z 4 alone, it will detect more than 300 galaxies at 5 level in a 0.5 deg2 survey (Spinoglio et al. 2012).
3 Conclusions
We summarise this work with these points:
-
-
After many decades of efforts, we are close to having reliable measures of star formation rate and AGN accretion power, through MIR/FIR spectroscopic surveys, unaffected by dust.
-
-
Accurately measuring the star formation rate and the AGN accretion power is the first step towards understanding galaxy evolution over the history of the Universe.
-
-
Blind FIR spectroscopic surveys with SAFARI-SPICA will be the way to physically measure galaxy evolution.
-
-
Given the expected sensitivity of SAFARI-SPICA 2.510-19 W/m2 (5,1 hr.) thousands of sources will be detected in more than 4 lines in typical 0.5 sq.deg. surveys (total t=450 hours).
-
-
Complementary to SAFARI, CCAT will detect several tens to hundreds of galaxies at R1000 in a 0.5 sq. deg. survey in 4.5 hours in the [OIII]88m line and thousands of galaxies in the [CII]158m line.
-
-
These surveys will be essential to clarify the inter-relation between quasar activity and star formation, which of the two processes influence the other and ultimately will test the processes able to shape the mass and luminosity functions of galaxies.
References
- Bernard-Salas et al. (2009) Bernard-Salas, J., et al. 2009, ApJS, 184, 230
- Fischer et al. (2010) Fischer, J., et al. 2010, A&A, 518, L41
- Franceschini et al. (2010) Franceschini, A., Rodighiero, G., Vaccari, M., et al. 2010, A&A, 517, A74
- Groves et al. (2006) Groves, B. A., Heckman, T. M., & Kauffmann, G. 2006, MNRAS, 371, 1559
- Gruppioni et al. (2011) Gruppioni, C., Pozzi, F., Zamorani, G., et al. 2011, MNRAS, 416, 70
- Houck et al. (2004) Houck, J. R., et al. 2004, ApJS, 154, 18
- Kessler et al. (1996) Kessler, M. F., et al. 1996, A&A, 315, L27
- Menéndez-Delmestre et al. (2009) Menéndez-Delmestre, K., et al. 2009, ApJ, 699, 667
- Murakami et al. (2007) Murakami, H., et al. 2007, PASJ, 59, S369
- Nakagawa et al. (2011) Nakagawa, T., Matsuhara, H., & Kawakatsu, Y. 2011, in Space Telescopes and Instrumentation 2012: Optical, Infrared, and Millimeter Wave (SPIE), vol. 8442 of SPIE, 84420O
- Neugebauer et al. (1984) Neugebauer, G., et al. 1984, ApJ, 278, L1
- Pilbratt et al. (2010) Pilbratt, G. L., et al. 2010, A&A, 518, L2
- Roelfsema et al. (2012) Roelfsema, P., et al. 2012, in Space Telescopes and Instrumentation 2012: Optical, Infrared, and Millimeter Wave, vol. 8442 of Society of Photo-Optical Instrumentation Engineers (SPIE) Conference Series
- Rush et al. (1993) Rush, B., Malkan, M. A., & Spinoglio, L. 1993, ApJS, 89, 1
- Sebring (2010) Sebring, T. 2010, in Ground-based and Airborne Telescopes III., vol. 7733 of Society of Photo-Optical Instrumentation Engineers (SPIE) Conference Series
- Spinoglio et al. (2012) Spinoglio, L., Dasyra, K. M., Franceschini, A., et al. 2012, ApJ, 745, 171
- Spinoglio & Malkan (1992) Spinoglio, L., & Malkan, M. A. 1992, ApJ, 399, 504
- Spoon et al. (2013) Spoon, H. W. W., Farrah, D., Lebouteiller, V., et al. 2013, ApJ, 775
- Sturm et al. (2010) Sturm, E., Verma, A., Graciá-Carpio, J., et al. 2010, A&A, 518, L36
- Tommasin et al. (2010) Tommasin, S., Spinoglio, L., Malkan, M. A., & Fazio, G. 2010, ApJ, 709, 1257
- Veilleux & Osterbrock (1987) Veilleux, S., & Osterbrock, D. E. 1987, ApJS, 63, 295
- Werner et al. (2004) Werner, M. W., et al. 2004, ApJS, 154, 1
- Yan et al. (2007) Yan, L., Sajina, A., Fadda, D., et al. 2007, ApJ, 658, 778