1–2
High-resolution spectroscopy of a giant solar filament
Abstract
High-resolution spectra of a giant solar quiescent filament were taken with the Echelle spectrograph at the Vacuum Tower Telescope (VTT; Tenerife, Spain). A mosaic of various spectroheliograms (H, H Å and Na D2) were chosen to examine the filament at different heights in the solar atmosphere. In addition, full-disk images (He i 10830 Å and Ca ii K) of the Chromspheric Telescope and full-disk magnetograms of the Helioseismic and Magnetic Imager were used to complement the spectra. Preliminary results are shown of this filament, which had extremely large linear dimensions (740′′) and was observed in November 2011 while it traversed the northern solar hemisphere.
keywords:
Sun: filaments, Sun: chromosphere, Sun: photosphere, techniques: spectroscopic, techniques: high angular resolution1 Introduction
Filaments are large structures observed in the solar corona or chromosphere. On the disk, they are seen as elongated dark features whereas above the limb they appear bright against the dark background and are called prominences. They have been observed for many centuries and are largely classified into two groups: quiescent (QS) filaments and active region (AR) filaments. The so-called polar crown filaments are long QS filaments that lie at high latitudes () and usually form a crown around the pole (Cartledge et al., 1996). The observed filament in this work does not fit into the scheme of a polar crown filament. It is rather a QS filament which is particularly interesting owing to its large linear dimensions and its location across the northern solar disk. In the literature, only a few examples of giant QS filaments are found (e.g., Yazev & Khmyrov, 1988).
2 Observations
The ground-based observations of the filament were acquired in 2011 November 15 with the Echelle spectrograph at the VTT. The good seeing conditions made it possible to scan with the slit the whole filament along the northern hemisphere of the Sun. The observing strategy was to divide the filament into ten pieces. For each piece the scanned area was and consecutive scans slightly overlapped to assure the continuity of the filament and to facilitate the subsequent reconstruction of the mosaic. The whole filament was scanned between 11:38 UT and 13:11 UT, starting at heliographic coordinates (59∘ E, 48∘ N) and ending at (14∘ W, 18∘ N). The filament extends roughly 740′′ (536 Mm) from solar East to West.
Two CCD cameras were mounted at the Echelle spectrograph to acquire two different spectral regions. The first one was centered at the chromospheric H line at 6562.8 Å and spanned a spectral range of 8 Å. The second region was centered at the Na D2 line at 5889.9 Å and covered a spectral range of 7 Å.
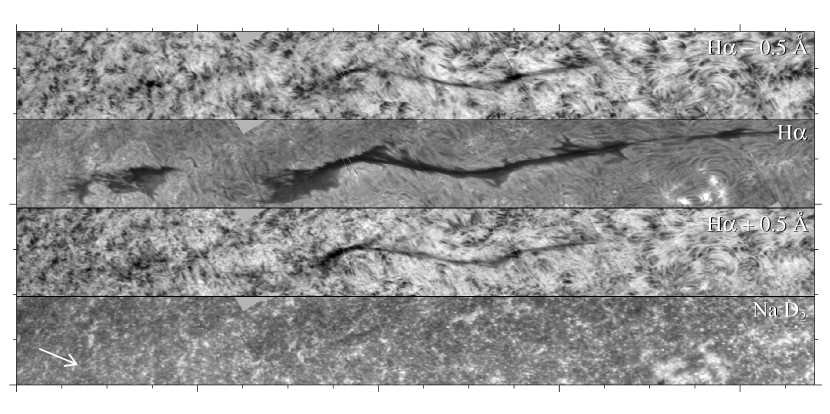
In addition, full-disk images of the Chromospheric Telescope (ChroTel; Bethge et al., 2011) attached to the VTT building were used for this study. ChroTel acquires images at several wavelengths (H, He i 10830 Å and Ca ii K) with a cadence of 3 min. Furthermore, full-disk magnetograms of the Helioseismic and Magnetic Imager instrument (HMI; Schou et al., 2012) were used to complement the spectra. The magnetograms confirm that the filament lies on top of the polarity inversion line (PIL). Positive (negative) polarity is above (below) the filament as shown in Fig. 1.
3 Results
The filament with extraordinary linear dimensions shows a gap on the left hand side in the H panel of Fig. 1. A few hours before, plasma was removed from that side by a coronal mass ejection (CME). However, thin threads appear to link both ends of the separated filament. Barbs, i.e., groups of thin threads that protrude from the side of the main body of the filament (e.g., Martin, 1998), are detected. The spine of the filament is also seen at H Å. In these areas the H line is extremely broad. Very little absorption at the filament can be seen in the Na D2 line core panel.
Acknowledgements.
CK greatly acknowledges the travel support received from the IAU. CD was supported by grant DE 787/3-1 of the German Science Foundation (DFG). MV thanks the German Academic Exchange Service (DAAD) for its support in the form of a PhD scholarship.References
- Bethge et al. (2011) Bethge, C., Peter, H., Kentischer, T. J., et al. 2011, Astron. Astrophys 534, A105
- Cartledge et al. (1996) Cartledge, N. P., Titov, V. S., & Priest, E. R. 1996, Solar Phys. 166, 287
- Martin (1998) Martin, S. F. 1998, Solar Phys. 182, 107
- Schou et al. (2012) Schou, J., Scherrer, P. H., Bush, R. I., et al. 2012, Solar Phys. 275, 229
- Yazev & Khmyrov (1988) Yazev, S. A., & Khmyrov, G. M. 1988, Adv. Space Res. 8, 199