Angular analysis of the decay and studies of mixing and violation in the system with the ATLAS detector
Abstract
The measurement of B meson decay properties provides an alternative approach for searches for physics beyond the Standard Model. We present two different measurements performed with data taken in 2011 with the ATLAS detector at the Large Hadron collider. The first measurement is based on an angular analysis of the decay , and in the second measurement the decay width difference and the weak phase of the system is determined using the decay . For the second measurement a probability for the flavour quantum number of the -quark at production time is determined.
1 Introduction
With the discovery of the Higgs boson the Standard Model of Particle Physics is complete with all expected particles being observed. However, we know that the Standard Model is not enough to describe all phenomena of nature. The most striking example might be the absence of a description of gravity. Theses shortcomings clearly point to the existence of, until now undiscovered, physics beyond the Standard Model. At the Large Hadron Collider (LHC) at CERN two orthogonal approaches are currently being pursued. Particles from physics beyond the Standard Model can be produced at processes with large momentum transfer and subsequently observed directly in the detector. Alternatively particles from physics beyond the Standard Model can shortly appear in quantum loops and shape the outcome of the process without being directly observed. In physics with B mesons involved rare processes, together with a very precise prediction from Standard Model calculations, offer such an alternative search path.
In this paper we present the analysis of two different B meson decays, based on data taken with the ATLAS detector [1] at the LHC in the year 2011. First an angular analysis of the decay is discussed and a measurement of the longitudinal polarisation and the forward-backward asymmetry is presented [2]. This analysis is followed by a measurement of the decay width difference and the weak phase of the using the decay [3].
2 The ATLAS detector and the data sample
The measurements presented in this paper are performed with data taken with the ATLAS detector [1] in 2011. Overall of data are collected at a centre-of-mass energy of 7 TeV with a maximum luminosity of about s-1. The main trigger used to select events of interest is based on the observation of two muons in the final state, with the invariant mass of the di-muon pair being within a certain mass range.
2.1 Detector Performance
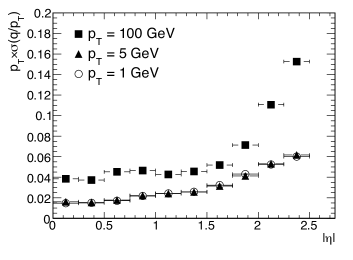
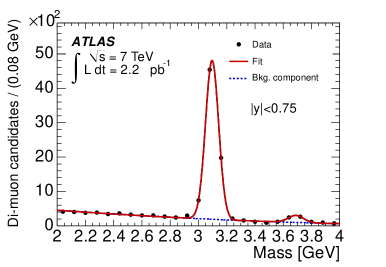
The measurements performed for these analyses are mainly based on information taken with the inner detector (ID), the main tracking device of the detector, and the muon spectrometer (MS), the sub-detector responsible for identifying muons in the event. The ID is used to reconstruct the trajectories of charged particles in order to determine their momentum and their impact parameter with respect to the interaction point in the plane transverse to the beam line. The measurement of the impact parameter is of interest in order to reconstruct the lifetime of weakly decaying B hadrons. The expected impact parameter resolution, determined with simulated events, is shown in Figure 1. The momentum measurement is needed to determine the invariant mass of a decaying hadron in order to separate signal from background events. As an example the mass resolution of a is shown in Figure 1. The mass resolution obtained for reconstructed in the central barrel region is MeV. The ATLAS detector contains no dedicated sub-detector to distinguish between charged kaons and pions for most momenta, leading to a worse signal to noise ratio for fully reconstructed B meson decays, compared to experiments with dedicated particle identification.
3 Measurement of the angular distribution in the decay
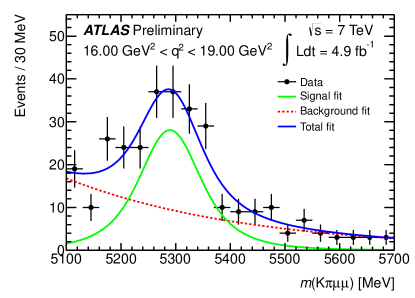
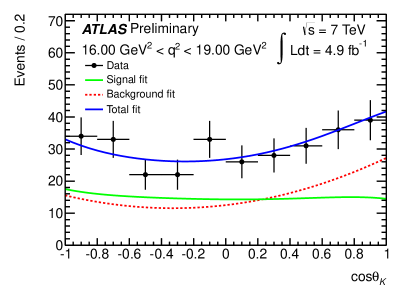
The semi-rare decay of a into a and a muon pair takes place via a loop diagram, including a second order transition from a b-quark to a s-quark. The decay can be described by four kinematic variables, , the invariant mass of the di-muon pair and three angles of the four-body final state. Contributions from physics beyond the Standard Model could alter the decay amplitude as well as the distribution of the kinematic variables. A full description of the analysis summarised here can be found at [2]. The branching ratio of this decay channel is in the order of and, in the invariant mass region between MeV m(K) MeV, the estimated number of signal events amounts to with background events. Events are selected with a cut based selection procedure, optimised on simulated events. Events with a value consistent with a muon pair from a or a decay are excluded. The data set is subdivided in five different regions (see Table 1) and the relative small signal yield for each of these regions does not allow a full angular analysis using all three decay angles. For this reason two out of the three angles are integrated out. In this analysis two differential decay distributions are used: the differential decay rate with respect to the angle , the angle between between the and the and the opposite direction of the in the di-muon rest frame and the differential decay rate with respect to the angle , the angle between the and the opposite direction of the in the rest frame. These differential decay rates are then used to determine, with an unbinned maximum likelihood fit, the longitudinal polarisation of the , , and the forward backward asymmetry of the di-muon system, . A sequential approach is used, where first the number of signal and background events is determined with a fit to the invariant mass distribution, followed by a fit to the angular distributions, with the number of signal and background events being fixed to the values obtained from the fit to the invariant mass. The measured angular decay distribution is corrected for acceptance effects using Monte Carlo events with the response of the detector fully simulated. Possible distortions originating from interchanging the kaon and the pion in the decay are taken into account. The invariant mass and the distribution for events with a value between GeV2 and GeV2 are shown in Figure 2.
Several sources of systematic uncertainties are studied. The sequential fit approach only introduces a significant uncertainty for very small event samples. In the region between GeV2 and GeV2 only events are selected, leading to the sequential fit procedure being the dominant systematic uncertainty. In the other regions misidentified events tend to dominate the measurement and the acceptance correction procedure the measurement. The overall uncertainty is dominated by the statistical uncertainty. A summary of the number of signal events together with the longitudinal polarisation and the forward backward asymmetry for the different regions is presented in Table 1.
| range (GeV2) | |||
|---|---|---|---|
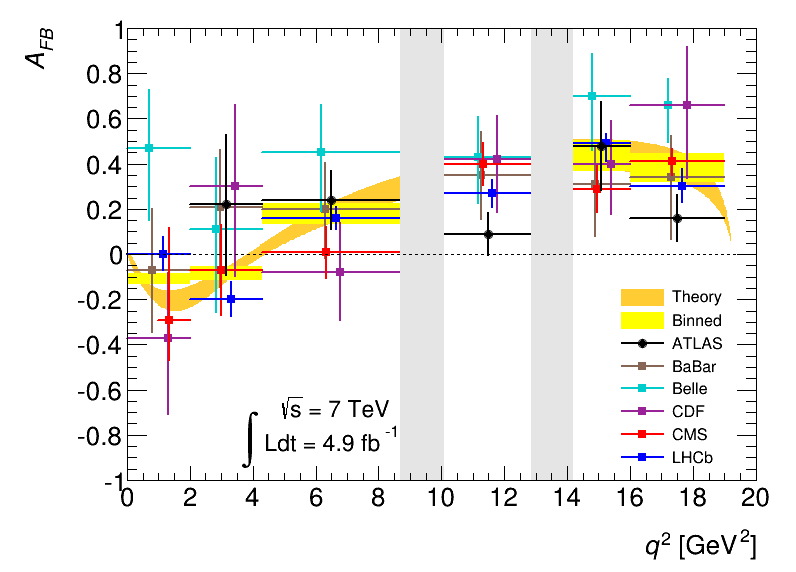
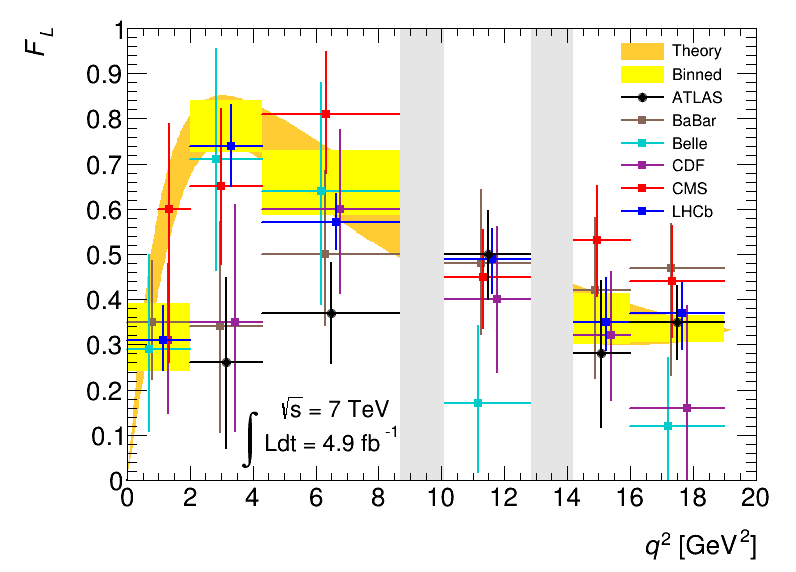
A graphical presentation of this measurement, together with results obtained by other collaborations, is summarised in Figure 3. In general, all measurements are consistent with the theoretical prediction obtained from the Standard Model. The ATLAS results are most competitive in the high region, both for and . Using the data sample already collected with the ATLAS experiment in 2012 and applying an optimised selection procedure with dedicated cuts in the high region, data taken with the ATLAS experiment have the opportunity to contribute significantly to this measurement. We also expect an enhanced number of selected events due to an improved triggering and delayed processing scheme in 2012.
4 Measurement of and in the decay
Contributions from physics beyond the Standard Model can also modify the decay parameters and in particular the violating phase . In this decay violation occurs in the interference of neutral mixing and the subsequent decay. The Standard Model predicts very small violating effects in this decay and any measurement of significant violation would be a clear sign for physics beyond the Standard Model. With a time dependent angular analysis of the decay the angle of the unitarity triangle can be measured, with almost being identical to the violating phase . A measurement of and the decay width difference , without identifying the flavour quantum number of the -quark at production time (untagged), was published recently in [6]. Here we present an update of this measurement, including an additional identification of the the -quark flavour quantum number at production. A detailed summary of this analysis can be found at [3].
4.1 Determination of the -quark quantum flavour number at production time
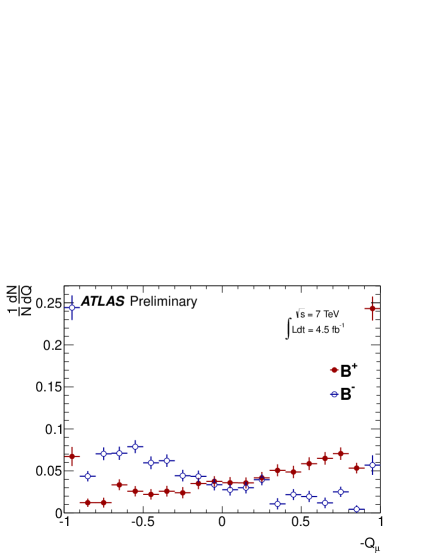
The event selection, as well as the unbinned maximum likelihood fit to determine the decay parameters, follows closely the procedure published in [6]. For the determination of the -quark flavour quantum number of the , two different tagging methods are used. Both methods are based on the so-called opposite tagging technique (OST), which takes advantage of the fact that -quarks are produced via the strong interaction and the production of a b-quark is always accompanied by the production of a -quark. The tagging algorithm identifies, besides the fully reconstructed signal decay, a second -quark decay. The production of a b or is distinguished by either calculating the muon cone charge , using tracks around the lepton from the leptonic -quark decay, or, in case of hadronic decay, using a jet charge , calculated from tracks associated with the opposite -quark decay. For calibration of the OST method the self-tagging decay is used, where the charge of the kaon identifies the flavour quantum number of the -quark at production. As an example Figure 4 shows the muon cone charge determined separately for events with a reconstructed or decay. The determined value of shows a clear dependence on the B meson flavour quantum number, indicating the tagging capabilities of the method.
The combined OST methods reach a tagging efficiency of and a dilution of , leading to a overall tagging power of , with the uncertainty reflecting the statistical uncertainty only.
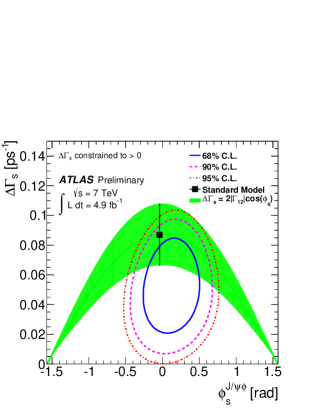
The invariant mass and the lifetime of the reconstructed candidate, together with their uncertainty, are used in an unbinned maximum likelihood fit. The content of the vector-vector final state is determined by the angular distribution of the final state and is included in the fit as well. The fit is completed using the candidate-by-candidate probability of the quark produced was a b or a -quark determined with OST. The main parameters returned from the fit are ps-1 and . The systematic uncertainty for is dominated by using an uncorrelated description of the angles from background events in the default fit. For the weak phase the dominant uncertainty is associated with the OST; that is largely statistical in nature. The correlation between the two parameters is shown in Figure 4. The result obtained is consistent with the prediction expected from the Standard Model. The statistical uncertainty on the measurement of decreased by almost , compared to the measurement without using information of the -quark flavour quantum number. The mean values and the uncertainty of all other observables did not change with the use of the tagging information.
References
- [1] ATLAS Collaboration, JINST 3 (2008) S08003.
- [2] ATLAS Collaboration, ATLAS-CONF-2013-038, http://cds.cern.ch/record/1537961.
- [3] ATLAS Collaboration, ATLAS-CONF-2013-039, http://cds.cern.ch/record/1541823.
- [4] ATLAS Collaboration, Nucl. Phys. B 850 (2011) 387.
- [5] The figures containing a summary of currently available measurements are provided by Patrick Jussel.
- [6] ATLAS Collaboration, JHEP 1212 (2012) 072.