11email: kohnaka@mpifr.de
High spectral resolution spectroscopy of the SiO fundamental lines in red giants and red supergiants with VLT/VISIR ††thanks: Based on VISIR observations made with the Very Large Telescope of the European Southern Observatory. Program ID: 087.D-0522(A)
Abstract
Context. The mass-loss mechanism in red giants and red supergiants is not yet understood well. The SiO fundamental lines near 8 m are potentially useful for probing the outer atmosphere, which is essential for clarifying the mass-loss mechanism. However, these lines have been little explored till now.
Aims. We present high spectral resolution spectroscopic observations of the SiO fundamental lines near 8.1 m in 16 bright red giants and red supergiants. Our sample consists of seven normal (= non-Mira) K–M giants (from K1.5 to M6.5), three Mira stars, three optically bright red supergiants, two dusty red supergiants, and the enigmatic object GCIRS3 near the Galactic center.
Methods. Our program stars were observed between 8.088 and 8.112 m with a spectral resolution of 30 000 using VLT/VISIR.
Results. We detected SiO fundamental lines in all of our program stars except for GCIRS3. The SiO lines in normal K and M giants as well as optically bright (i.e., not dusty) red supergiants do not show P-Cyg profiles or blueshifts, which means the absence of systematic outflows in the SiO line forming region. On the other hand, we detected P-Cyg profiles in the SiO lines in the dusty red supergiants VY CMa and VX Sgr, with the latter being a new detection. These SiO lines originate in the outflowing gas with the thermal dust continuum emission seen as the background. The outflow velocities of the SiO line forming region in VY CMa and VX Sgr are estimated to be 27 and 17 km s-1, respectively. We derived basic stellar parameters (effective temperature, surface gravity, luminosity, and mass) for the normal K–M giants and optically bright red supergiants in our sample and compared the observed VISIR spectra with synthetic spectra predicted from MARCS photospheric models. Most of the SiO lines observed in the program stars warmer than 3400 K are reasonably reproduced by the MARCS models, which allowed us to estimate the silicon abundance as well as the 28Si/29Si and 28Si/30Si ratios. However, we detected possible absorption excess in some SiO lines. Moreover, the SiO lines in the cooler red giants and red supergiant cannot be explained by the MARCS models at all even if the dust emission is taken into account. This disagreement may be a signature of the dense, extended molecular outer atmosphere.
Key Words.:
infrared: stars – techniques: spectroscopic – stars: AGB, post-AGB – stars: late-type – stars: atmospheres – stars: fundamental parameters| # | Name | Sp. Type | D.E.C. | Seeing | Airmass | Int. time | Calibrator | Remarks | ||
| (km s-1) | (UTC) | (″) | (sec) | |||||||
| K–M giants | ||||||||||
| 1 | Boo | K1.5III | 0.0 | 03:44:15 | 0.72 | 1.49 | 180 | C8 | ||
| 2 | Cru | M3.5III | 0.0 | 01:53:35 | 1.15 | 1.24 | 180 | C4 | ||
| 3 | Lib | M3/M4III | 0.0 | 06:24:15 | 0.71 | 1.01 | 180 | C6 | ||
| 4 | V806 Cen | M4.5III | 0.01 | 02:08:55 | 1.39 | 1.20 | 180 | C4 | ||
| 5 | Mus | M5III | 04:28:15 | 0.90 | 1.42 | 180 | C5 | |||
| 6 | L2 Pup | M5III | 0.60 | 00:16:55 | 0.88 | 1.20 | 180 | C1 | ||
| 7 | Aps | M6.5III | 0.29 | 02:56:55 | 1.16 | 1.70 | 600 | C4 | ||
| Red supergiants | ||||||||||
| 8 | Ori | M2Iab | 0.25 | 00:00:55 | 0.97 | 1.86 | 180 | C3 | ||
| 9 | Sco | M1.5Iab-b | 0.06 | 05:19:35 | 0.91 | 1.12 | 180 | C6 | ||
| 10 | Her | M5Ib-II | 07:36:15 | 0.59 | 1.30 | 180 | C8 | |||
| 11 | VY CMa | M2.5-5Iae | 25 | 01:10:15 | 0.98 | 1.31 | 180 | C2 | ||
| 12 | VX Sgr | M4Ia-10eIa | 0.73 | 06:39:35 | 0.84 | 1.17 | 180 | C6 | ||
| Mira stars | ||||||||||
| 13 | R Aql | M5-9e | 0.36 | 07:50:15 | 0.63 | 1.40 | 180 | C8 | phase = 0.18 | |
| 14 | R Hya | M6-9eS | 0.24 | 05:49:35 | 0.83 | 1.07 | 180 | C6 | phase = 0.44 | |
| 15 | W Hya | M7.5-9ep | 0.10 | 02:41:35 | 1.34 | 1.11 | 180 | C5 | phase = 0.14 | |
| Unknown nature | ||||||||||
| 16 | GCIRS3 | — | — | 07:10:55 | 0.66 | 1.05 | 600 | C7 | ||
| Calibrators | ||||||||||
| C1 | Car | F0II | — | — | 23:44:15 | 0.99 | 1.30 | 180 | ||
| C2 | CMi | F5IV-V | — | — | 00:32:15 | 0.85 | 1.37 | 540 | ||
| C3 | CMi | F5IV-V | — | — | 01:26:55 | 1.09 | 1.69 | 540 | ||
| C4 | Cen A | G2V | — | — | 02:27:35 | 0.68 | 1.48 | 180 | ||
| C5 | Cen A | G2V | — | — | 03:20:55 | 0.73 | 1.35 | 180 | ||
| C6 | Cen A | G2V | — | — | 05:34:15 | 0.75 | 1.24 | 180 | ||
| C7 | Cen A | G2V | — | — | 06:54:15 | 0.71 | 1.29 | 180 | ||
| C8 | Aql | A7V | — | — | 08:04:55 | 0.66 | 1.48 | 1400 | ||
1 Introduction
The mass loss in red giants and red supergiants is a long-standing problem in stellar astrophysics. The combination of the large-amplitude stellar pulsation and the momentum transfer from radiation to dust is often believed to be responsible for the mass loss (see, e.g., Höfner hoefner11 (2011) for recent review). However, as Höfner (hoefner11 (2011)) notes, there are stars with stellar parameters outside the range for this “pulsation-enhanced dust-driven wind scenario”, for example, stars with much smaller pulsation amplitudes and/or with no or little dust. This suggests that we may not yet understand major physical processes responsible for driving mass outflows in red giants and red supergiants in general.
For understanding the mass-loss mechanism, it is essential to study the region between the photosphere and the innermost region of the circumstellar envelope, where the wind acceleration takes place. SiO is one of the important molecules in the atmosphere and circumstellar envelope of oxygen-rich cool evolved stars. Hinkle et al. (hinkle76 (1976)) revealed significant time variations in the SiO first overtone bands near 4 m in Mira stars. The SiO first overtone bands have also been used for testing the model atmospheres of red giants (e.g., Aringer et al. aringer99 (1999); Lebzelter et al. lebzelter01 (2001)). Tsuji et al. (tsuji94 (1994)) determined the elemental abundance of silicon as well as its isotope ratios in M giants and M supergiants from high resolution spectra of the SiO first overtone lines. Their analysis also reveals that while the weak and moderate SiO lines can be explained well by the hydrostatic photospheric models, the strong SiO lines in the latest M giants (M7–8III) show excess emission originating in an extended outer atmosphere. This extended outer atmosphere—the so-called MOLsphere (Tsuji 2000b )—cannot be accounted for by hydrostatic photospheric models. The presence of the MOLsphere in normal (= non-Mira) K–M giants, Mira stars, as well as red supergiants has been confirmed by IR spectroscopic and interferometric observations of molecules such as CO and H2O (e.g., Tsuji et al. tsuji97 (1997); Tsuji 2000a , 2000b , tsuji01 (2001); Perrin et al. 2004a , 2004b , perrin05 (2005); Wittkowski et al. wittkowski07 (2007), wittkowski08 (2008), wittkowski11 (2011); Woodruff et al. woodruff08 (2008), woodruff09 (2009); Le Bouquin et al. lebouquin09 (2009); Martí-Vidal marti-vidal11 (2011); Ohnaka 2004a , 2004b , ohnaka12 (2012), ohnaka13 (2013); Ohnaka et al. ohnaka11 (2011), ohnaka13alfsco (2013)).
The current MOLsphere models consist of “ad hoc” layers placed above the photosphere, and the density, temperature, and radius of the extended molecular outer atmosphere are determined to fit observed data. On the other hand, dynamical model atmospheres have been developed for Mira stars (e.g., Ireland et al. ireland11 (2011); Bladh et al. bladh13 (2013)), which predict the density and temperature distribution, as well as molecular abundances in the outer atmosphere in a self-consistent manner. Such models can be confronted with observed spectra. Unfortunately, dynamical model atmospheres for normal red giants and red supergiants, whose variability amplitudes are much smaller than in Mira stars, have been less studied. Probing the physical properties of the outer atmosphere using the ad hoc models is useful for gleaning information about the as-yet-unidentified physical process responsible for forming the extended molecular outer atmosphere.
The SiO fundamental lines near 8 m are one of the ideal probes to study the physical properties of the outer atmosphere and the innermost circumstellar envelope. Geballe et al. (geballe79 (1979)) observed the SiO fundamental lines in the dusty red supergiant VY CMa with a spectral resolution of 13000. They discovered SiO lines with the P-Cyg profile originating in an expanding circumstellar envelope. The SiO lines with the P-Cyg profile in VY CMa were also detected much later by Richter et al. (richter01 (2001)) with a higher spectral resolution of 100 000. Keady & Ridgway (keady93 (1993)) detected weak, blueshifted SiO lines in the dusty carbon star IRC+10216 originating in the inner envelope. These studies suggest that the SiO fundamental lines are potentially useful for probing the outer atmosphere and the innermost circumstellar envelope. However, there are only few high resolution spectroscopic studies of the SiO fundamental lines in red giants and red supergiants in the literature. In this paper, we present the results of high resolution spectroscopic observations of the poorly explored SiO fundamental lines in a sample of red giants and red supergiants with VLT/VISIR.
2 Observations
2.1 Sample
Our sample consists of seven normal (= non-Mira-type) K–M giants, three Mira stars, five red supergiants, and the enigmatic object toward the Galactic center GCIRS3. We selected these stars to cover a range of the spectral type, luminosity class, and variability, in order to systematically study the dependence of the SiO lines on the stellar parameters. As summarized in Table LABEL:obslog, seven K–M giants in our sample cover the spectral type from K1.5III to M6.5III. All of these stars except for L2 Pup and Aps show no or very little dust, as shown by the dust emission contrast (D.E.C.), which is defined as the ratio of the dust emission to the emission from the star integrated over the spectral range between 7.67 and 14.03 m (Sloan & Price sloan98 (1998)). The D.E.C values in Table LABEL:obslog were taken from Sloan & Price (sloan98 (1998)) except for Boo, Cru, and VY CMa, which are not included in their list. We estimated the D.E.C. values of Boo and Cru to be zero based on the absence of an IR excess up to 1000 m (Dehaes et al. dehaes11 (2011)). We estimated the D.E.C value of VY CMa from the model fitting of the spectral energy distribution presented by Harwit et al. (harwit01 (2001)). The negative D.E.C. values for Mus and Her from Sloan & Price (sloan98 (1998)) probably result from the uncertainty in defining the stellar continuum. We interpret them as showing no dust emission. Our sample includes three Mira stars, R Hya, R Aql, and W Hya. While the last star is classified as a semiregular variable on Simbad, it is often regarded as Mira-like because its variability amplitude is larger than usual semiregular variables, and it shows clear periodicity (e.g., Woodruff et al. woodruff09 (2009); Zhao-Geisler et al. zhao-geisler11 (2011)). The variability phase at the time of our VISIR observations was estimated from the light curves available at the American Association of Variable Star Observers (AAVSO). The red supergiants in our sample consist of three optically bright stars ( Ori, Sco, and Her) and two dusty stars (VY CMa and VX Sgr). The nature of the last object in our sample, GCIRS3, is not clear yet. Based on high spatial resolution mid-IR observations, Pott et al. (pott08 (2008)) suggest that it may be a dust-enshrouded carbon star, despite the strong silicate absorption at 10 m. We included this object, because some molecular lines may reveal the nature of the object.
2.2 VLT/VISIR observations and data reduction
We observed our program stars on 2011 April 19 between 8.088 and 8.112 m with VLT/VISIR (Lagage et al. lagage04 (2004)). We used the high resolution long-slit (HR) mode with a slit width of 04, which resulted in a spectral resolution 30 000. We selected this spectral window, because it is not severely affected by the telluric lines, except for the strong ones at 8.091 and 8.107 m. A summary of the observations of the science targets and the calibrators is given in Table LABEL:obslog. The data were reduced with the VISIR pipeline ver3.0.0 provided by ESO (Lundin et al. lundin08 (2008)). The output of the pipeline reduction is the 1-D spectra of the targets. The wavelength calibration was carried out using the telluric lines. The uncertainty in the wavelength calibration is m (2.6 km s-1). The telluric lines were removed by dividing the spectra of the science targets with those of the calibrators. In most cases, we used the calibrators that were observed before or after the science target within 0.5–1 hour at similar airmasses (difference smaller than 0.2) . In the case of Boo, it was necessary to use the calibrator observed with a time interval as long as 4.5 hours. In either case, however, the strong telluric lines at 8.091 and 8.107 m could not be removed well, and therefore, we excluded these wavelengths from the analysis. The spectra are normalized by the local continuum level defined by the highest flux points in the observed spectral window. Because most of our program stars are very bright, we achieved S/N ratios of 100–200. The exception is GCIRS3, on which we achieved an S/N ratio of only 20.
We converted the wavelength scale to the heliocentric frame and then to the laboratory frame. The heliocentric systemic velocities of our program stars are listed in Table LABEL:obslog with the uncertainties. We took the systemic velocities measured by radio CO observations in the literature if available (references are also listed in the table). The systemic velocities derived from the CO lines originating in the expanding circumstellar envelope are not subject to atmospheric motions induced by pulsation and/or convection, which can affect the determination of the systemic velocity using spectral lines in the visible. In case velocities derived from different radio CO lines are available, we took the mean of the velocities and adopted a half of the maximum and minimum velocities as the uncertainty. For Boo, Cru, Lib, V806 Cen, Mus, Sco, and Her, no radio CO observations are available. For these stars, we took the radial velocities from Gontcharov (gontcharov06 (2006)), which were derived from spectral lines in the visible. These data represent the systemic velocity well for K and early/mid-M giants whose variability amplitude is small. For example, the time variation in the radial velocity in Boo and Cru is and km s-1, respectively (Hatzes & Cochran hatzes93 (1993); Murdoch et al. murdoch92 (1992)). No radial velocity monitoring is available in the literature for Lib, V806 Cen, and Mus. Therefore, for these stars, we adopted the same uncertainty of km s-1 as in Cru.
On the other hand, the visible spectral lines in the red supergiants Sco and Her show time variations in the radial velocity of up to 10 km s-1 due to the atmospheric motions (Smith et al. smith89 (1989)). We adopted these time variations as the uncertainty in the systemic velocity of Sco and Her. While Sco and Her both have binary companions, the effect of the orbital motion on the radial velocity is much smaller compared to the time variations due to the atmospheric motions for the following reason. The red supergiant Sco A has a B2.5V companion. Using the binary parameters presented in Braun et al. (braun12 (2012)), we estimated the orbital velocity of Sco A to be 2 km s-1, which is much smaller than 10 km s-1. The system Her includes the red supergiant Her and a secondary ( Her) with a separation of 46, which corresponds to 504 AU at a distance of 110 pc (from the Hipparcos parallax, van Leeuwen vanleeuwen07 (2007)). The secondary Her itself is a spectroscopic binary with a G8III star ( Her A) and an A9IV-V star ( Her B) with a separation of 0.17 AU and a period of 51.6 days (Deutch deutch56 (1956)). Assuming an edge-on circular orbit around the red supergiant Her for this spectroscopic binary and adopting the mass of 2.7, 2.6, and 2.0 for Her, Her A, and Her B, respectively, based on the results of Moravveji et al. (moravveji13 (2013)), the orbital velocity of Her is estimated to be 2 km s-1, which is again much smaller than the 10 km s-1 caused by the atmospheric motions.
For GCIRS3, no radial velocity measurement is available. Therefore, the wavelength scale is converted only to the heliocentric frame.
3 Results
3.1 Optically bright red giants and red supergiants
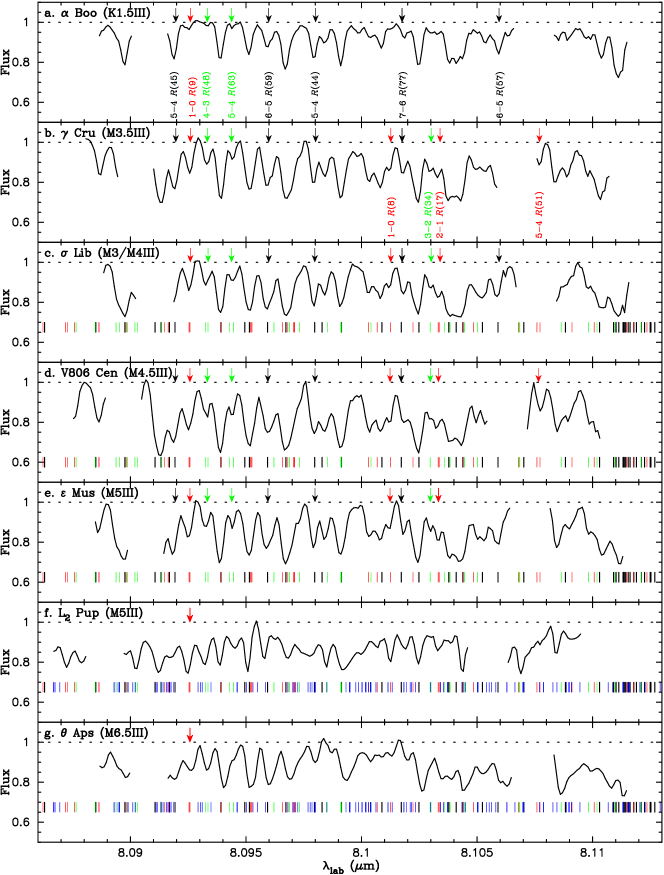
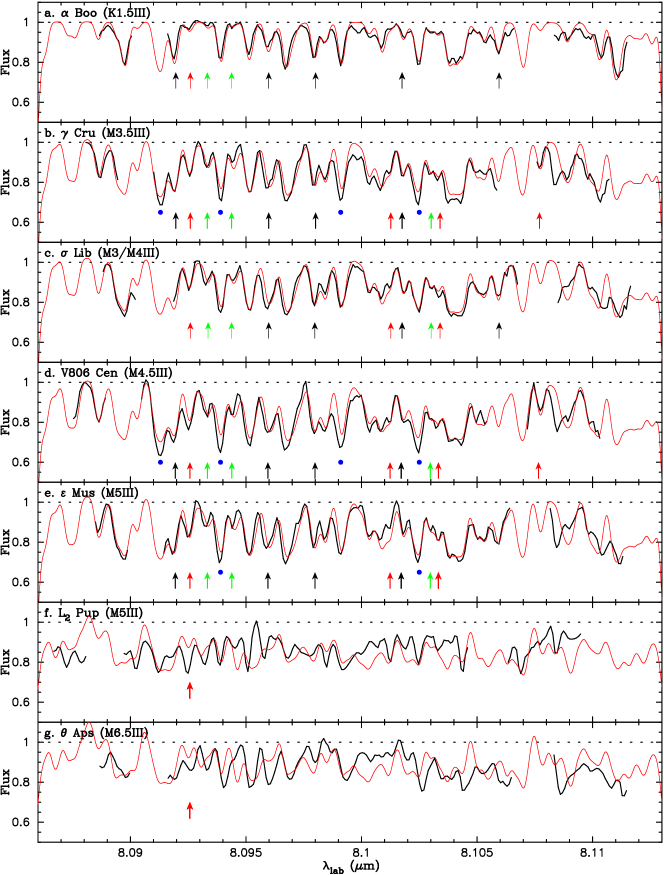
Figure 1 shows the observed spectra of seven normal K–M giants in our sample with the positions of the 28Si16O, 29Si16O, and 30Si16O lines (hereafter simply denoted as 28SiO, 29SiO, and 30SiO), which are taken from the line list recently published by Barton et al. (barton13 (2013)). For the spectra of L2 Pup and Aps, the positions of the H2O lines taken from the line list of Barber et al. (barber06 (2006)) are also plotted. Most of the observed features are blend of different Si isotopes. Several lines that are relatively free from the blend of other species are marked and identified in the figure. In particular, the 29SiO lines at 8.0925 and 8.1077 m, as well as the 30SiO lines at 8.0933 and 8.0944 m are nearly free from the blend of different isotope species. Tsuji et al. (tsuji94 (1994)) derived 28Si/29Si = 14–21 and 28Si/30Si = 20–29 for M5–8 giants from the SiO first overtone lines near 4 m. We estimate the silicon isotope ratios using the observed SiO fundamental lines in Sect. 4.
The SiO lines can already be seen in the K1.5 giant Boo and become stronger in M giants ( Cru, Lib, V806 Cen, and Mus) than in Boo but without clear dependence on the spectral type. The lack of clear correlation between the strengths of the SiO fundamental lines and the spectral type (or effective temperature) is already found in the spectra with lower spectral resolutions (Cohen & Davis cohen95 (1995); Sloan & Price sloan98 (1998); Heras et al. heras02 (2002)). We will return to this point in Sect. 4.2.1, where we compare the observed data with synthetic spectra from hydrostatic photospheric models. The SiO lines become weaker in L2 Pup and Aps compared to the earlier M giants. As the D.E.C. values in Table LABEL:obslog suggest, these two stars show noticeable dust emission, which makes the SiO lines appear weaker. However, as shown in Sect. 4.2.2, the observed spectra of L2 Pup and Aps cannot be explained just by the photospheric models with the dust emission, suggesting the possible effects of the MOLsphere on the SiO fundamental lines.
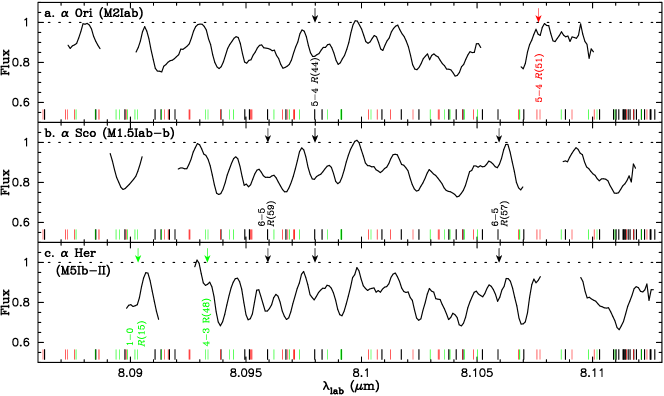
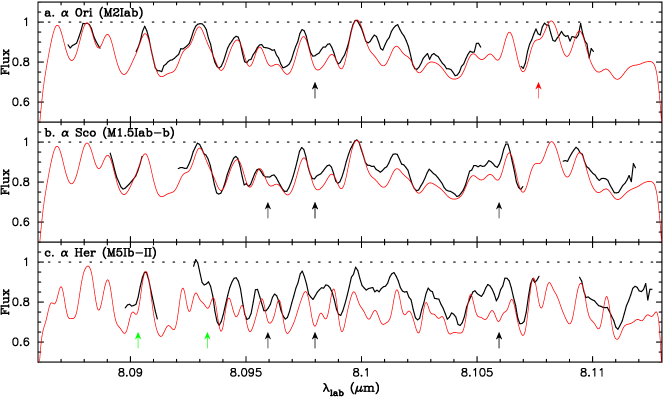
Figure 2 shows the observed spectra of the optically bright red supergiants Ori, Sco, and Her. The SiO lines in Ori and Sco are significantly broader compared to those observed in the K–M giants, reflecting the larger turbulent velocities found in these red supergiants (e.g., Ohnaka et al. ohnaka09 (2009) and references therein).
The observed SiO line positions of the K–M giants and optically bright red supergiants agree well with those from the line list within the uncertainty of the wavelength calibration. No P-Cyg profiles and/or blueshifts, which would be a signature of outflows, were detected. This suggests that the SiO fundamental lines form in the photosphere and also possibly in the MOLsphere, where the material is not yet systematically outflowing.

3.2 Dusty red supergiants
Figure 3 shows the observed spectra of two dusty red supergiants, VY CMa and VX Sgr, which show much more prominent dust emission compared to the red giants and red supergiants discussed above. The observed VISIR spectra reveal the 28SiO line at 8.0952 m ( (3)) with the P-Cyg profile. The mid-IR spectra of these stars are dominated by the dust emission, which is responsible for the continuum. Because the SiO lines originating in the photosphere and MOLsphere are masked by the prominent dust emission, the observed SiO line with the P-Cyg profile originates in the circumstellar envelope. The P-Cyg profile in the SiO line in VY CMa is consistent with what is reported in Richter et al. (richter01 (2001)). On the other hand, the SiO line with the P-Cyg profile has been detected for the first time toward VX Sgr. Richter et al. (richter01 (2001)) report the detection of the P-Cyg profile in the SiO line at 8.1044 m ( (2)) as well. However, the line profile in our spectra of VY CMa and VX Sgr does not indicate the P-Cyg profile as clearly as the SiO line at 8.0952 m. This can be due to the lower spectral resolution () compared to the achieved by Richter et al. (richter01 (2001)).
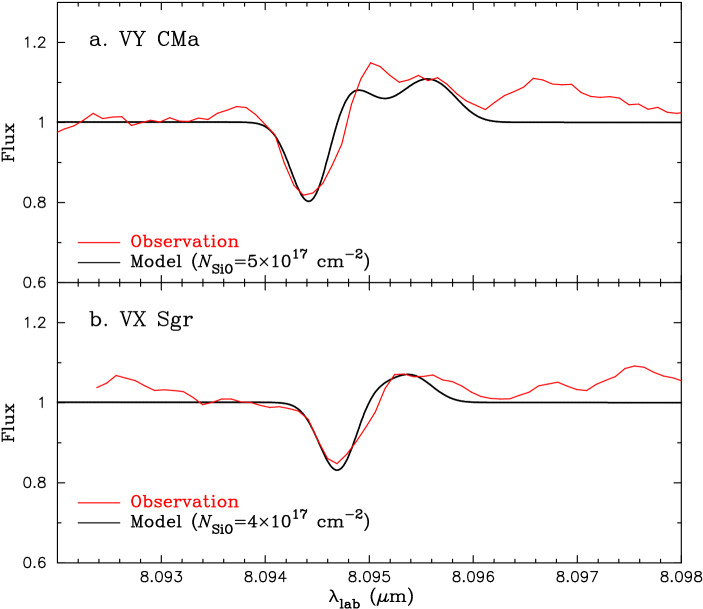
In order to estimate the outflow velocities in VY CMa and VX Sgr, we computed the profile of the SiO line at 8.0952 m using a simple model of a spherically expanding shell with a constant velocity. This model consists of a dust shell, which emits as the blackbody of 1500 K and provides the continuum, and an expanding SiO layer with a temperature of 500 K placed at some distance from the continuum-forming dust layer. The free parameters are the expansion velocity, radius, SiO column density, and microturbulent velocity of the SiO layer. The SiO line profile was computed assuming local thermodynamical equilibrium (LTE). Figure 4 shows a comparison of the predicted and observed line profiles for VY CMa and VX Sgr. The observed P-Cyg profiles of VY CMa and VX Sgr are reasonably reproduced by an expansion velocity of 27 and 17 km s-1, respectively. The radius of the SiO layer in VY CMa and VX Sgr is 2.5 and 2 times larger than the radius of the continuum-forming dust layer, respectively. A microturbulent velocity of 7 km s-1 was found to fit the observed profiles well. The SiO column density derived for VY CMa and VX Sgr is and cm-2, respectively. The column density derived for VY CMa is in rough agreement with the cm-2 estimated by Geballe et al. (geballe79 (1979)) from the P-Cyg profile of the SiO line at 8.309 m. However, the strength of the absorption and emission components in the P-Cyg profile depends on the combination of the temperature, radius, and column density of the SiO layer, and these parameters cannot be unambiguously constrained by our observations of the single SiO line alone. Nevertheless, the wavelength shifts of the absorption and emission components are primarily determined by the outflow velocity. Therefore, the derived outflow velocities are not significantly dependent on the uncertainties in the other parameters. Given the terminal wind velocities of 44–48 and 22–26 km s-1 for VY CMa and VX Sgr, respectively (Kemper et al. kemper03 (2003)), this SiO line at 8.0952 m originates in the region, where the material has reached approximately 60–70% of the terminal velocity and is being further accelerated.

3.3 Mira stars
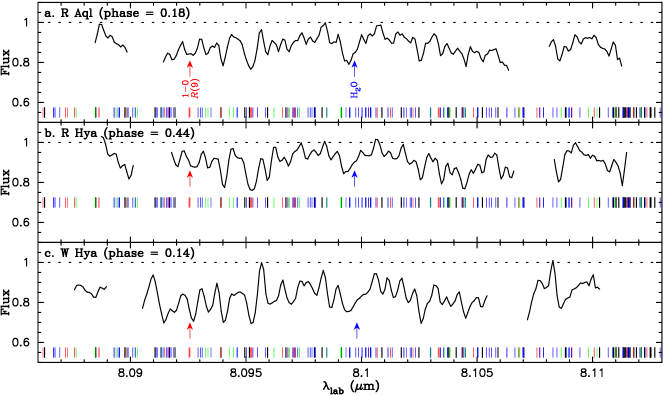
Figure 5 shows the observed spectra of three Mira stars, R Aql, R Hya, and W Hya. The spectral features in R Hya and R Aql are systematically weaker compared to the dust-free M4–5 giants shown in Fig. 1 but comparable to the M6.5 giant Aps. Given that the dust emission in Aps (D.E.C. = 0.29) is similar to R Aql and R Hya (D.E.C. = 0.36 and 0.24, respectively), the contribution of the dust emission is likely (at least partially) responsible for making the SiO lines appear weaker (but note that the dust emission alone cannot account for the weak spectral features in Aps, as we discuss in Sect. 4.2.2). This can also explain why the SiO lines in W Hya, whose D.E.C. value (0.10) is lower than in R Aql and R Hya, are more pronounced.
As the figure shows, there are a number of H2O lines in the observed spectral window, but many of them are blended with the SiO lines. The only H2O feature mostly free from the blend with the SiO lines is the broad absorption between 8.0995 and 8.1 m. The only SiO line relatively free from the blend of H2O lines is the 29SiO line at 8.0925 m, as marked in the figure. This 29SiO line in R Aql and R Hya is broader compared to the normal K–M giants shown in Fig. 1. In the case of R Hya, the line is redshifted by 7.8 km s-1, although the H2O lines at 8.093 m may also be partially responsible for the apparent wavelength shift. The same line in W Hya is narrower than in R Aql and R Hya, but is redshifted by 5.4 km s-1. While it cannot be entirely excluded that unidentified blend is responsible for the broadening of this 29SiO line, it may also be due to the line doubling caused by different radial velocities at different layers. For example, Hinkle & Barnes (hinkle79 (1979)) as well as Hinkle et al. (hinkle82 (1982)) revealed line doubling in the near-IR H2O and CO lines in Mira stars. They also report time variations in the radial velocity of these lines with an amplitude of 10–20 km s-1. Therefore, the SiO fundamental lines provide a useful tool to probe the atmospheric dynamics. Monitoring observations are necessary to better understand the effects of the pulsation on the formation layer of the SiO fundamental lines.
3.4 GCIRS3
The nature of GCIRS3 is not yet clear. While the deep silicate absorption feature at 10 m indicates the oxygen-rich nature, Pott et al. (pott08 (2008)) propose that it is a dust-enshrouded carbon star based on the mid-IR interferometric observations. The observed spectrum of GCIRS3 plotted in Fig. 6 shows only weak features. We compared the spectrum of GCIRS3 with those of the Mira stars in our sample, but we could not identify the SiO or H2O lines in GCIRS3. GCIRS3 does not show SiO lines in the P-Cyg profile unlike VY CMa and VX Sgr, although the spectral energy distribution of GCIRS3 suggests that the star is dust-enshrouded. Therefore, the absence of the SiO and H2O lines lends support to the hypothesis of Pott et al. (pott08 (2008)) that GCIRS3 is a dust-enshrouded carbon star.
4 Comparison with model atmospheres
4.1 Determination of basic stellar parameters
4.1.1 K–M giants and optically bright red supergiants
We compared the observed SiO spectra with those predicted by photospheric models. For the normal K–M giants and optically bright red supergiants shown in Figs. 1 and 2, we used the MARCS photospheric models (Gustafsson et al. gustafsson08 (2008))111Available at http://marcs.astro.uu.se, which represent plane-parallel or spherical non-gray hydrostatic photospheres with the molecular and atomic line opacities taken into account with the opacity sampling technique. We used spherical MARCS models for our study. Each MARCS model is specified by the effective temperature (), surface gravity (), stellar mass (), microturbulent velocity (), and chemical composition.
For two K–M giants ( Boo and Lib) and three optically bright red supergiants ( Ori, Sco, and Her), most of the basic stellar parameters, in particular and , are available in the literature, as summarized in Table LABEL:param_table. For the other stars ( Cru, V806 Cen, Mus, L2 Pup, and Aps), we derived , , in the following manner. We determined using the observed bolometric flux and the angular diameter. While the angular diameter measurement is available for Cru (Glindemann et al. glindemann01 (2001)), the angular diameter of the remaining stars was estimated from the relationship between the angular size and the color derived by van Belle (vanbelle99 (1999)). We used the relationship for “normal giants and supergiants” from van Belle (vanbelle99 (1999)) for V806 Cen, Mus, and Aps. The relationship for “variable stars” was adopted for L2 Pup, because this star shows a larger variability amplitude compared to the other stars. The bolometric flux of each star was computed from photometric data from the visible to the mid-IR (20 m) taken from the literature (Johnson et al. johnson66 (1966); Morel & Magnenat morel78 (1978); Mermilliod mermilliod91 (1991); Ducati ducati02 (2002); NOMAD Catalog, Zacharias et al. zacharias05 (2005); 2MASS, Skrutskie et al. skrutskie06 (2006); WISE All-Sky Data Release, Cutri et al. cutri12 (2012)). The photometric data were de-reddened using the interstellar extinction estimated with the method of Arenou et al. (arenou92 (1992)) and the wavelength dependence of the interstellar extinction from Savage & Mathis (savage79 (1979)). We confirmed that the derived for Lib in this manner agrees with the value determined with the infrared flux method (Tsuji tsuji08 (2008)), lending support to the reliability of our method of the determination.
The error in the derived results from the uncertainty in the estimated angular diameter and the bolometric flux. Van Belle (vanbelle99 (1999)) mentions that the accuracy in the angular diameter derived from the color is approximately 10%. The uncertainty in the bolometric flux results from the fact that our stars are semiregular or irregular variables with a variability amplitude of mag, and the photometric data in different bands were not contemporaneously taken. We assumed an uncertainty of 13% in the bolometric flux, adopting the value derived for the red supergiant Betelgeuse, which shows a similar variability amplitude (Ohnaka et al. ohnaka13alfsco (2013)).
We note that L2 Pup started a dimming event around 1994, which is likely caused by episodic dust formation (Bedding et al. bedding02 (2002)). The dimming event was still ongoing at the time of our VISIR observation. However, Bedding et al. (bedding02 (2002)) conclude that the effective temperature or the luminosity is unlikely to have changed compared to the pre-dimming state. Therefore, we used the color of L2 Pup in the pre-dimming state to estimate , because the photometric data during the dimming event are affected by the newly formed dust and, therefore, do not reflect the color of the star itself.
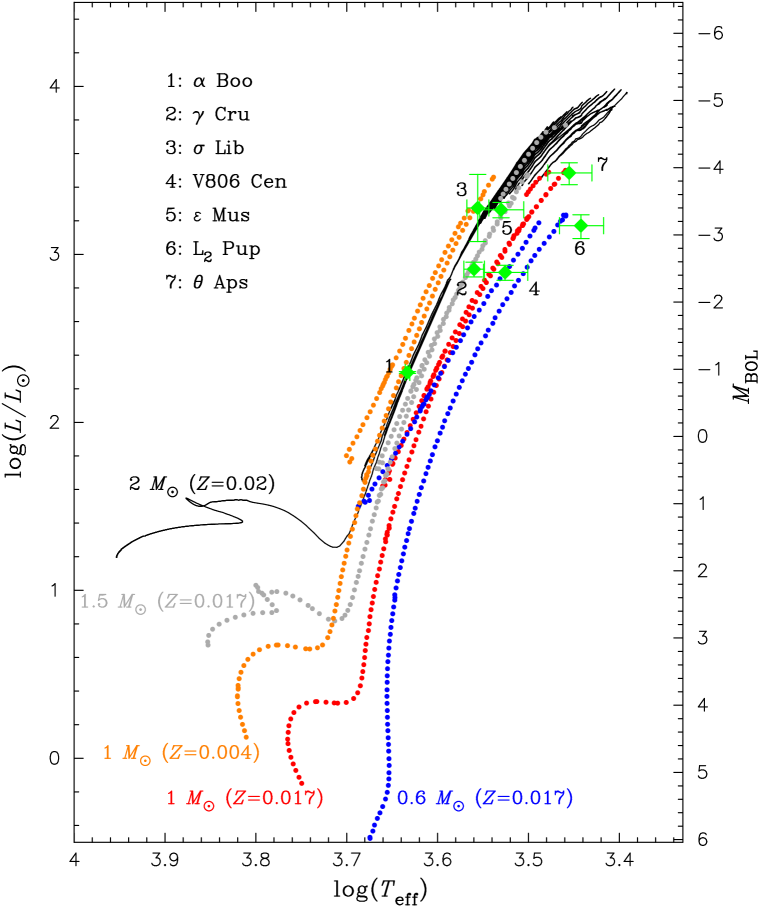
Because the distance to our program stars is known thanks to the Hipparcos parallax (van Leeuwen vanleeuwen07 (2007)), it is straightforward to estimate the luminosity () from the de-reddened bolometric flux and the distance. Using the and determined in this manner, our program stars are plotted on the H-R diagram, as shown in Fig. 7. Also plotted are theoretical evolutionary tracks for 0.6, 1, and 1.5 stars taken from Bertelli et al. (bertelli08 (2008)) and for a 2 star from Herwig (herwig05 (2005))222http://astrowww.phys.uvic.ca/~fherwig. Comparison with these evolutionary tracks allows us to estimate the stellar mass. Combining the stellar mass with the stellar radius, which can be computed from and , results in the surface gravity.
The chemical composition, in particular [Fe/H] and the CNO abundances, is also necessary to specify the MARCS models. However, the analysis of the chemical composition is available only for two K and M giants, Boo and Lib, and two red supergiants, Ori and Her. The CNO abundances derived for Boo, Lib, and Her (Decin et al. decin03 (2003); Ramirez et al. ramirez11 (2011); Smith et al. smith13 (2013); Tsuji tsuji08 (2008)) roughly agree with the “moderately CN-cycled composition” from the MARCS model grid. For the M giants other than Boo and Lib, we assumed this chemical composition from the MARCS model grid. On the other hand, the CNO abundances derived for the red supergiant Ori (Tsuji tsuji06 (2006)) are closer to the “heavily CN-cycled composition” from the MARCS grid. For the red supergiant Sco, we adopt the same CNO abundances as Ori, based on the similarity in , , and (Ohnaka et al. ohnaka13alfsco (2013)). The metallicity ([Fe/H]) is determined only for Boo ([Fe/H] = , Decin et al. decin03 (2003); Ramirez et al. ramirez11 (2011)) and Ori ([Fe/H] = 0.1, Lambert et al. lambert84 (1984)). Therefore, we assumed the solar metallicity for the M giants and supergiants except Boo, for which we adopted [Fe/H] = 0.0.
We used a microturbulent velocity of 2.5 km s-1 for the K–M giants in our sample and the red supergiant Her and 5 km s-1 for the red supergiants Ori and Sco based on the analyses of Smith & Lambert (smith90 (1990)), Tsuji (tsuji06 (2006); tsuji08 (2008)), and Tsuji et al. (tsuji94 (1994)).
For each star, we selected the MARCS model with parameters closest to the ones derived as described above. The derived basic stellar parameters, as well as the MARCS models adopted for our program stars are listed in Table LABEL:param_table.
4.1.2 Mira stars
Because the effective temperature and luminosity (and thus the radius) of Mira stars are expected to change with phase, it is necessary to determine the stellar parameters at the time of our VISIR observations to specify model atmospheres. Recently Ireland et al. (ireland11 (2011)) have presented time series of dynamical model atmospheres for Mira stars. To check whether there are models appropriate for the Mira stars that we observed, we estimated the luminosity of our program stars at the phase of our VISIR observations. For R Aql, using the bolometric flux of erg cm-2 s-1 (Hofmann et al. hofmann00 (2000)) and the distance of 240 pc (Whitelock et al. whitelock00 (2000)), we obtain = 6290 (phase = 0.18). For R Hya and W Hya, we estimated the luminosity at the phase of our VISIR observations from the bolometric magnitude and its amplitude obtained by Whitelock et al. (whitelock00 (2000)). The resulting luminosity of R Hya and W Hya is 7200 (phase = 0.44) and 8900 (phase = 0.14), respectively. While some models in Ireland et al. (ireland11 (2011)) have approximately the same luminosities as the observationally derived ones at the corresponding phases, the models have either too long periods or too large variability amplitudes compared to R Aql, R Hya, and W Hya. The models of Ireland et al. (ireland11 (2011)) were computed for stellar parameters appropriate for Cet, R Leo, and R Cas. Therefore, comparison of the VISIR spectra of our Mira stars with models should be carried out, when dynamical models with parameters appropriate for our program stars become available.
| Name | MARCS model | |||||||
| (K) | (cm s-2) | () | () | ////[Fe/H] | 28Si/29Si | 28Si/30Si | ||
| K–M giants | ||||||||
| Boo | 4250/1.5/1.0/2.0/ | |||||||
| Cru | 3600/1.0/1.0/2.0/+0.0 | |||||||
| Lib | c | 3600/0.5/1.0/2.0/+0.0 | ||||||
| V806 Cen | 3400/0.5/1.0/2.0/+0.0 | |||||||
| Mus | 3400/0.5/1.0/2.0/+0.0 | |||||||
| L2 Pup | 2800/0.0/0.5/2.0/+0.0 | — | — | — | ||||
| Aps | 2800/0.0/1.0/2.0/+0.0 | — | — | — | ||||
| Red supergiants | ||||||||
| Ori | g | 3600/0.0/5.0/5.0/+0.0† | 7.45i | 20i | 25j | |||
| Sco | h | 3600/0.0/5.0/5.0/+0.0† | 7.44i | 13i | 25j | |||
| Her | c | 3300/0.0/5.0/2.0/+0.0 | 7.26i | 20i | 29i | |||
4.2 Comparison between VISIR spectra and MARCS models
Using the temperature and pressure stratifications of the MARCS models, we computed synthetic spectra including the SiO fundamental lines and H2O lines. We used the SiO line list recently published by Barton et al. (barton13 (2013))333Available at http://www.exomol.com/data/molecules/SiO, which is more complete than the line list of Langhoff & Bauschlicher (langhoff93 (1993)) that has been widely used. The H2O line list was taken from Barber et al. (barber06 (2006))444Available at http://www.exomol.com/data/molecules/H2O. Details of the computation of the synthetic spectra are described in Appendix of Ohnaka (ohnaka13 (2013)).
4.2.1 K–M giants warmer than 3400 K
Figures 8a–e show a comparison of the VISIR spectra of five K–M giants warmer than 3400 K with the MARCS synthetic spectra, which are already convolved with a Gaussian that represents the instrumental resolution and the macroturbulence. We adopted a macroturbulent velocity of 3 km s-1 for these K–M giants based on the analysis of the CO first overtone lines by Tsuji (tsuji86 (1986)).
The relatively isolated 28SiO lines marked by the black arrows in the figure allow us to estimate the silicon abundance. For Boo, we first computed a synthetic spectrum with = 7.01 (the abundance is given on the scale of = 12), which corresponds to the solar value of = 7.51 (Asplund et al. asplund09 (2009))555The silicon abundance = 7.51 was determined with a 3-D solar model atmosphere, while we used 1-D MARCS models. However, Asplund et al. (asplund09 (2009)) show that the difference in the silicon abundance derived from the 3-D and 1-D solar model atmospheres is only 0.02 dex. scaled to [Fe/H] = . However, the synthetic spectrum predicts the SiO lines to be too weak. We found that the observed spectrum can be reproduced well by the increased silicon abundance of = . Given the error in the derived silicon abundance, this value roughly agrees with = 7.45 (errors smaller than 0.1 dex) derived by Peterson et al. (peterson93 (1993)) and = derived more recently by Ramirez et al. (ramirez11 (2011)) from the atomic Si lines in the visible. The observed spectra of Cru, Lib, V806 Cen, and Mus are consistent with the solar silicon abundance of = 7.51. The uncertainty in the silicon abundance is 0.2 dex for Cru and Lib and 0.3 dex for V806 Cen and Mus. The reason for the larger uncertainty in cooler stars is that the strength of the 28SiO lines observed in our spectral window become insensitive to the silicon abundance in cooler stars.
Using the 29SiO lines at 8.0925, 8.1012, 8.1033, and 8.1077 m, as well as the 30SiO lines at 8.0933, 8.0944, 8.1030 m, we estimated the 28Si/29Si and 28Si/30Si ratios. The observed 29SiO and 30SiO lines in Boo, Cru, and V806 Cen are reasonably reproduced by 28Si/29Si = 15 and 28Si/30Si = 25, which are the average values in M giants analyzed by Tsuji et al. (tsuji94 (1994)). On the other hand, we found (28Si/29Si, 28Si/30Si) = (30, 50) and (15, 50) for Lib and Mus, respectively. The errors in the 28Si/29Si and 28Si/30Si ratios are 30% and 40%, respectively. The relatively large errors result from the small number of 29SiO and 30SiO lines used in the analysis. The derived silicon abundance and isotope ratios are summarized in Table LABEL:param_table.
There are slight wavelength shifts in the observed positions of some SiO lines compared to the synthetic spectra (e.g., 8.094 and 8.096 m). However, given the uncertainty in the wavelength calibration of 2.6 km s-1, these wavelength shifts, which are 3 km s-1 at most, cannot be definitively regarded as the evidence of the atmospheric motions.
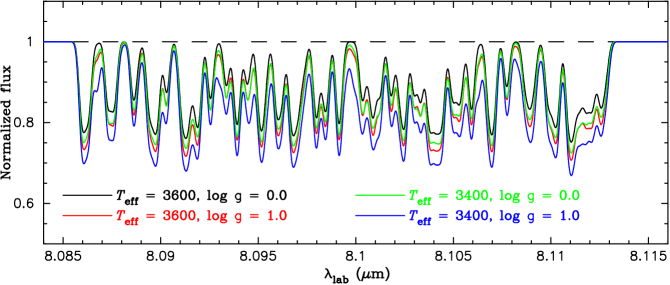
In Sect. 3.1, we mentioned the apparent lack of clear correlation between the SiO line strength and the spectral type among the M giants discussed here. To better understand this observational result, we show in Fig. 9 the synthetic SiO spectra predicted from the MARCS models with = 3400 and 3600 K and = 0.0 and 1.0 (other parameters are = 1 , = 2 km s-1, [Fe/H] = 0.0, and moderately CN-cycled composition). The figure shows that the SiO lines become stronger with decreasing and increasing in the and range relevant to our M giants. In our sample, the cooler stars tend to have lower surface gravities. Therefore, the increase in the SiO line strength due to lower can be canceled out by the decrease in the line strength due to lower , which results in a weak dependence of the SiO line strength on the spectral type.
While the observed spectra of Boo and Lib are explained well by the MARCS models, there is noticeable disagreement between the observed and synthetic spectra for some SiO lines in Cru, V806 Cen, and Mus. The 28SiO lines at 8.0939 (2–1 ), 8.0991 (3–2 ), and 8.1025 m (2–1 ), marked by the blue dots in Fig. 8, are stronger than predicted by the MARCS models. Increasing the silicon abundance does not reconcile this problem, because it would worsen the agreement for the other 28SiO lines marked by the black arrows. The lines at 8.0939 and 8.0991 m include blend of weaker 29SiO and 30SiO lines, respectively. However, increasing the abundance of these isotopic species would worsen the agreement for other 29SiO and 30SiO lines marked by the red and green arrows. Changing the stellar parameters within their uncertainties does not improve the agreement either.
The 28SiO lines with the absorption excess have low excitation potentials (0.16–0.30 eV), while the weaker 28SiO lines reproduced well by the models have higher excitation potentials of 0.77–1.40 eV. This is similar to what is found for the SiO first overtone lines in latest M giants by Tsuji et al. (tsuji94 (1994)), which is interpreted as the indication of the MOLsphere, as outlined in Sect. 1. Therefore, the absorption excess in the SiO fundamental lines with low excitation potentials may also be a signature of the MOLsphere. However, as described in Sect. 4.1, we assumed the CNO abundances and [Fe/H] for Cru, V806 Cen, and Mus, because no quantitative analysis of the chemical composition is available in the literature. Therefore, we cannot exclude the possibility that the absorption excess may be due to this assumed chemical composition. To confirm that the absorption excess is indeed a signature of the MOLsphere, the determination of the CNO abundances and [Fe/H] in these stars is necessary.
4.2.2 Cool M giants with K: L2 Pup and Aps
As Figs. 8f and 8g show, the agreement between the observed and synthetic spectra is very poor for L2 Pup and Aps. In these stars, which are much cooler ( = 2800–2900 K) than the stars discussed above, the MARCS models predict the H2O lines to be strong. Most of the features in the synthetic spectra shown in Figs. 8f and 8g are due to H2O. However, the shape and depth of the spectral features predicted by the models show little correspondence to the observed spectra.
Because L2 Pup and Aps show dust emission (D.E.C. = 0.60 and 0.29, respectively), we tentatively added a fractional contribution of the continuum dust emission of 50% in the synthetic spectra. Changing the fractional contribution of the dust continuum emission does not reconcile the disagreement, because it only makes all spectral features appear weaker or stronger and cannot alter the relative strengths of different spectral features. On the other hand, if there is emission from the extended MOLsphere, it can fill in the absorption and make the resultant spectrum (i.e., integrated over the entire stellar image in the sky) appear very differently from the photospheric spectrum. Therefore, the disagreement between the observed and photospheric model spectra in L2 Pup and Aps may be, again, a signature of the MOLsphere.
In Figs. 8f and 8g, the normalized flux of the synthetic spectra is higher than 1 at some wavelengths that are masked by the strong telluric lines (e.g., 8.088 m). This is not emission but simply because we attempted to obtain the best match to the VISIR data at the wavelengths not severely affected by the telluric lines. In other words, the wavelengths of the strong telluric lines were excluded from the fitting.
4.2.3 Optically bright red supergiants
Figure 10 shows a comparison between the observed and synthetic spectra for the three optically bright red supergiants. For Ori, Sco, and Her, we adopted (, 28Si/29Si, 28Si/30Si) = (7.45, 20, 25), (7.44, 13, 25), and (7.26, 20, 29), respectively, based on the results from the SiO first overtone lines by Tsuji et al. (tsuji94 (1994)). Because the 28Si/30Si ratio could not be determined for Ori and Sco in Tsuji et al. (tsuji94 (1994)), we assumed it to be the same as the average value among M giants. Note that these silicon abundances were already corrected for the difference in the -values used in Tsuji et al. (tsuji94 (1994)) and this work. We adopted a macroturbulent velocity of 10 km s-1 for Ori (Tsuji tsuji06 (2006)) and assumed the same value for Sco, while we used a macroturbulent velocity of 3 km s-1 for Her (Tsuji tsuji86 (1986)). The figure shows that the VISIR spectra of Ori and Sco are fairly reproduced by the MARCS models, although the agreement is not as good as in the warm K–M giants discussed in Sect. 4.2.1. The agreement is much worse for Her. The model predicts many features to be too strong. We computed synthetic spectra using models with slightly different parameters but could not improve the fit. Given that Her shows little dust emission, the disagreement cannot be solved by adding the dust emission either. As in the case of L2 Pup and Aps discussed above, this disagreement may be attributed to the emission from the extended MOLsphere.
The fair agreement between the observed and model spectra for Ori is a little surprising, because Tsuji (tsuji06 (2006)) demonstrates that the SiO absorption bands observed longward of 7.5 m with a spectral resolution of 1600 are much weaker than predicted by the photospheric model, suggesting the contribution of H2O and possibly also SiO emission from the extended MOLsphere. However, the signature of the MOLsphere can be masked in spatially unresolved spectra, because the additional absorption due to the MOLsphere can be filled in by the extended emission from the MOLsphere itself. This can make the resultant, spatially unresolved spectrum appear nearly unchanged. For example, Ohnaka et al. (ohnaka12 (2012)) and Ohnaka (ohnaka13 (2013)) demonstrate that although the spatially unresolved spectra of the 2.3 m CO first overtone lines in K and M giants can be reproduced well by the MARCS photospheric models alone and show very little signature of the MOLsphere, spatially resolved spectro-interferometric observations clearly reveal the presence of the extended MOLsphere. This means that constraining the parameters of the MOLsphere from spatially unresolved spectra alone is not necessarily straightforward.
Therefore, to probe the properties of the MOLsphere from the SiO fundamental lines, it would be useful to combine the present VISIR spectra with interferometric observations. The mid-IR interferometric instrument MIDI at the ESO’s Very Large Telescope Interferometer (VLTI), as well as the next generation VLTI instrument MATISSE, can spatially resolve our program stars from 8 to 13 m. Although the spectral resolution is much lower (200 at most with MIDI), combination of the spatially unresolved, high spectral resolution VISIR data and spatially resolved data with a lower spectral resolution taken with MIDI or MATISSE would enable us to constrain the parameters of the MOLsphere more reliably. We plan to present such an analysis for Sco and Her, for which we have obtained MIDI data, in a forthcoming paper.
5 Concluding remarks
We have obtained high spectral resolution spectra of the 8.1 m SiO fundamental lines in 16 cool evolved stars, consisting of seven normal (= non-Mira) K and M giants, five red supergiants, three Mira stars, and the enigmatic object GCIRS3 toward the Galactic center. The SiO lines detected in the K–M giants, as well as in the optically bright red supergiants, do not show a signature of systematic outflows. On the other hand, we detected SiO lines with the P-Cyg profile in the dusty red supergiants VY CMa and VX Sgr, with the latter object being a new detection. A simple modeling of the observed P-Cyg profiles suggests an outflow velocity of 27 and 17 km s-1 in VY CMa and VX Sgr, respectively. We also detected a broadening and/or redshift in an 29SiO line in Mira stars. In GCIRS3, no SiO or H2O lines can be identified, which is consistent with the previous suggestion that this object is a dust-enshrouded carbon star, despite the presence of the 10 m silicate feature.
The observed spectra of K–M giants warmer than 3400 K are reasonably reproduced by the MARCS photospheric models. On the other hand, the MARCS models cannot explain the observed spectra of the cooler ( K) M giants at all, even if the dust emission is taken into account. Similarly, while the observed spectra of the red supergiants Ori and Sco ( K) can be fairly reproduced by the MARCS models, the observed spectrum of the cooler red supergiant Her ( K) shows noticeable disagreement with the MARCS model. This disagreement in the cooler M giants and red supergiant may be a signature of the MOLsphere. Combination of VISIR high resolution spectroscopy and mid-IR spectro-interferometry would be necessary to probe the contribution of the MOLsphere in the SiO fundamental lines. Given that silicon plays an important role in dust formation in oxygen-rich stars, studying the physical properties of the SiO gas in the MOLsphere is indispensable for understanding the dust formation in oxygen-rich stars.
Acknowledgements.
We thank the ESO VLT team for supporting our VISIR observations. This research has made use of the SIMBAD database, operated at CDS, Strasbourg, France. We acknowledge with thanks the variable star observations from the AAVSO International Database contributed by observers worldwide and used in this research. This publication makes use of data products from the Wide-field Infrared Survey Explorer, which is a joint project of the University of California, Los Angeles, and the Jet Propulsion Laboratory/California Institute of Technology, funded by the National Aeronautics and Space Administration. This publication also makes use of data products from the Two Micron All Sky Survey, which is a joint project of the University of Massachusetts and the Infrared Processing and Analysis Center/California Institute of Technology, funded by the National Aeronautics and Space Administration and the National Science Foundation.References
- (1) Arenou, F., Grenon, M., & Gómez, A. 1992, A&A, 258, 104
- (2) Aringer, B., Höfner, S., Wiedemann, G., et al. 1999, A&A, 342, 799
- (3) Asplund, M., Grevesse, N., Sauval, J., & Scott, P. 2009, ARA&A, 47, 481
- (4) Barber, R. J., Tennyson, J., Harris, G. J., & Tolchenov, R. N. 2006, MNRAS, 368, 1087
- (5) Barton, E., J., Yurchenko, S. N., & Tennyson, J. 2013, MNRAS, 434, 1469
- (6) Bedding, T., Zijlstra, A. A., Jones, A., et al. 2002, MNRAS, 337, 79
- (7) Bertelli, G., Girardi, L., Marigo, P., & Nasi, E. 2008, A&A, 484, 815
- (8) Bladh, S., Höfner, S., Nowotny, W., Aringer, B., & Eriksson, K. 2013, A&A, 553, A20
- (9) Braun, K., Baade, R., Reimers, D., & Hagen, H.-J. 2012, A&A, 546, A3
- (10) Cohen, M., Davies, J. K. 1995, MNRAS, 276, 715
- (11) Cutri, R. M. et al. 2012, WISE All-Sky Data Release
- (12) Decin, L., Vandenbussche, B., Waelkens, C., et al. 2003, A&A, 400, 709
- (13) Dehaes, S., Bauwens, E., Decin, L., et al. 2011, A&A, 533, A107
- (14) Deutsch, A. 1956, ApJ, 123, 210
- (15) Ducati, J. R. 2002, Catalogue of Stellar Photometry in Johnson’s 11-color system
- (16) Geballe, T. R., Lacy, J. H., & Beck, S. C. 1979, ApJ, 230, L47
- (17) Glindemann, A., Bauvir, B., Delplancke, F., et al. 2001, ESO Messenger, 104, 2
- (18) Gontscharov, G. A. 2006, Astron. Lett., 32, 759
- (19) Gustafsson, B., Edvardsson, B., Eriksson, K., et al. 2008, A&A, 486, 951
- (20) Harper, G. M., Brown, A., & Guinan, E. 2008, AJ, 135, 1430
- (21) Harwit, M., Malfait, K., Decin, L., et al. 2001, ApJ, 557, 844
- (22) Hatzes, A., & Cochran, W. D. 1993, ApJ, 413, 339
- (23) Heras, A. M., Shipman, R. F., Price, S. D., et al. 2002, A&A, 394, 539
- (24) Herwig, F. 2005, ARA&A, 43, 435
- (25) Hinkle, K. H., & Barnes, T. G. 1979, ApJ, 227, 923
- (26) Hinkle, K. H., Barnes, T. G., Lambert, D. L., & Beer, R. 1976, ApJ, 210, L141
- (27) Hinkle, K. H., Hall, D. N. B., & Ridgway, S. 1982, ApJ, 252, 697
- (28) Hofmann, K.-H., Beckmann, U., Blöcker, T., et al. 2000, SPIE Proceedings, 4006, 688
- (29) Höfner, S. 2011, “Why Galaxies Care About AGB stars II: Shining examples and common inhabitants”, eds., F. Kerschbaum, T. Lebzelter, & R. Wing, ASP Conf. Ser. 445, 193
- (30) Ireland, M., Scholz, M., & Wood, P. R. 2011, MNRAS, 418, 114
- (31) Johnson, H. L., Iriarte, B., Mitchell, R. I., & Wisniewskj, W. Z. 1966, Comm. Lunar & Planetary Lab. 4, 99
- (32) Keady, J. J., & Ridgway, S. T. 1993, ApJ, 406, 199
- (33) Kemper, F., Stark, R., Justtanont, K., et al. 2003, A&A, 407, 609
- (34) Kerschbaum, F., & Olofsson, H. 1999, A&AS, 138, 299
- (35) Lacour, S., Meimon, S., Thiébaut, E., et al. 2008, A&A, 485, 561
- (36) Lagage, P.O., Pel, J. W., Authier, M., et al. 2004, The Messenger, 117, 12
- (37) Lambert, D. L., Brown, J. A., Hinkle, K. H., & Johnson, H. R. 1984, ApJ, 284, 223
- (38) Langhoff, S. R., & Bauschlicher, C. W., Jr. 1993, Chem. Phys. Letters, 211, 305
- (39) Le Bouquin, J.-B., Lacour, S., Renard, S., et al. 2009, A&A, 496, L1
- (40) Lebzelter, T., Hinkle, K. H., & Aringer, B. 2001, A&A, 377, 617
- (41) Lundin, K. L., Ballester, P., & Peron, M. 2008, VLT VISIR Pipeline User Manual (ESO)
- (42) Martí-Vidal, I., Marcaide, J. M., Quirrenbach, A., et al. 2011, A&A, 529, A115
- (43) Mermilliod, J.C. 1991, Catalogue of Homogeneous Means in the UBV System, Institut d’Astronomie, Université de Lausanne
- (44) Moravveji, E., Guinan, E., Khosroshahi, H., & Wasatonic, R. 2013, AJ, in press (http://arxiv.org/abs/1308.1632)
- (45) Morel, M., & Magnenat, P. 1978, A&AS, 34 477
- (46) Murdoch, K., Clark, M., & Hearnshaw, J. B. 1992, MNRAS, 254, 27
- (47) O’Gorman, E., Harper, G. M., Brown, J. M., et al. 2012, AJ, 144, 36
- (48) Ohnaka, K. 2004a, A&A, 421, 1149
- (49) Ohnaka, K. 2004b, A&A, 424, 1011
- (50) Ohnaka, K. 2013, A&A, 553, A3
- (51) Ohnaka, K., Hofmann, K.-H., Benisty, M., et al. 2009, A&A, 503, 183
- (52) Ohnaka, K., Weigelt, G., Millour, F., et al. 2011, A&A, 529, A163
- (53) Ohnaka, K., Hofmann, K.-H., Schertl, D., et al. 2012, A&A, 537, A53
- (54) Ohnaka, K., Hofmann, K.-H., Schertl, D., et al. 2013, A&A, 555, A24
- (55) Perrin, G., Ridgway, S. T., Coudé du Foresto, V., Mennesson, B., Traub, W. A., & Lacasse, M. G. 2004a, A&A, 418, 675
- (56) Perrin, G., Ridgway, S. T., Mennesson, B., et al. 2004b, A&A, 426, 279
- (57) Perrin, G., Ridgway, S. T., Verhoelst, T., et al. 2005, A&A, 436, 317
- (58) Peterson, R., Dalle Ore, C. M., & Kurucz, R. 1993, ApJ, 404, 333
- (59) Pott, J.-U., Eckart, A., Glindemann, A., et al. 2008, A&A, 480, 115
- (60) Ramírez, I., & Allende Prieto, C. 2011, ApJ, 743, 135
- (61) Richter, M. J., Lacy, J. H., Greathouse, T. K., & Jaffe, D. T. 2001, RMxAC, 10, 53
- (62) Savage, B., & Mathis, J. S. 1979, ARA&A, 17, 73
- (63) Skrutskie, M. F., Cutri, R. M., Stiening, R., et al. 2006, AJ, 131, 1163 (The 2MASS All-Sky Catalog of Point Sources)
- (64) Sloan, G.C., & Price, S. D. 1998, ApJS, 119, 141
- (65) Smith, M. A., Patten, B. M., & Goldberg, L. 1989, AJ, 98, 2233
- (66) Smith, V. V., & Lambert D. L. 1990, ApJS, 72, 387
- (67) Smith, V. V., Cunha, K., Shetrone, M. D., et al. 2013, ApJ, 765, 16
- (68) Tsuji, T. 1986, A&A, 156, 8
- (69) Tsuji, T. 2000, ApJ, 538, 801
- (70) Tsuji, T. 2000, ApJ, 540, L99
- (71) Tsuji, T. 2001, A&A, 376, L1
- (72) Tsuji, T. 2006, ApJ, 2006, 645, 1448
- (73) Tsuji, T. 2008, A&A, 489, 1271
- (74) Tsuji, T., Ohnaka K., Aoki, W., & Yamamura, I. 1997, A&A, 320, L1
- (75) Tsuji, T., Ohnaka, K., Hinkle, K. H., & Ridgway, S. T. 1994, A&A, 289, 469
- (76) van Belle, G. 1999, PASP, 111, 1515
- (77) van Leeuwen, F. 2007, A&A, 474, 653
- (78) Whitelock, P., Marang, F., & Feast, M. 2000, MNRAS, 319, 728
- (79) Wittkowski, M., Boboltz, D. A., Ohnaka, K., Driebe, T., & Scholz, M. 2007, A&A, 470, 191
- (80) Wittkowski, M., Boboltz, D. A., Driebe, T., et al. 2008, A&A, 479, L21
- (81) Wittkowski, M., Boboltz, D. A., Ireland, M., et al. 2011, A&A, 532, L7
- (82) Woodruff, H. C., Tuthill, P. G., Monnier, J. D., et al. 2008, ApJ, 673, 418
- (83) Woodruff, H. C., Ireland, M. J., Tuthill, P. G., et al. 2009, ApJ, 691, 1328
- (84) Young, K. 1995, ApJ, 445, 872
- (85) Zacharias, N., Monet, D. G., Levine, S. E., et al. 2005, NOMAD Catalog
- (86) Zhao-Geisler, R., Quirrenbach, A., Köhler, R., Lopez, B., & Leinert, C., 2011, A&A, 530, A120