Influence of free carriers on exciton ground states in quantum wells
Abstract
The influence of free carriers on the ground state of the exciton at zero magnetic field in a quasi-two-dimensional quantum well doped with electrons is considered in the framework of the random phase approximation. The effects of the exciton-charge-density interaction and the inelastic scattering processes due to the Hartree-Fock electron-electron exchange interaction are taken into account. The effect of phase-space filling is considered using an approximate approach. The results of the calculation are compared with the experimental data available.
PACS number(s): 71.10.Ca, 71.45.Gm, 73.21.Fg, 78.55.Et
I Introduction
The presence of free electrons in quasi-two-dimensional semiconductor structures strongly alters their physical characteristics. In optical investigations of these objects, the photon excites a conduction electron – valence hole pair. To understand the optical properties, it is crucially important to take into account the interactions between this pair and the free carriers.
At low and intermediate electron concentrations, the Coulomb interaction between the electron and the hole leads to formation of the bound exciton state. This shrinks the observable band gap by the exciton binding energy . Similarly to degenerate 3D semiconductors, the electron-electron interaction causes a static screening of the electron-hole Coulomb potential. The screening as well as the filling of phase-space up to the Fermi energy leads to a strong decrease of the exciton binding energy as free electron concentration increases. At some concentration of free electrons the exciton bound state disappears and the so-called Mahan exciton can be expected. Considerable attention has been paid in the literature to experimental and theoretical investigations of the 2D-systems at high concentration of free carriers. The theory of this phenomenon was developed in Ref.Mahan for the 3D crystal and in Ref.Schmitt-Rink-1 ; Schmitt-Rink-2 ; Hawrylak ; Bauer for 2D systems.
Experimental dataCox1 ; Cox2 ; Cox3 ; Teran ; Kukushkin give evidence that, within a relatively narrow interval of free electron concentrations below the metallic phase, the optical absorption band associated with the bound exciton shifts and broadens, and its oscillator strength decreases as carrier concentration is increased. The dependence of these characteristics on the electron concentration allows one to relate these processes with exciton-electron interactions.
In addition, starting from very low concentrations of free electrons in the quantum well, a bound trion (negatively charged exciton) stateCombescot1 ; Combescot2 ; Combescot3 ; Combescot4 is observed in experimentsCox1 ; Cox2 ; Cox3 ; Teran ; Kukushkin . The present article will not be concerned with properties related to the trion state, but its existence provides another channel for exciton-electron interactions.
The observed broadening of the exciton lineCox1 ; Cox2 ; Cox3 ; Teran clearly shows that not only static screening but also inelastic dynamical processes should be considered for the explanation of the exciton spectrum.
The exciton created by a photon has almost zero wave-vector. Further interaction of the exciton with free electrons followed by scattering of a conduction electron near the Fermi level with creates a conduction electron – conduction hole pair. This pair has an arbitrary wave-vector of the center of mass motion q and an energy which is the difference between the conduction electron’s energy in the final and initial states, and , respectively).
The threshold energy of this excitation at and temperature K is zero. Therefore, the lower boundary of the continuum spectrum of the combined excitation consisting of the free exciton plus an electron – conduction hole pair coincides with the energy of the free exciton. As a consequence, this inelastic scattering process results in a homogeneously broadened absorption spectrum with its maximum shifted toward high energies with increasing free electron concentration.
The mechanism responsible for the creation of an electron – conduction hole pair can be either the Coulomb interaction or the exchange interaction between the electron bound in the exciton and the free electrons. For the negatively charged trion, which has two bound electrons coupled in a spin singlet state, the Coulomb interaction seems to be the only important mechanism of interaction with free electrons Klochikhin . In the case of the electrically neutral exciton the strong cancellation of the electron and valence hole self-energy corrections and vertex correction decreases the role of the Coulomb interactions in the scattering processes. This means that the Hartree-Fock exchange interaction between the electron belonging to the exciton and a free electron should be considered as the most probable reason for the broadening of the exciton absorption band.
We consider in detail the behavior of the bound exciton absorption band as a function of free electron concentration in a quantum well doped by electrons at low and intermediate concentrations, and we extrapolate the results up to the concentration at which the bound exciton state disappears.
We will show in this paper that a second order exchange process strongly influences the bound exciton state and the optical spectra of the doped quantum wells, in addition to the nearly rigid band gap renormalization produced by the first order Hartree-Fock exchange interaction. The second order process broadens the exciton absorption band and shifts the energy of its maximum.
The paper is organized as follows. In Section II we formulate the exciton equation in a quasi-two-dimensional quantum well containing free electrons using the known results for the 3D case. We take into account in this Section the static screening of the Coulomb interaction and the effect of phase-space filling. Section III is devoted to the Hartree-Fock exchange interaction between the electron constituting the exciton and the free electrons. In Section IV we describe the calculation of the absorption coefficient as a function of the free electron concentration and give a comparison with experimental data.
II Exciton in a quantum well
We consider only temperature K assuming that is much less than the Fermi energy. Despite the reduced dimensionality there exists a deep analogy with the 3D Fermi systems in the methods of calculation of multi-particle effects.
The exciton equation can be formulated by summing the ladder diagrams for the exciton Green function similarly to the procedure described by MahanMahan . Accepting this paper as a guide we present the exciton equation in a quantum well with finite concentration of free electrons as
| (1) |
where is the reduced mass of the electron and valence hole, is the two-dimensional radius-vector between the electron and hole positions in the exciton. is the quasi-two-dimensional Coulomb potential at zero temperature (in the calculation of which the static screening should be taken into account), and
| (2) |
where is the Fermi wave vector, is the step-like theta-function, and is the Fermi distribution function at zero temperature restricting the integral region in two-dimensional reciprocal space to . We present as two items
| (3) |
After substitution of Eq.(3) into Eq.(1) we obtain two items for the exciton potential energy. The first item is an attractive potential and the second is a repulsive term that arises due to phase-space filling
| (4) |
The matrix element of this equation responsible for the correction to the exciton energy is
| (5) |
In further calculations we find the ground state energy of the Schrödinger equation
| (6) |
where is the quasi-two dimension Coulomb potential taking into account the static screening. Additionally, we should calculate the phase-space filling correction according to Eq.(5).
II.1 Coulomb potential in a quasi-two-dimensional quantum well
The Coulomb and exchange interactions in a quantum well should be transformed to take into account the fact of the reduced dimensionality due to the confinement.
The effective Coulomb potential in the well depends on the thickness and shape of the quantum well, and on the concentration of free electrons.
We find the effective Coulomb potential assuming that all the particles occupy their lowest confined state in a quantum well with infinitely high barriers. In this case the wave functions of all the particles can be characterized by the quantum well thickness .
As the first step, we obtain an effective ”quasi-2D” Coulomb potential without static screening (see Eq.(11) below)by using the Coulomb interaction in 3D systems as a starting point, similarly to Ref. [Klochikhin, ]. The Coulomb Hamiltonian in a 3D system is
| (7) |
where denotes the spin quantum number, and
| (8) |
where is the static dielectric constant, and the , are the radius-vectors of the two interacting particles. We may express the as coordinates in an arbitrary plane and perpendicular to this plane and, similarly, components of the wave-vector in the reciprocal space are and . The signs are related to the electron-electron and electron – valence band hole interactions respectively. In writing Eq. (7) and below, we are using CGS units.
We exclude the 3D motion in the perpendicular direction by calculating the matrix elements of exponentials with wave-functions assuming that the wave functions of the exciton and conduction electron – conduction hole pairs are completely confined within the quantum well of thickness restricted by infinite barriers. The Coulomb vertex contains the product of two matrix elements having the form
| (9) |
The integral over
| (10) |
can be calculated numerically or represented with good accuracy by the function where and
As a result we can present the effective quasi-2D Coulomb interaction without screening as
| (11) |
The screened effective Coulomb potential in the random phase approximation has the form
| (12) |
where is the real part of the dielectric function that takes into account free electrons
| (13) |
In the limit the real part of the dielectric susceptibility can be presented as
| (14) |
And, finally, the screened effective Coulomb potential in the random phase approximation is
| (15) |
where is the radius of the 3D donor state.
Screening in quasi-2D systems was considered in early publications by using perturbation theorySchmitt-Rink-2 . However, new experimental dataCox1 ; Teran were interpreted as showing that the exciton binding energy decreases very sharply with an increase in the concentration of two-dimensional electrons for CdTe quantum wells and for GaAs/AlGaAs quantum wellsKukushkin .
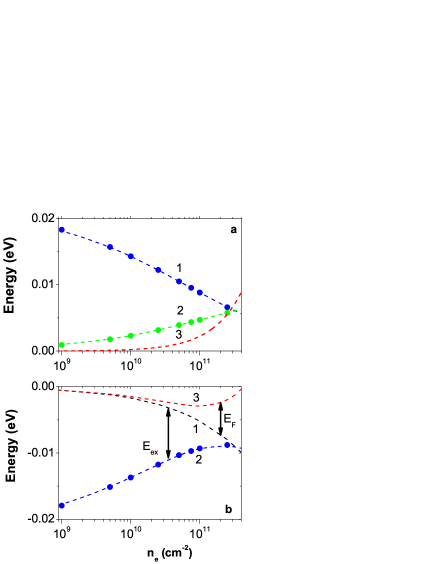
We have calculated the absolute value of the exciton binding energy as a function of free electron concentration in the random phase approximation for 10 nm thick CdTe quantum wells, of the type studied experimentally in Refs. Cox1, ; Cox2, ; Cox3, ; Teran, , assuming infinite-height barriers. The result is presented as Curve 1 in Fig.1a. The phase-space filling correction of Eq.(5) is given in Fig.1a by Curve 2. The parameters used in our calculations are presented in Table I.
An effective Rydberg energy of meV for electron concentration of about cm-2 was estimated by Teran et alTeran from the energy distance between the ground and first excited exciton states observed in their PLE spectrum. Such a value of is obtained in our calculation at cm-2 by using the parameters presented in Table 1. We calculate the quasi-2D Rydberg at zero concentration to be 22 meV. This is twice the 3D value of 11 meV. The relatively strong decrease of the effective Rydberg in the low concentration range from 0 to cm-2 is explained by the strong screening of the Coulomb potential at in the random phase approximation as follows from Eq.(15).
From concentrations about cm-2, the phase-space filling correction significantly decreases the binding energy. Extrapolating Curve 2 up to the point where it crosses Curve 1 in Fig.1a, we can estimate the electron concentration ( cm-2) above which the bound exciton states should disappear.
The decrease of the exciton binding energy due to screening and phase-filling correction is followed by decrease of its oscillator strength. At zero electron concentration the exciton oscillator strength is proportional to where is the effective exciton radius. For the oscillator strength at finite electron concentration we have
| (16) |
In this case two mechanisms decrease the oscillator strength: the increase of the exciton radius and the phase-space filling restriction. The major effect is the increase of the exciton radius resulting from the decrease of the exciton binding energy. We should mention that some underestimation of the phase space filling at high electron concentrations occurs in our calculation of the exciton binding energy because we consider this effect as a perturbation only.
| meV | Å | Å | |||
|---|---|---|---|---|---|
| 11.0 | 100 | 63 | 10.4 |
III Hartree-Fock exchange corrections
We should say that the inelastic 2D plasmon interaction process due to Coulomb interaction with free electrons is significantly weaker for the electro-neutral exciton than for charged particles. This process does not give a notable additional shift or broadening of the exciton line, in contrast to its effects for uncorrelated electrons and holesSchmitt-Rink-3 or for the charged trionKlochikhin . For the exciton, the cancellation of the electron and hole self-energy and vertex corrections leads to a decrease of this interaction. We will show that it is the Hartree-Fock exchange interaction that can describe the shift and broadening of the exciton band.
The early calculations of the band gap renormalization in quantum wells were done in Refs.Kleinmann ; Das Sarma ; BauerAndo
It is convenient to illustrate the calculations of the exchange self-energy corrections by Feynman diagrams starting from the corrections to the single electron interacting with the Fermi sea of electrons neglecting the electron-valence-band hole exchange interaction for simplicity.
We consider the first order self-energy correction to the electron state due to Hartree-Fock exchange interaction, presented in Fig.2(a), in the framework of the rigid shift approximation, taking the external wave vector equal to zero. This leads to a wavevector-independent shift of the conduction band and, therefore, of the exciton states.
The diagram illustrating the second order correction (Fig.2(b)) can be obtained, for instance, from the Feynman diagrams in Fig. 37(b) of Ref.Pines by breaking one of the electron lines. Taking into account that we are interested in broadening of the exciton created by a photon, we put the value of the wave-vector of the renormalized particle equal to zero. The correction to the exciton energy at zero wave-vector of the center of mass is given in Fig.2(c). It can be seen that this diagram is obtained by putting the self-energy diagram of Fig.2(b) at into the electron line of the exciton.
Finally, in order to describe the self-energy corrections to the exciton state, we have to sum the series of multiple scattering processes. In calculations of the exciton Green function we consider only the ground state. This allows us to transform the series into a geometrical progression. Therefore, the major part of the problem is to calculate the self-energy correction to the ground state.

III.1 The Hartree-Fock exchange interaction
First of all we have to express the exchange self-energy correction to the exciton through the 2D Coulomb-like Hamiltonian taken in the form
| (17) |
where the diagram of Fig.2(a) contains the vertex
| (18) |
The diagram of Fig.2(c) contains the vertex depending on the wave-vector and the similar vertex depending on .
The integrals over and for both diagrams we calculate similarly to Eqs.(9,10). Then the first integral over gives the same expression as Eq.(11).
III.1.1 Rigid shift of the conduction band
This leads to a rigid shift of the conduction band states
| (19) |
Approximately, the dependence of this equation on the electron concentration is . The result of the numerical calculation of the band edge shift is presented in Fig.1b by Curve (1). The exciton binding energy with respect to the shifted band edge is presented in Fig.1(b) by Curve (2).
III.1.2 Shift and broadening of the exciton band due to the second order correction
The expression corresponding to the diagram of Fig.2(c) contains two matrix elements over the internal wave function of the ground state exciton. The first of them has the form
| (20) |
and a similar equation can be written for .
The structure of the exchange loop in Fig.2(c) differs from the Coulomb contributionKlochikhin and has the form
| (21) |
where the variable is introduced. The function is
| (22) |
and
| (23) |
We have neglected the exciton kinetic energy in the final state (recoil effect) which is small compared to the energy of the electron-conduction hole pair.
The wave-vector dependence of both matrix elements and arises at values of the order of the reciprocal Bohr radius of the exciton . We will assume this quantity to be essentially larger than the Fermi wave-vector which is the characteristic value for . Therefore, we approximate the product of these matrix elements by the expression Taking into account that the integral over is restricted by we take the function out of the integral of Eq.(24) at . After these simplifications the integral over gives and the remaining integral over in Eq.(22) can be calculated analytically.
Finally, we obtain the exciton self-energy correction due to exchange interaction in the form
| (24) |
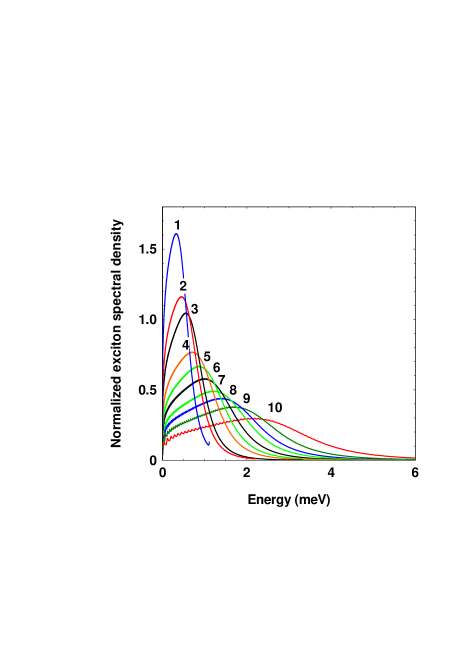
The broadening of the exciton absorption band and the upward shift of its peak with respect to the exciton line at zero electron concentration, resulting from this correction, are shown in Fig.3 for a set of ten electron concentrations ranging up to cm-2. The absorption curves have the form:
| (25) |
where and are the imaginary and real parts of the exciton self-energy correction of Eq.(24). For convenience the absorption band profiles are normalized to unity in Fig.3. We see that the values of the upward shifts are comparable with the effect of the rigid downward shift due to the first order exchange interaction in Fig.1b.
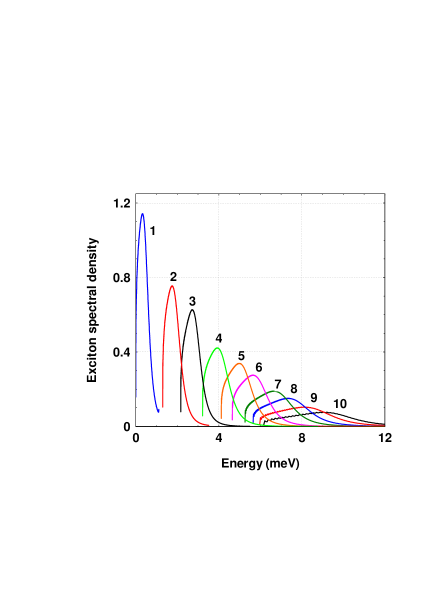
In Fig. 4 we present the transformed spectra of Fig.3 after the first-order rigid shift due to exchange interaction, the phase-space filling effect, as well as the decrease of the oscillator strength are all taken into account. The shape of the exciton absorption band can be represented in this case as
| (26) |
where is given by Eq.(16). The position of the exciton ground state at zero temperature and electron concentration equal to cm-2 is taken as the point of reference.
The parameters used in our calculations are presented in Table I.
IV Comparison with experimental data
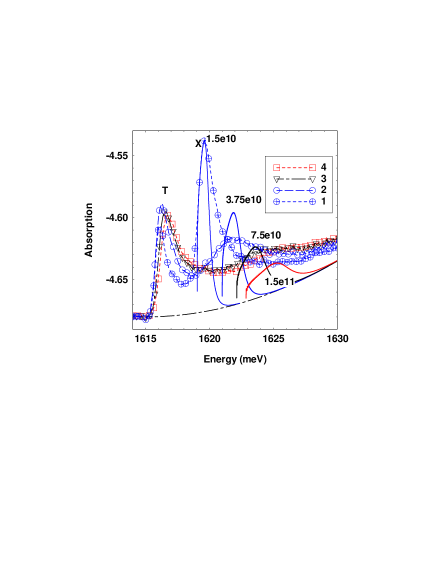
We have compared the above theory with optical absorption data at 2K for a 10 nm CdTe/CdMgTe single quantum well at zero magnetic field. This sample was grown by Molecular Beam epitaxy on a CdTe0.88Zn0.12Te substrate. The alloy substrate is transparent to about 1640 meV, allowing direct measurements of the optical transmission spectrum in the energy region (1610-1630 meV) of the heavy-hole exciton in the CdTe quantum well. Also, the substrate imposes a large biaxial strain on the CdTe well layer, splitting off light-hole transitions to high energies, which simplifies the optical spectrum. The upper CdMgTe barrier was doped with donors so as to give cm-2 in the well in equilibrium. FootnoteMn
Optical data for this sample were provided by Ronald Cox of Nel Institute. During the optical transmission measurements, done using a tungsten lamp source, the electron concentration could be varied down to a low value by pumping the sample with blue laser light. The precise dependence of on pumping light intensity was not known but the minimum concentration was estimated to be in the range cm-2 as judged from the intensity of the (trion) resonance.
For comparison with this experimental data we will use spectra of Fig.4 fitting the absolute exciton energy. Results are presented in Fig.5. As it is seen, the shift of the exciton maximum agrees well with experimental data if we take the electron concentration for the lowest band equal to cm-2 and for the highest one to cm-2. The lowest value appears to be slightly less than the value estimated in experiment cm-2) while the upper value agrees well with experimental data.
However, the experimental broadening values exceed notably the calculated values for all the samples. This may be attributed to the existence of some additional broadening mechanism which was not taken into account in our calculations.
The existence of an additional mechanism of exciton state decay might be assumed because the ground exciton state is not the lowest bound state in the presence of the Fermi sea. At least the trion state might serve as such a state. Another reason for the deviation could be the forced simplifications admitted in our calculations.
Conclusion
The shift and broadening of the exciton absorption bands in CdTe/CdMgTe quantum wells as a function of the free carrier concentration at zero magnetic field is investigated. It is shown that the exciton’s shift and broadening behavior is related to the Hartree-Fock exchange interaction between the electron bound to the valence band hole and the free carriers. This is in contrast to the case of the charged trion, where it is the Coulomb interaction with the free electrons that plays the leading role. The calculations performed have shown that reasonable agreement can be obtained with experimental data.
We wish to thank Dr. R. Cox for the experimental data used in the paper and for many helpful discussions.
References
- (1)
- (2) G.D.Mahan, Phys. Rev. 153, 882 (1967).
- (3) S.Schmitt-Rink, C.Ell, and H.Haug Rhys.Rev. B 33, 1183 (1986).
- (4) S.Schmitt-Rink, D.S. Chemla, and D.A.B.Miller, Advances in Physics 38, 89 (1989).
- (5) P.Hawrylak,Phys. Rev. B 44, 3821 (1991).
- (6) G. E. W. Bauer,Phys. Rev. B 45, 9153 (1992).
- (7) V. Huard, R. T. Cox, K. Saminadayar, A. Arnoult and S. Tatarenko,Phys. Rev. Lett. 84, 187 (2000).
- (8) R.T. Cox, V. Huard, C. Bourgognon, K. Saminadayar, S. Tatarenko and R.B. Miller, Acta Physica Polonica A 106, 287 (2004).
- (9) R.T. Cox, R. B. Miller, K. Saminadayar,T. Baron, Phys. Rev. B 69, 235303 (2004)
- (10) F. J. Teran, Y. Chen, M. Potemski, T. Wojtowicz, and G. Karczewski, Phys.Rev. B 73, 115336 (2006).
- (11) S. I. Gubarev, O. V. Volkov, V. A. Koval’skii, D. V. Kulakovskii, I. V. Kukushkin, JETP Lett. 76, 575 (2002).
- (12) M. Combescot, O. Betbeder-Matibet, M.A. Dupertuis, Solid State Communications, 147, 474 (2008).
- (13) M. Combescot, O. Betbeder-Matibet, and F. Dubin, Eur. Phys. J. B 42, 63 (2004).
- (14) M. Combescot, O. Betbeder-Matibet, Solid State Communications 126, 687 (2003).
- (15) Shiue-Yuan Shiau, Monique Combescot, and Yia-Chung Chang1, Phys. Rev. B 86, 115210 (2012).
- (16) A.A. Klochikhin,V.P. Kochereshko, L. Besombes, G. Karczewski, T. Wojtowicz, J. Kossut, Phys. Rev. B 83, 23 (2011).
- (17) S. Schmitt-Rink, C. Ell, S. W. Koch, H. E. Schmidt, and H. Haug, Solid State Commun. 52, 123 (1984).
- (18) D.A.Kleinmann and R.C. Miller, Phys.Rev. B 32, 2266 (1985).
- (19) S. Das Sarma, R. Jalabert, and S.-R. Eric Yang, Phys.Rev. B 41, 8288 (1990).
- (20) Gerrit E.Bauer and Tsuneya Ando, J. Phys. C: Solid State Phys. 19, 1537 (1986).
- (21) D. Pines and P. Nozieres. The theory of quantum liquids. Vol.1 Normal Fermi Liquids. W.A.Benjamin,inc. NY,Amsterdam (1966).
- (22) This CdTe well was doped with 0.3%Mn, for studying electron spin-polarization effects in magnetic field. This was of no concern for the present analysis of zero field spectra: the very low concentration of Mn does not significantly broaden the exciton resonance.