Cutoff in the hard X-ray spectra of the ultraluminous X-ray sources HoIX X-1 and M82 X-1
Аннотация
Using data from the XMM-Newton and INTEGRAL observatories, we have detected a cutoff at energies above 10 keV in the X-ray spectra of the ultraluminous X-ray sources HoIX X-1 and M82 X-1. The spectra obtained can be described by a model of Comptonization of radiation in a gas cloud of moderate temperature (–3 keV) and high optical depth (–25). Such conditions can be fulfilled during supercritical accretion of matter onto a stellar-mass black hole accompanied by a strong gas outflow. The results of this work confirm the existence of a spectral state specific to ultraluminous X-ray sources, which is unlike any of the known spectral states in normal X-ray binaries.
\englishkeywordsblack holes, accretion, Comptonization, ultraluminous X-ray sources
10 марта 2024 г.
1 Introduction
| Program | Revolution or observation | Dates | Exposure (ks) |
| INTEGRAL | |||
| Archive | 131–133, 179, 180, 250 | 10–17.11.2003,2–6.4, | 750 |
| 30–31.10.2004 | |||
| 0720010 | 856–862, 868-872, 932, 933, 977 | 17.10.–6.12.2009, 1–5.6, | 1930 |
| 15–16.10.2010 | |||
| 0820030 | 1029,1031,1033,1036,1037,1042, | 18.3.–24.5., 23.9.–2.12.2011 | 1540 |
| 1046,1048,1049,1051,1092,1093, | |||
| 1111,1112,1114,1115 | |||
| 0920014 | 1225,1226,1228-1231,1233,1234, | 26.10.2012–20.1.2013 | 1690 |
| 1237–1241,1244,1254 | |||
| XMM-Newton | |||
| 065780 (HoIX X-1) | 2001 | 24.03.2011 | 28 |
| 1601 | 17.04.2011 | 21 | |
| 1801 | 26.09.2011 | 25 | |
| 2201 | 23.11.2011 | 24 | |
| 065780 (M82 X-1) | 0101 | 18.03.2011 | 27 |
| 1701 | 9.04.2011 | 24 | |
| 1901 | 29.04.2011 | 28 | |
| 2101 | 24.09.2011 | 23 | |
| 2301 | 21.11.2011 | 24 | |
Ultraluminous X-ray sources (ULXs) are point-like X-ray sources observed in extra-nuclear regions of nearby galaxies, whose luminosities exceed erg/s. Their nature remains unknown. Two scenarios are being actively discussed: subcritical (at a rate below the Eddington limit) accretion onto a black hole of intermediate, , mass (IMBH, see, e.g., Miller et al. 2003) and supercritical accretion onto a black hole of stellar, less than a few tens of , mass (StMBH, see, e.g., Poutanen et al. 2007), possibly with substantial collimation of radiation toward the observer (e.g., King 2009). Both scenarios are of great interest, since in the former case, there appears an opportunity to explore the conditions that may reflect an intermediate phase of supermassive black hole growth, and in the latter case, an extreme regime of gas accretion onto black holes. It cannot be excluded that the former scenario is realized in some ULXs, while the latter in others.
So far, X-ray observations of ULXs have been carried out almost exclusively at energies below 10 keV, and many spectra measured in the 2–10 keV energy band could be described by a simple power law with a slope (see, e.g., Kajava, Poutanen 2009). Below 2 keV, an additional soft component with a color temperature of several hundred eV was sometimes detected. It was suggested that this component could be thermal emission from a geometrically thin, optical thick accretion disk around an IMBH, analogous to the hotter ( keV) radiation observed from normal X-ray binaries in their soft/high state. If so, the lower temperature of the disk could imply (Shakura, Sunyaev, 1973) a higher mass of the compact object in ULXs compared to X-ray binaries, whereas the power-law component in ULX spectra could be attributed to Comptonized radiation from an optically thin, hot corona of the accretion disk.
However, this picture faces certain difficulties. In particular, a number of ULX spectra obtained in long observations by Chandra and XMM-Newton are poorly described by a power law and have convex shape in the 2–10 keV energy band. If one describes such spectra in terms of blackbody radiation from a thin accretion disk, the temperature near its inner boundary proves to be 2–3 keV. Such values could be expected, at high accretion rates, for StMBHs, but certainly not for IMBHs. However, the measured ULX luminosites are erg/s, which exceeds the Eddington limit for a compact object of stellar mass. Therefore, an alternate scenario for ULXs has been actively discussed, namely supercritical accretion of matter onto a StMBH through a geometrically thick disk with a powerful gas outflow (see, e.g., Poutanen et al. 2007). In this case, the unusual X-ray spectral shape at energies above 2 keV is interpreted as the result of Comptonization of the relatively soft emission from the accretion disk in an optically thick corona and/or outflowing wind (Stobbart et al., 2006; Gladstone et al., 2009; Feng, Soria, 2011).
Measurements in the hard X-ray range could help advance the understanding of the nature of ULXs. However, such observations were impossible until recently, because even the brightest ULXs have X-ray fluxes of less than 1 mCrab in the 2–10 keV energy band and are often located in sky regions with high number density of X-ray sources. The capabilities of the INTEGRAL observatory (Winkler et al., 2003), namely the combination of relatively high sensitivity and good angular resolution, have made it possible to overcome these difficulties for the first time. However, even in this case very long exposures are required. Beginning in late 2009, following our proposal, within the Russian share of observing time, INTEGRAL has been performing deep observations at energies above keV of a sky region containing the M81 group of galaxies. The targets of these observations are the nucleus of the M81 galaxy and two well-known ULXs: HoIX X-1 (also known as M81 X-9) and M82 X-1. Interestingly, although both of these ULXs are among the brightest over the whole sky in terms of both flux and luminosity, they are located within one degree of each other. Up to now, data for nearly 6 Ms worth of observations have been accumulated. Within the same scientific program, the XMM-Newton X-ray observatory performed a series of observations of HoIX X-1 and M82 X-1 in 2011. The main goal of the coordinated observations by INTEGRAL and XMM-Newton was to build the X-ray spectra of the aforementioned ULXs in a broad energy range from eV up to several tens of keV. In the present paper, we report the results of these observations.
In what follows, we adopt the distance to HoIX X-1 to be 3.6 Mpc, which is the distance to the M81 galaxy (Freedman et al., 1994), whose satellite is the HoIX dwarf galaxy, and that to M82 X-1 to be 3.5 Mpc (the distance to the M82 galaxy, Jacobs et al. 2009).
Observations of the M81 field started in the 7th cycle of INTEGRAL observations (AO-7) and were continued in the 8th and 9th cycles (AO-8 and AO-9). Another series of observations of this region of the sky is planned to take place in late 2013, within the 10th observational cycle of the INTEGRAL observatory (AO-10). In Table 1, information about the dates and duration of the observations performed so far is collected. The total accumulated exposure is Ms (nominal exposure, uncorrected for the decrease in efficiency for off-axis observations of the sources) for the IBIS/ISGRI instrument. This time includes ks of archival data obtained in 2003–2004, when HoIX X-1 and M82 X-1 occasionally fell into the outer regions of the field of view (7–9 deg off-axis) of the ISGRI detector. These archival data were taken into account in our analysis, although they barely increase the detection significance of the studied objects.
2 Observations
In 2011, the XMM-Newton observatory carried out two series of observations of HoIX X-1 and M82 X-1, consisting of 4 and 5 pointings, respectively, with a duration of about 25 ks each. Table 1 contains some key information about these observations. These observations were performed in time intervals that approximately coincided with the INTEGRAL observations (of much longer duration) performed during AO-8, hence one can regard the X-ray and hard X-ray observations carried out in 2011 as quasi-simultaneous.
In the present work, we used only the data of the IBIS/ISGRI detector (Ubertini et al., 2003) from all the data obtained by INTEGRAL. We have also analyzed the data from the JEM-X instrument, but this has not provided any additional strong constraints on the X-ray flux from HoIX X-1 and M82 X-1 at energies above 10 keV. We therefore built our analysis upon comparison of the XMM and ISGRI data.
3 Data reduction, X-ray images
3.1 INTEGRAL
Initial reduction of the ISGRI data consisted of reconstruction of sky images of the M81 field in a number of energy bands (20–30, 30–45, 45–68, … keV) using the standard algorithm (Krivonos et al., 2010) utilized in a number of our previous studies. Calibration of measured source X-ray fluxes was done using archival data of ISGRI observations of the Crab Nebula.
Figure 1 shows an image of the M81 field in the 20–30 keV energy band, constructed using all the data obtained by ISGRI from October 2009 to January 2013. The M82 X-1 source is detected at a significance level. Its flux in the 20–30 keV energy band is mCrab, which corresponds to erg/s/cm2, assuming a Crab-like spectrum. Under the assumption of isotropical radiation, the luminosity of M82 X-1 in the 20–30 keV range is erg/s. M82 X-1 is practially undetected () in the next energy band (30–45 keV), nor in the higher energy bands. The HoIX X-1 source is not detected even in the softest ISGRI energy band, the upper limit (2) on its 20–30 keV flux being 0.25 mCrab, or erg/s/cm2 (assuming a Crab-like spectrum). Hence, the luminosity of HoIX X-1 in the 20–30 keV energy band does not exceed erg/s.
At a distance of just 13 arcmin from HoIX X-1, there is a relatively bright hard X-ray source whose position is consistent with that of the nucleus of the M81 galaxy. This object belongs to the class of low-luminosity active galactic nuclei and its study in the hard X-ray range is of great interest but beyond the scope of the present work. Because of the proximity to M81, studies of HoIX X-1 in the hard X-ray range were practically impossible before the advent of INTEGRAL. The angular resolution of the BAT telescope aboard Swift is also insufficient for this purpose.
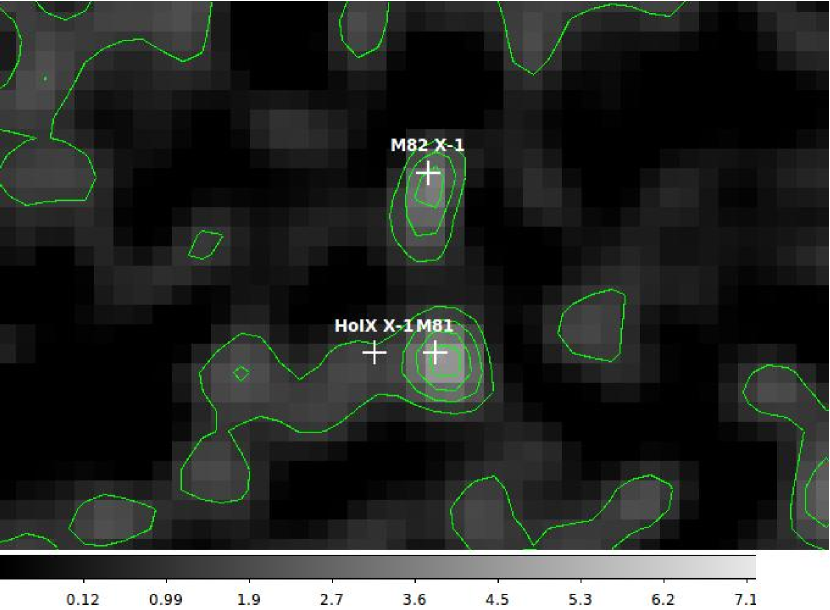
Figure 2 shows the light curves of HoIX X-1 and M82 X-1 in the 20–30 keV energy band obtained using the ISGRI data. It is seen that the sources remained weaker than mCrab during the observations in 2003–2013, although the data are of insufficient quality to judge about the variability of the studied objects.

3.2 XMM-Newton
The reduction of the data obtained by the MOS1, MOS2, and pn instruments aboard XMM-Newton was done using the standard software SAS v.11111http://xmm2.esac.esa.int/sas/. Since thee were no strong proton flares during our observations, data filtering was done in a standard way.
Figure 3 shows examples of images obtained with the pn detector of the EPIC camera in individual observations of HoIX X-1 and M82 X-1 in 2011. A bright X-ray source is detected in the direction of HoIX X-1, whose angular size is compatable with the signal expected from a point source. There are no other noticeable X-ray sources near HoIX X-1. This probably reflects the fact that the object is located on the outskirts of the dwarf galaxy HoIX (see, e.g., Grisé et al. 2011). Similarly, there is strong emission from the direction of M82 X-1, which can be attributed to the ULX at hand, however this signal is overlaid on a bright background created by the M82 galaxy. This background likely consists of a large number of unresolved faint objects and diffuse emission from the interstellar gas. As is shown below, the contribution of the galactic background can be taken into account during the analysis of the M82 X-1 X-ray spectrum obtained from the XMM-Newton data.
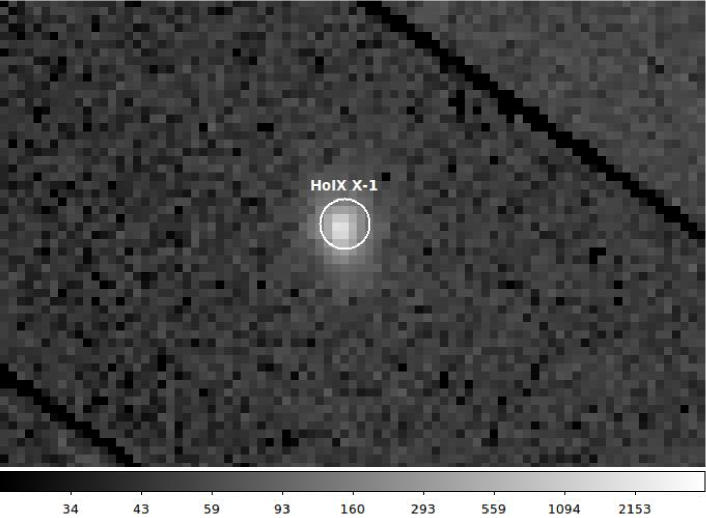
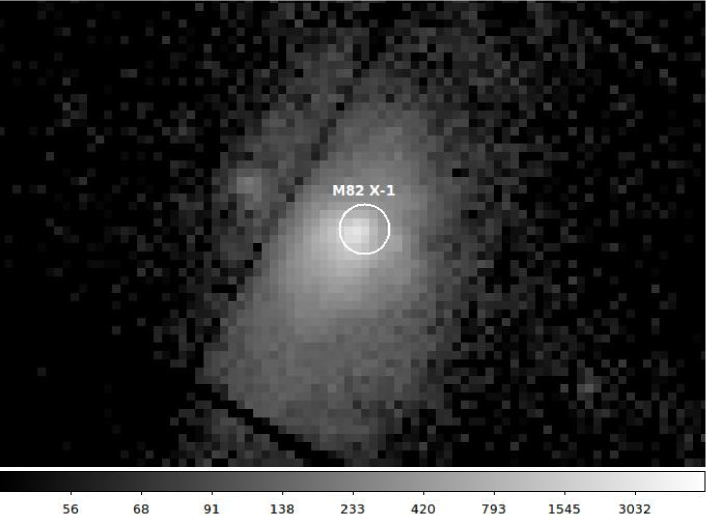
For the subsequent spectral analysis, we used the counts recorded within the circles of 13’’ radius around HoIX X-1 and M82 X-1 (see Fig. 3). This region contains % of all the photons from a point source, and this apperture coefficient was taken into account during the spectral analysis. To estimate the background unrelated to the emission of the host galaxy, we used regions located at distances –3’ from the studied objects. Because M82 X-1 is located in the central region of the M82 galaxy, even the compact (13’’) spectrum-extraction region contains a number of other fairly bright X-ray sources, known from arcsec-resolution observations with the Chandra telescope. Unfortunately, it is impossible to remove the contribution of these sources during the analysis of the XMM-Newton data. However, the Chandra data suggest that this contribution is unlikely to exceed % (Matsumoto et al., 2001).
4 Spectral analysis
4.1 HoIX X-1
Figure 4 shows the X-ray spectra of HoIX X-1 measured with XMM-Newton during the four observations carried out in 2011 (see Table 1), as well as the hard X-ray fluxes in the 20–35 and 35–50 keV energy bands obtained using the ISGRI data for the whole period of INTEGRAL observations.
We first carried out a spectral analysis of the XMM-Newton data only, in the 0.2–13 keV energy band. To this end, we used the XSPEC package (Arnaud, 1996). A given model was fitted simultaneously to the data from all three X-ray cameras, pn, MOS1, and MOS2, allowing the model normalization to differ between the detectors. The resulting differences in the normalization proved to be less than 10%, and the data of the three detectors showed a good mutual agreement. Each of the four spectra shown in Fig. 4 is the result of averaging over the pn, MOS1, and MOS2 data; a similar averaging was done for the corresponding spectral models.

As can be seen from Fig. 4, the X-ray spectrum of HoIX X-1 varied significantly over 2011. The first spectrum, obtained on March 24, exhibits a local maximum near 1 keV and a power-law continuum at higher energies. This spectrum is well fit (see Table 2) by a sum of a model of blackbody radiation from a multi-temperature accretion disk and a power law with an exponential cutoff at high energies, modified by absorption along the line of sight, i.e., by the wabs(diskbb+cutoffpl) model in XSPEC. However, the statistical significance of the detection of a cutoff is low: replacement of the powerlaw model by cutoffpl, i.e., addition of one degree of freedom, leads to a decrease of the value by only 6. The paramaters of the diskbb model are a normalization and the temperature () at the inner boundary of the multicolor disk. Our analysis assumed that the disk is observed along its axis.
| Parameter | XMM2001 (+ISGRI) | XMM1601 (+ISGRI) | XMM1801 (+ISGRI) | XMM2201 (+ISGRI) |
|---|---|---|---|---|
| wabs(diskbb+powerlaw) | ||||
| () | () | () | () | |
| (d.o.f) | 947.1/936 (979.9/938) | 642.3/626 (664.6/628) | 1580.9/1464 (1570.0/1466) | 1281.5/1273 (1514.0/1275) |
| wabs(diskbb+cutoffpl) | ||||
| , cm-2 | ||||
| (0.2–10 keV), | ||||
| erg/s/cm2 | ||||
| (0.2–10 keV), | ||||
| erg/s | ||||
| , keV | 0.3 (fixed) | 0.3 (fixed) | ||
| (0.2–10 keV), | ||||
| erg/s/cm2 | ||||
| (0.2–10 keV), | ||||
| erg/s | ||||
| () | () | () | () | |
| , keV | () | () | () | () |
| (d.o.f.) | 941.1/935 (941.7/937) | 641.3/625 (641.9/627) | 1454.8/1463 (1456.1/1465) | 1242.7/1272 (1243.7/1274) |
| wabs(diskbb+compst) | ||||
| , keV | () | () | () | () |
| () | () | () | () | |
| (d.o.f.) | 944.4/935 (946.2/937) | 641.5/625 (642.6/627) | 1473.5/1463 (1478.2/1465) | 1248.1/1272 (1250.3/1274) |
In the subsequent XMM-Newton observation (April 17, 2011), the blackbody component is barely detected (the detection significance is just above 2), nor is detected a high-energy cutoff of the power-law continuum. Hence, this spectrum can be described, over the 0.2–13 keV energy band, by a simple power law with absorption. In the latest two observations (September 26 and November 23, 2011), the soft blackbody component is again barely detected (the detection significance is – when the temperature at the inner boundary of the disk is fixed at 0.3 keV), however a rollover of the power-law continuum becomes evident above –10 keV (see Fig. 4 and Table 2).
Table 2 summarizes, for all four XMM-Newton observations, the unabsorbed fluxes and luminosities of the blackbody and power-law (with a cutoff) spectral components in the 0.2–10 keV energy band (, , , ). The total luminosity of HoIX X-1 in this energy range increased over the observing campaign from to erg/s, the luminosity of the blackbody component being erg/s. The deduced line-of-sight absorption columns, cm-2, somewhat exceed the corresponding value for the interstellar absorption through the Galaxy in the direction of the M81 group of galaxies, cm-2 (Kalberla et al., 2005), indicating the presence of cold gas near HoIX X-1.
The presence of a strong cutoff in the spectrum of HoIX X-1 at energies above –10 keV becomes evident from comparison of the XMM-Newton data with the upper limits on the hard X-ray flux in the 20–30 and 30–45 keV energy bands obtained with the ISGRI detector aboard INTEGRAL (see Fig. 4). Joint fitting of the data of both observatories allows us to fully exclude a power-law spectral model from consideration and reliably establish the position of the cutoff in the hard X-ray spectrum: keV (see Table 2). Reasonable values of per degree of freedom obtain when the ISGRI data are fitted jointly with any of the four XMM-Newton spectra. However, one should keep in mind that the latter data, obtained in individual observations lasting less than a day, are here compared with ISGRI measurements averaged over several Ms and accumulated in various years.
A natural mechanism to explain power-law spectra with a high-energy cutoff is Comptonization of soft radiation on hot electrons. We thus tried to describe the XMM-Newton spectra of HoIX X-1 by a model that, together with a blackbody component, includes a component of Comptionized radiation emergent from a cloud of hot gas (Sunyaev, Titarchuk, 1980) – the wabs(diskbb+compst) model in XSPEC. This model desribes the data well, albeit somewhat worse that the wabs(diskbb+cutoffpl) model (see Table 2). The resulting gas temperature is –3 keV and the optical depth of the cloud is .
4.2 M82 X-1

| Parameter | XMM0101 | XMM1701 | XMM1901 | XMM2101 | XMM2301 |
|---|---|---|---|---|---|
| (+ISGRI) | (+ISGRI) | (+ISGRI) | (+ISGRI) | (+ISGRI) | |
| wabs(apec+cutoffpl) | |||||
| () | () | () | () | () | |
| , keV | |||||
| () | () | () | () | () | |
| (d.o.f.) | 1547.9/1491 | 1315.4/1326 | 1433.2/1270 | 1294.8/1219 | 1746.2/1657 |
| (1554.3/1493) | (1323.5/1328) | (1436.3/1272) | (1305.4/1221) | (1748.0/1659) | |
| wabs(apec+compst) | |||||
| , cm-2 | |||||
| (1–10 keV), | |||||
| erg/s/cm2 | |||||
| (1–10 keV), | |||||
| erg/s | |||||
| , keV | |||||
| (1–10 keV), | |||||
| (1–10 keV), | |||||
| , keV | |||||
| () | () | () | () | () | |
| () | () | () | () | () | |
| (d.o.f.) | 1506.9/1491 | 1297.6/1326 | 1389.69/1270 | 1275.7/1219 | 1654.5/1657 |
| (1518.5/1493) | (1309.60/1328) | (1401.1/1272) | (1288.6/1221) | (1660.2/1659) | |
| wabs(apec+diskbb) | |||||
| , keV | |||||
| () | () | () | () | () | |
| (d.o.f.) | 1541.5/1492 | 1425.2/1271 | 1298.8/1220 | 1763.8/1658 | |
| (1549.3/1494) | (1340.7/1329) | (1435.2/1273) | (1308.6/1222) | (1767.9/1660) | |
We carried out a similar analysis for M82 X-1. There is a significant difference with respect to the previous case, namely that the spectra obtained with XMM-Newton contain an unsubtracted contribution from the background emission associated with the host galaxy M82. The presence of a large number of strong emission lines clearly suggests that this additional emission is thermal radiation from an optically thin, hot plasma. We have thus added an APEC (Smith et al., 2001) component into the spectral model, assuming Solar chemical composition and further restricted our consideration by energies above 1 keV, since at lower energies the contribution of the background emission becomes dominat and does not enable reliable extraction of the emission associated with M82 X-1. This, unfortunately, precludes finding out whether the M82 X-1 spectrum contains a soft blackbody component similar to that found in HoIX X-1.
To describe all five XMM-Newton spectra of M82 X-1, it is necessary to take into account photoabsorption at low energies, with cm-2. This value significantly exceeds the interstellar absorption through the Galaxy in the given direction, cm-2 (Kalberla et al., 2005), indicating the presence of cold gas near M82 X-1. All five spectra clearly exhibit a rollover at high energies, hence we used the following spectral model in our analysis: wabs(apec+cutoffpl). The results of fitting by this model prove to be quite satisfactory (based on ) and are quoted in Table 3. Even better results obtain when using a model of Comptonized radiation from a hot cloud (Sunyaev, Titarchuk, 1980), i.e., when fitting the spectra by the wabs(apec+compst) model in XSPEC.
We have also attempted to describe the hard X-ray continuum by an alternate model of blackbody radiation from a hot (–4 keV) accretion disk, i.e, to apply the wabs(apec+diskbb) model. This model describes some of the spectra nearly as well as the wabs(apec+cutoffpl) model, albeit significantly worse than the wabs(apec+compst) model.
The addition of ISGRI spectral points at energies above 20 keV leads to an interesting result. All the model spectra determined by fitting the XMM-Newton data lie below the ISGRI points. This can be inetrpreted as the presence of an additional hard X-ray component in the source’s spectrum. However, the statistical significance of this excess is low (about ). It is not unlikely that the additional hard X-ray flux is due to other point sources in the central region of the M82 galaxy, which cannot be separated from M82 X-1 using XMM-Newton data. In any case, comparison of the hard X-ray flux measured by ISGRI with the XMM-Newton spectra clearly implies a cutoff in the X-ray spectrum of M82 X-1 at energies above keV.
5 Discussion
Using data of the XMM-Newton and INTEGRAL observatories, we have detected a cutoff at energies above 10 keV in the spectra of the ultraluminous X-ray sources HoIX X-1 and M82 X-1. Previously, there were indications of the existence of such a cutoff in the spectra of these sources from observations with the Suzaku observatory (Miyawaki et al., 2009; Dewangan et al., 2013), however the crude angular resolution of the PIN instrument precluded reliable separation of the hard X-ray fluxes of the ULXs and the low-luminosity active galactic nucleus M81.
The derived broad-band X-ray spectra can be well described by a model of Comptonization of radiation in a cloud of gas of moderate temperature and large optical depth: keV, for HoIX X-1, and keV, for M82 X-1. These values indicate that the Comptonization takes place in a nearly saturated regime (the Comptonization parameter –10, see, Sunyaev, Titarchuk 1980). Such conditions are quite unusual for the hot coronae of accretion disks in normal X-ray binaries (where accretion onto a StMBH at a subcritical rate occurs), but can be fulfilled during supercritical accretion of matter onto an IMBH accompanied by a strong outflow of gas from the central regions (Shakura, Sunyaev, 1973; Ohsuga et al., 2005; Poutanen et al., 2007). In this case, the soft emission component with a characteristic temperature of keV detected from HoIX X-1 by XMM-Newton can be related to regions of a thin accretion disk that are open to the observer (beyond the spherization radius of the accretion flow) or with the photosphere of the wind outflowing from the disk.
Therefore, the reported results of XMM-Newton and INTEGRAL observations confirm the existence of a spectral state (Stobbart et al., 2006; Gladstone et al., 2009) specific to ultraluminous X-ray sources, which is unlike any of the spectral states known for normal X-ray binaries.
For M82 X-1, we have found an indication of an additional hard X-ray emission component. This radiation may hint at the presence in the inner part of the supercritical accretion flow of a hot corona similar to the coronae of accretion disks in X-ray binaries. However, this excess may also be associated with the unsubtracted contribution of other fairly bright X-ray sources in the central region of the starforming galaxy M82, which are resolved by Chandra (Matsumoto et al., 2001).
Given the findings of this study, we are awaiting with great interest the upcoming announcement of the results of hard X-ray observations of a number of ULXs by the new-generation observatory NuSTAR, whose high sensitivity and angular resolution enable detailed studies of ULX spectral properties at energies above 10 keV for the first time.
Acknowledgements.
This research was partially supported by the Ministry of Science and Education of the Russian Federation (contract 8701), Russian Foundation for Basic Research (grant 13-02-01365), programs P-21 and OFN-17 of the Presidium of the Russian Academy of Sciences, and program NSh-6137.2014.2 for support of leading scientific schools in Russia. The research made use of data obtained from the Russian INTEGRAL Data Center and XMM-Newton Data Center. The authors are grateful to Eugene Churazov for developing the methods of analysis of INTEGRAL/IBIS data and providing the software.Список литературы
- (1)
- Arnaud (1996) K.A. Arnaud, Astronomical Data Analysis Software and Systems V 101, 17 (1996).
- Dewangan et al. (2013) G.C. Dewangan, V. Jithesh, R. Misra, C.D. Ravikumar, ApJ 771, L37 (2013).
- Feng, Soria (2011) H. Feng and R. Soria, New Astron. Reports 55, 166 (2011).
- Freedman et al. (1994) W.L. Freedman, S.M. Hughes, B.F. Madore, J.R. Mould, M.G. Lee, P. Stetson, R.C. Kennicutt, A. Turner, L. Ferrarese, H. Ford, J.A. Graham, R. Hill, J.G. Hoessel, J. Huchra, G.D. Illingworth, ApJ 427, 628 (1994).
- Gladstone et al. (2009) J.C. Gladstone, T.P. Roberts, C. Done, MNRAS 397, 1836 (2009).
- Grisé et al. (2011) F. Grisé, P. Kaaret, M.W. Pakull, C. Motch, ApJ 734, 23 (2011).
- Jacobs et al. (2009) B.A. Jacobs, L. Rizzi, R.B. Tully, E.J. Shaya, D.I. Makarov, L. Makarova, AJ 138, 332 (2009).
- Kajava, Poutanen (2009) J.J.E. Kajava and J. Poutanen, MNRAS 398, 1450 (2009).
- Kalberla et al. (2005) P.M.W. Kalberla, W.B. Burton, D. Hartmann, E.M. Arnal, E. Bajaja, R. Morras, W.G.L. Pöppel, A&A 440, 775 (2005).
- King (2009) A.R. King, MNRAS 393, L41 (2009).
- Krivonos et al. (2010) R. Krivonos, M. Revnivtsev, S. Tsygankov, S. Sazonov, A. Vikhlinin, M. Pavlinsky, E. Churazov, R. Sunyaev, A&A 519, A107 (2010).
- Matsumoto et al. (2001) H. Matsumoto, T.G. Tsuru, K. Koyama, H. Awaki, C.R. Canizares, N. Kawai, S. Matsushita, R. Kawabe, ApJ 547, L25 (2001).
- Miller et al. (2003) J.M. Miller, G. Fabbiano, M.C. Miller, A.C. Fabian), ApJ 585, L37 (2003).
- Miyawaki et al. (2009) R. Miyawaki, K. Makishima, S. Yamada, P. Gandhi, T. Mizuno, A. Kubota, T.G. Tsuru, H. Matsumoto, Publ. Astron. Soc. Japan, 61, 263 (2009).
- Ohsuga et al. (2005) K. Ohsuga, M. Mori, T. Nakamoto, S. Mineshige, ApJ 628, 368 (2005).
- Poutanen et al. (2007) J. Poutanen, G. Lipunova, S. Fabrika, A.G. Butkevich, P. Abolmasov, MNRAS 377, 1187 (2007).
- Shakura, Sunyaev (1973) N.I. Shakura and R.A. Sunyaev, A&A 24, 337 (1973).
- Smith et al. (2001) R.K. Smith, N.S. Brickhouse, D.A. Liedahl, J.C. Raymond, ApJ 556, L91 (2001).
- Stobbart et al. (2006) A.M. Stobbart, T.P. Roberts, J. Wilms, MNRAS 368, 397 (2006).
- Sunyaev, Titarchuk (1980) R.A. Sunyaev and L.G. Titarchuk, A&A 86, 121 (1980).
- Ubertini et al. (2003) P. Ubertini, F. Lebrun, G. Di Cocco, A. Bazzano, A.J. Bird, K. Broenstad, A. Goldwurm, G. La Rosa, C. Labanti, P. Laurent, I.F. Mirabel, E.M. Quadrini, B. Ramsey, V. Reglero, L. Sabau, B. Sacco, R. Staubert, L. Vigroux, M.C. Weisskopf, A.A. Zdziarski, A&A 411, L131 (2003).
- Winkler et al. (2003) C. Winkler, T. J.-L. Courvoisier, G. Di Cocco, N. Gehrels, A. Giménez, S. Grebenev, W. Hermsen, J.M. Mas-Hesse, F. Lebrun, N. Lund, G.G.C. Palumbo, J. Paul, J.-P. Roques, H. Schnopper, V. Schönfelder, R. Sunyaev, B. Teegarden, P. Ubertini, G. Vedrenne, A.J. Dean, A&A 411, L1 (2003).