Weak maser emission of methyl formate toward Sagittarius
B2(N)
in the Green Bank Telescope PRIMOS Survey
Abstract
A non-LTE radiative transfer treatment of cis–methyl formate (HCOOCH3) rotational lines is presented for the first time using a set of theoretical collisional rate coefficients. These coefficients have been computed in the temperature range 5–30 K by combining coupled-channel scattering calculations with a high accuracy potential energy surface for HCOOCH3–He. The results are compared to observations toward the Sagittarius B2(N) molecular cloud using the publicly available PRIMOS survey from the Green Bank Telescope. A total of 49 low-lying transitions of methyl formate, with upper levels below 25 K, are identified. These lines are found to probe a presumably cold ( K), moderately dense ( cm-3) and extended region surrounding Sgr B2(N). The derived column density of cm-2 is only a factor of 10 larger than the column density of the trans conformer in the same source. Provided that the two conformers have the same spatial distribution, this result suggests that strongly non-equilibrium processes must be involved in their synthesis. Finally, our calculations show that all detected emission lines with a frequency below 30 GHz are (collisionally pumped) weak masers amplifying the continuum of Sgr B2(N). This result demonstrates the importance and generality of non-LTE effects in the rotational spectra of complex organic molecules at centimetre wavelengths.
1 Introduction
Interstellar methyl formate (HCOOCH3) was discovered almost 40 years ago, in its most stable cis–isomeric form, in the spectrum of the giant molecular cloud complex Sagittarius B2 (Brown et al., 1975; Churchwell & Winnewisser, 1975). Since its discovery, it has been detected in a great variety of galactic sources including hot molecular cores, comets and cold prestellar cores (Bottinelli et al., 2007; Favre et al., 2011; Bockelée-Morvan et al., 2000; Bacmann et al., 2012; Cernicharo et al., 2012). Methyl formate is a prolate asymmetric top molecule isomeric with acetic acid and glycolaldehyde. The two latter have also been identified in space (Mehringer et al., 1997; Hollis et al., 2000) but they are much less ubiquitous and abundant. This result strongly suggests that the synthesis of methyl formate is controlled by kinetic factors, since acetic acid is thermodynamically the most stable of the three isomers (Dickens et al., 2001). The chemical origin of methyl formate is however matter of debate.
Laboratory experiments have shown that methyl formate can be formed in the solid state from photolysis or radiolysis of methanol-bearing ices (see Modica et al., 2012, and references therein). Gas-grain chemical models have shown that the surface reaction between the (mobile) HCO and CH3O radicals can provide an association pathway in warm ( 30 K) environments (Garrod & Herbst, 2006). Gas-phase routes involving methanol have also been suggested but none of these were found to produce enough methyl formate to explain its high abundance in hot cores ( 10-9-10-8 relative to total hydrogen) (Horn et al., 2004). Very recently, a new scenario of formation of complex organic molecules was proposed by Vasyunin & Herbst (2013) to explain the abundances observed in cold prestellar cores (10-11-10-10). In this scenario, gas-phase reactions are driven by reactive desorption of precursor species such as methanol and formaldehyde. The predicted abundance for methyl formate is however lower than observations by two orders of magnitude. Finally, the higher energy trans conformational isomer of methyl formate was recently detected toward the Sgr B2(N) molecular cloud, suggesting again a complex and non-equilibrium chemistry (Neill et al., 2012).
In all previous observational studies of methyl formate at millimetre wavelengths, the determination of the column density was obtained by assuming that the relative distribution of the population over all energy levels can be described by a single Boltzmann temperature, referred as the “excitation” or “rotational” temperature. It is well known, however, that the low-frequency line at 1.61 GHz, first detected by Brown et al. (1975), is weakly inverted toward Sgr B2. The populations of the and states are therefore out of any thermal equilibrium in this region. This was postulated by Brown et al. (1975) and evidenced by Churchwell et al. (1980). In fact, soon after the discovery of complex molecules at radio wavelengths in the 1970’s, it was accepted that the many low frequency transitions must be inverted (see Menten, 2004, and references therein). In their pioneering work, Brown et al. (1975) assumed a 1 percent inversion of the and levels of methyl formate to derive the column density. Such a weak inversion, by amplifying the strong background continuum radiation, is sufficient to produce the emission of the otherwise undetectable 1.61 GHz line. The determination of the actual inversion percentage however requires to solve the equations of statistical equilibrium, which in turn necessitates a good knowledge of collisional cross sections. As a result, the accurate determination of column densities from low frequency molecular transitions cannot rely on thermal equilibrium analysis but requires a non-local thermodynamical equilibrium (non-LTE) treatment. This was recognized in the early years of radio-astronomy (e.g. Gottlieb et al., 1973). For all complex molecules except methanol (see Rabli & Flower, 2011, and references therein), however, such treatments have been hampered so far by the lack of accurate collisional cross sections.
Recently, rotational cross sections for methyl formate colliding with He atoms were computed (Faure et al., 2011). To date, these are the first available cross sections for an asymmetric top with eight atoms. In the present work, the corresponding rate coefficients are deduced in the temperature range 5–30 K. Encouraged by the availability of these rate coefficients, we have i) searched for all centimetre wave transitions of methyl formate toward the Sgr B2(N) region and ii) performed non-LTE radiative transfer calculations. All observational data are taken as part of the PRebiotic Interstellar MOlecular Survey (PRIMOS). The rate coefficient calculations are presented in Section 2. In Section 3, the PRIMOS observations are detailed. We compare non-LTE calculations with PRIMOS data in Section 4. Conclusions are drawn in Section 5.
2 Rate coefficient calculations
Quantum scattering calculations for helium interacting with methyl formate were performed recently on the high-accuracy potential energy surface (PES) of Faure et al. (2011), where full details can be found. Helium was employed as a substitute for H2, which is five times more abundant than He. Calculations with He are, however, much less expensive and, in first approximation, cross sections with H2 can be assumed to be equal to those for collisions with helium, as discussed below. The interaction energies were computed at the coupled cluster method with single, double, and noniterative triple excitations, CCSD(T). Symmetry-adapted perturbation theory based on the density-functional description of monomers, SAPT(DFT), was employed to compute the asymptotic, long-range part of the PES. Methyl formate was assumed to be rigid in its experimentally determined geometry. The interaction energies were thus obtained on a three-dimensional grid and they were fitted by an analytic function of interatomic distances with correct asymptotic behavior for large intermonomer separations. This 3D PES was then refitted using a partial wave expansion adapted to close-coupling scattering calculations111The fit of the PES is available upon request from alexandre.faure@obs.ujf-grenoble.fr..
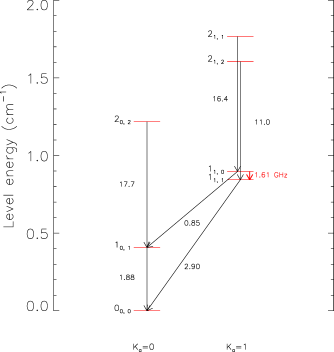
In the ground torsional level, each rotational level of methyl formate is split by tunneling into a doublet, the nondegenerate level, and the doubly degenerate level. Radiative and collisional transitions from an sublevel to an sublevel are however not allowed. The coupling between rotation and torsion is weak and a standard rigid asymmetric top Hamiltonian is adequate to reproduce all levels below the first excited torsional level (i.e. 130 cm-1) with an accuracy better than 0.1 cm-1. The three rotational constants were taken from Curl, Jr. (1959) and are listed in Table III of Faure et al. (2011). The lowest 7 levels of -type HCOOCH3 are shown in Fig. 1. Scattering calculations, which are extremely demanding owing to the dense spectrum of methyl formate, were performed using the OpenMP version of the MOLSCAT code222Repository at http://ipag.osug.fr/~faurea/molscat/index.html at the full close-coupling level. The reduced mass of the system is 3.752371 amu. As the -type and -type transition energies differ by less than 0.1 cm-1, the cross sections for rotational (de)excitation are very similar for the two symmetries, with differences below 5% (Faure et al., 2011). Only cross sections for the -type HCOOCH3 were therefore computed and they can be employed both for -type and -type HCOOCH3. The coupled-channel equations were integrated using the hybrid modified log-derivative Airy propagator of Alexander & Manolopoulos (1987) with a careful check of all propagation parameters. Calculations were performed for total energies between 0.25 and 130 cm-1, i.e. up to the first torsional threshold. The energy grid was adjusted to take into account the presence of low-energy resonances. All calculations also included several energetically closed channels: the basis set incorporated all target states with , i.e., 225 rotational states with the highest level, , at 133.5 cm-1 above the ground state. The cross sections were found to be converged to within 20% (and generally within 510%) for all transitions involving the lowest 65 states, i.e., up to the level at 19.98 cm-1.
Rate coefficients were obtained up to 30 K by integrating the cross sections over Maxwell-Boltzmann distributions of relative velocities:
| (1) |
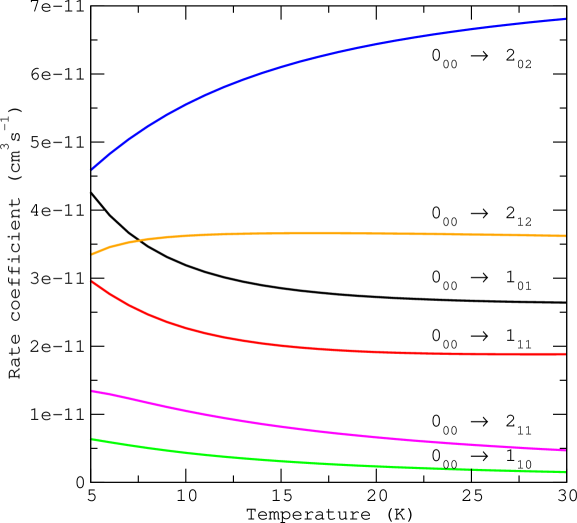
where is the reduced mass of the HCOOCH3-H2 system, , and is the collision energy. We thereby assume that the cross sections for He and H2 are identical and that the rate coefficients differ only for the (square root of the) reduced mass ratio. This approximation is most valid for the ground state of para-H2() and for heavy molecules, as discussed in Wernli et al. (2007). Larger differences are expected between He and ortho-H2(), as observed e.g. in H2CO (Troscompt et al., 2009) and CH3OH (Rabli & Flower, 2011). However, since the ortho state () lies 170 K above the para state (), it should not be significantly populated at the temperatures investigated here (see e.g. Faure et al., 2013). The cross sections were extrapolated at total energies higher than 130 cm-1 in order to guarantee convergence of Eq. (1). A total of 2080 transitions were considered for -type HCOOCH3, corresponding to the lowest 65 levels with upper energies below 20 cm-1. This complete set of (de-)excitation rate coefficients is available online from the LAMDA database (Schöier et al., 2005) at home.strw.leidenuniv.nl/∼moldata/ and BASECOL database (Dubernet et al., 2013) at www.basecol.obspm.fr. Scattering calculations for higher levels (and therefore temperatures) are in progress in our group.
Rate coefficients for the lowest 6 transitions out of the ground state are presented in Fig. 2. We first observe that the favored transition is , corresponding to the propensity rules and . These propensities reflect, respectively, the “even” symmetry of the PES and the conservation of (the component of along the smallest moment of inertia), as discussed in Faure et al. (2011). In addition, for each doublet in the ladder, the lower level (which corresponds to preferentially oriented along the direction of the greatest moment of inertia) is found to be favored. It should be noted that this result was shown to explain the anti-inversion of the doublet in interstellar formaldehyde (Townes & Cheung, 1969; Troscompt et al., 2009). In the case of methyl formate, however, this doublet is inverted in Sgr B2 (Brown et al., 1975; Churchwell et al., 1980). This disparity is not surprising as the nuclear symmetries and selection rules are different. Thus, in contrast to formaldehyde, both collisional and radiative transitions between the and ladders are allowed in methyl formate, as detailed below.
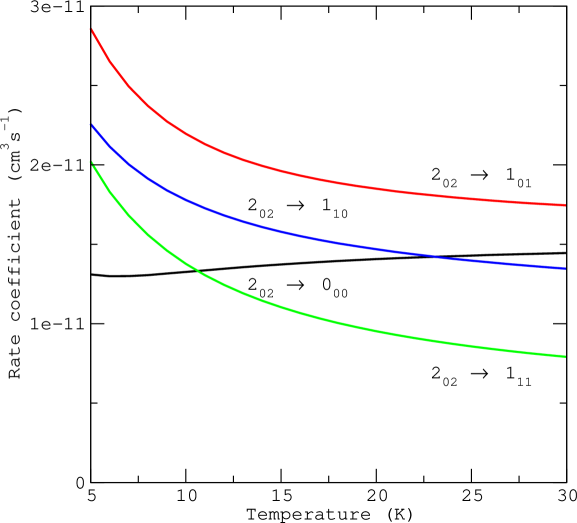
In Fig.3, rate coefficients for collisional deexcitation transitions from the level are presented. We note that the largest rate is for the excitation transition (not plotted), as expected from the above propensity rules. It is observed in Fig. 3 that the level preferentially deexcites to the level . In the case of the doublet, the upper level is favored with a rate which is a factor of 1.7 (at 30 K) larger than the deexcitation rate to the lower level . This contrasts with collisions from the ground state . Thus, following the initial excitation , the level relaxes preferentially to the upper level of the doublet.
Radiatively, for an asymmetric-top with dipole components along the and inertia axes333The and inertia axis correspond respectively to the and axis in the plane of the molecule, as defined in Faure et al. (2011)., the standard (rigorous) selection rules are:
| (2) |
| (3) |
The strongest radiative transitions are indicated by arrows in Fig.1. It is shown in particular that the spontaneous decay rate from the to level is about 3.4 times that from the to the level. This argument was employed by Brown et al. (1975) to explain that the doublet is likely inverted and amplifies the continuum emission of Sgr B2. In fact, this radiative effect adds to the preferential collisional deexcitation . As a result, both collisional and radiative transitions are expected to favor the inversion of the doublet . As the critical densities444The critical density for a particular level is given by the ratio between the sum of all radiative rates and the sum of all deexcitation collisional rates from this level. for the and levels are about 300 cm-3 and 1500 cm-3, respectively, inversion is expected to occur at low density ( cm-3). Note that the above arguments do not necessarily hold for other lines and only non-LTE radiative transfer calculations can predict which transitions are inverted for a given set of physical conditions.
3 Observations
The PRIMOS survey is a National Radio Astronomy Observatory (NRAO) Robert C. Byrd Green Bank Telescope (GBT) Legacy Program555Access to the entire PRIMOS data and specifics on observing strategies are available at www.cv.nrao.edu/aremijan/PRIMOS/. started in 2007 to provide a complete spectral line survey in frequency ranging from 300 MHz to 50 GHz toward the preeminent source of molecular emission in the Galaxy - Sgr B2(N). Of the more than 180 interstellar molecules detected, more than half have been detected first in the Sgr B2 star-forming region. This region contains compact hot molecular cores of arcsecond dimensions (Belloche et al., 2008, 2009; Nummelin et al., 2000; Liu & Snyder, 1999), molecular maser emitting regions (see e.g. McGrath et al., 2004; Mehringer et al., 1994, 1997; Gaume & Claussen, 1990), and ultracompact continuum sources surrounded by larger-scale continuum features as well as molecular material extended on the order of arcminutes (see e.g. Jones et al., 2011, and references therein). In addition, small-scale and large-scale shock phenomena characterize the complex. In particular, the hot molecular core known as the “Large Molecule Heimat” (LMH) has for the last twenty years been the first source searched to detect and identify new large interstellar molecules since many of the large organic species have previously been confined to its 5” diameter (Miao & Snyder, 1997). However, the recent GBT detections of large organic molecules (Neill et al., 2012; Zaleski et al., 2013; Loomis et al., 2013, and references therein), have suggested that prebiotic molecules found toward the Sgr B2(N) complex are extended, perhaps even on the order of a 2’x2’ field. Data were taken in the OFF-ON position switching mode with two-minute scans toward the “ON” pointing position (J2000 = 17h47m19.8s, J2000 = ). Observations continue to expand the frequency range of the PRIMOS survey. For more details on the PRIMOS survey observations see Neill et al. (2012).
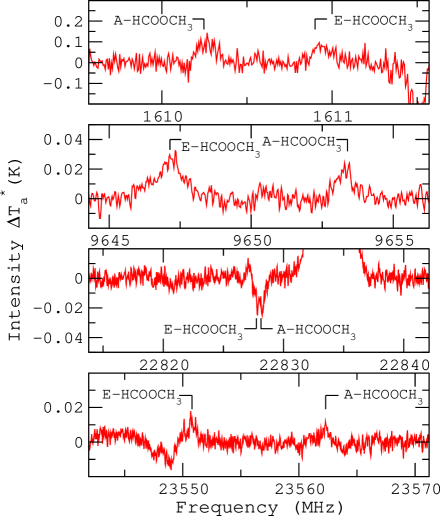
From 300 MHz to 50 GHz, a total of 49 methyl formate transitions with upper levels below 25 K were firmly identified (23 -type and 26 -type). We note that about 80% of the detected lines have upper levels below 10 K. Examples of spectral features are illustrated in Fig. 4 for both emission and absorption lines. An LSR source velocity of 64 kms-1 was assumed. Typical line widths are 10 kms-1. The peak intensities were measured at each observed transition and are reported below in Figs. 5 and 6. The authors encourage the reader to obtain the full set of spectral line data from the PRIMOS website, in order to perform more detailed analyses.
4 Non-LTE calculations
Radiative transfer calculations were performed with the RADEX code (van der Tak et al., 2007), using the Large Velocity Gradient (LVG) approximation for a uniform expanding sphere. The RADEX LVG code was employed to compute the line excitation temperatures () and opacities () for a given column density (), kinetic temperature () and density of H2 (). The two symmetries -HCOOCH3 and -HCOOCH3 were treated separately and we included 65 rotational levels for both species, with the highest energy level () lying at 28.8 K above the ground state. Grids of models were computed for kinetic temperatures of 5–30 K (as constrained by the collisional data), column densities between 1012 and cm-2 and H2 densities in the range 10–107 cm-3. The line width (FWHM) was fixed at 10.0 kms-1, as deduced from the PRIMOS spectrum.
For each line in the range 1–49 GHz, the solution of the radiative transfer equation was expressed as the antenna temperature:
| (4) |
where , is the frequency of the transition, and are the excitation temperature and opacity computed by RADEX, 2.725 K is the temperature of the (local) cosmic microwave brackground and is the main beam background continuum temperature of Sgr B2(N), as measured by the GBT, which varies from 95 K at 1.6 GHz down to 1.2 K at 49 GHz. This continuum is consistent with optically thin, nonthermal (synchrotron) emission with a flux density spectral index of -0.7 and a gaussian source size of 143” at 1 GHz that decreases with increasing frequency as (Hollis et al., 2007).
In Eq. 4, it is assumed that the methyl formate cloud is extended and fills the GBT half-power beamwidth (, where is in units of GHz) with a unit filling factor666It is also implicitly assumed that the continuum source is entirely covered by the HCOOCH3 cloud.. This approximation is reasonable for transitions above 5 GHz since many complex molecules like, e.g., glycolaldehyde have significant spatial scales on the order of arcminutes (Hollis et al., 2004). At lower frequencies, the hypothesis of a unit filling factor is questionable. However, in this frequency range, both and are much smaller than (see below) so that beam dilution effects are small and Eq. 4 reduces to:
| (5) |
and for an optically thin line:
| (6) |
It should be noted that according to Eq. 5, a low frequency transition will be observed in emission only if it is inverted (i.e. has a negative opacity), otherwise it will be in absorption.
An unweighted least-squares fit was performed to determine the physical parameters that best reproduce the emission intensities in the PRIMOS spectrum. All 49 detected transitions of methyl formate were employed in the minimization procedure. A good agreement was found between predicted and observed values, as shown in Figs. 5 and 6 where line intensities from our best non-LTE model are compared to the PRIMOS data in the frequency range 1–49 GHz. Lines with computed intensities below 10 mK are not displayed. It is observed that the intensities of the 10 strongest lines (those above 100 mK) are reproduced to within 25% by our non-LTE model. The average error between the data and the model is 20 mK. We also notice that the 2 PRIMOS absorption lines at 22.83 GHz (displayed in Fig. 4) are predicted in emission by our model. Inversely, a few lines are predicted in absorption in our model but they are not detected. As discussed below, these differences likely reflect density and temperature inhomogeneities. We also note that some predicted lines are not observed in the PRIMOS spectrum owing to contamination by other species, e.g. the -type transition at 19.3 GHz which coincides with a recombination line.

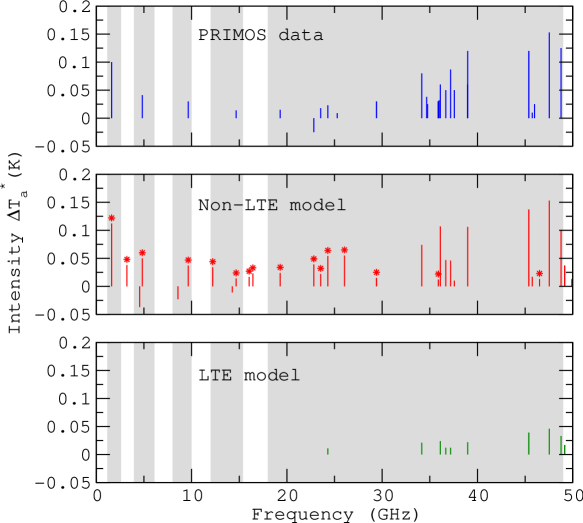
The physical parameters from the best fit model are listed in Table 1. We notice that they are identical for -HCOOCH3 and -HCOOCH3, as expected. As a result, the / ratio is found to be equal to unity and the total column density of HCOOCH3 is cm-2. The goodness of the fit can be judged by the reduced chi-squared values of 1.8–1.9 and the corresponding root mean square deviations of 27 mK. The fit is thus surprisingly good given the simplicity of the physical model employed (uniform sphere) compared to the complexity of the Sgr B2 source. Error limits on the physical parameters are difficult to estimate, in particular the actual kinetic temperature might exceed 30 K which is the highest available value from our collisional data. This important point is further discussed in Section 5. Uncertainties in the parameters and were estimated from the analysis of confidence contour levels and are typically a factor of 2. As shown below, however, the lowest-frequency transitions are much more sensitive to the density of H2 than the highest-frequency ones.
| -HCOOCH2 | -HCOOCH3 | |
| (K) | 30 | 30 |
| (cm-3) | ||
| (cm-2) | ||
| 1.84 | 1.88 | |
| rms (mK) | 27.1 | 27.4 |
We have also reported in Figs. 5 and 6 (bottom panels) the predicted spectrum for LTE conditions where all HCOOCH3 lines are thermalized at the kinetic temperature, i.e. K, keeping the column density fixed at the best fit value. We observed that all line intensities are significantly underestimated, especially those at the lowest frequencies. This plot thus clearly illustrates the non-LTE nature of the GBT methyl formate spectrum.
In Figs. 5 and 6, all transitions marked with an asterik are (weak) masers, i.e. their excitation temperature and opacity are negative. We thus observe that all detected emission lines with a frequency below 30 GHz are masers. Inversion was of course expected for the lowest 1.61 GHz transition, as anticipated by Brown et al. (1975). These authors employed Eq. 6 above, from which they derived the (negative) apparent opacity . They chose an arbitrary 1 percent inversion777The population inversion precentage is defined as where and are the populations of the upper and lower level of the transition, respectively. for the doublet, corresponding to an excitation temperature K, and they derived a column density of cm-2 for the lower -state. The excitation temperature computed with RADEX for the 1.61 GHz line of -HCOOCH3 is plotted in the top panel of Fig. 7. In this figure, the kinetic temperature is fixed at 30 K and the column density at cm-3. The excitation temperature of the 1.61 GHz line is found to be negative over a wide range (4 orders of magnitude) of densities: from 50 to cm-3. We thus demonstrate that the inversion of the doublet is a robust phenomenon. In our best model ( cm-3), the excitation temperature is -2.3 K, corresponding to 1.7 percent inversion, which is close to the guessed value of Brown et al. (1975).
The density range where inversion occurs is however much shorter for other transitions. For example, the line at 23.56 GHz (medium panel in Fig. 7) is inverted over the range from to cm-3, with -13.4 K in our best model (i.e. 4 percent inversion). In fact, this density range tends to decrease with increasing frequency and above 30 GHz, most transitions cannot be inverted. For these lines, the excitation temperature approaches the kinetic temperature of 30 K (i.e. thermalization) above a few cm-3. An example is given with the line at 47.54 GHz plotted in the bottom panel of Fig. 7. We note that the critical densities are typically cm-3 for all levels below 30 K. Thermalization of the rotational lines is therefore expected at densities above 105 cm-3, as shown in Fig. 7, but the occurence of population inversion is difficult to predict as it is very sensitive to the collisional rates. We note in particular that non-inverted transitions should appear in absorption against the continuum, as predicted by our model for the lines at 4.55, 8.57 and 14.27 GHz (see Figs. 5 and 6). These lines are however not detected. The only detected absorption lines are those at 22.83 GHz (), which are predicted in emission by our best model. These discrepancies might simply reflect density and temperature inhomogeneities in front of Sgr B2(N). Indeed, at densities higher than cm-3, the predicted absorption lines disappear (their intensities fall below 10 mK). Inversely, the population inversion of the 22.83 GHz transitions is quenched at densities lower than cm-3 where the two lines are predicted in absorption.
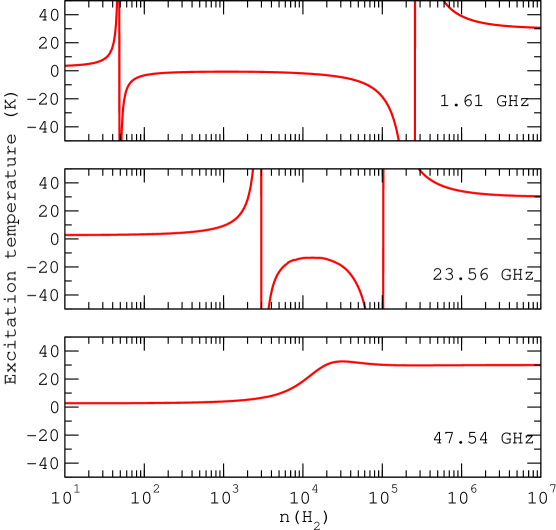
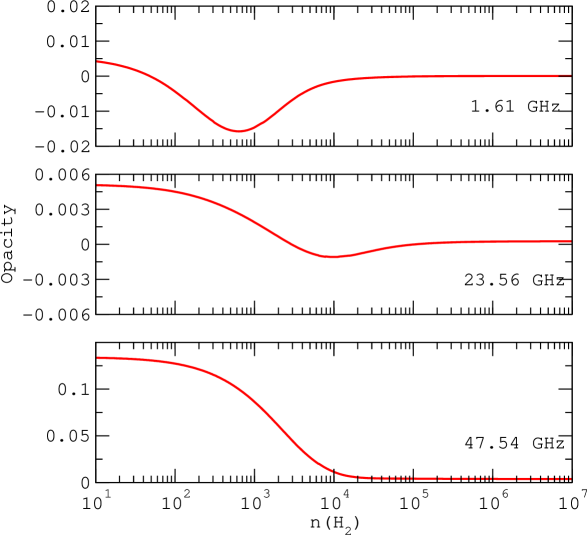
The opacities of the three above transitions (at 1.61, 23.56 and 47.54 GHz) are plotted in Fig. 8. For the two maser lines, the largest opacities (in absolute value) are found close to the critical densities of the corresponding levels, i.e. cm-3 for the line at 1.61 GHz and cm-3 for the line at 23.56 GHz. For the non-inverted transition at 47.54 GHz, the opacity is found to increase significantly with decreasing H2 density below 104 cm-3. In contrast to the lowest frequency (1–5 GHz) transitions, where the line intensity depends only on and (see Eq. 5), the three terms , and are in competition at higher frequencies. In this regime the value of the excitation temperature is crucial.
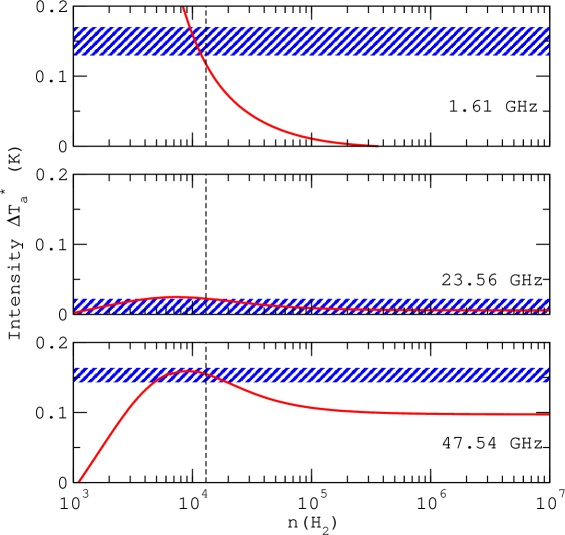
This point is clearly illustrated in Fig. 9 where the intensities of the three lines are found to peak at about the critical densities (the 1.61 GHz line has a maximum of 1.5 K at 103 cm-3). Finally, Fig. 9 also shows that the GBT intensities of the three lines (blue hatched zones) are reproduced for cm-3, as expected from the best fit results. We also notice that the 1.61 GHz line gives the strongest constraint on the H2 density.
5 Discussion
The above non-LTE calculations have demonstrated that the GBT methyl formate observations are sampling a presumably cold ( K) and moderately dense ( cm-3) extended region surrounding Sgr B2(N). This result is consistent with recent PRIMOS studies showing that many of the large molecules identified toward Sgr B2(N) have cold rotational temperatures (10 K) (see Zaleski et al., 2013, and references therein). This is also in agreement with older millimetre-wave studies of methyl formate in Sgr B2. Thus Churchwell et al. (1980) and Cummins et al. (1986) found rotational temperatures of 8 and K, respectively, from HCOOCH3 lines between 70 and 150 GHz (and energy levels below 60 K). These rotational temperatures are below our estimate of the kinetic temperature, as expected for subthermal excitation. The methyl formate column density was also estimated by these authors who found cm-2 and cm-2, respectively. Our determination of the column density ( cm-2) is thus in good agreement with these pioneering studies. As noted above, however, the kinetic temperature could exceed 30 K, which is the highest available temperature in our collisional data. We note in this context that high energy transitions of ammonia and other tracers observed in absorption toward Sgr B2 were interpreted as an evidence for a hot layer with K, outside the cold ( K) envelope (Huettemeister et al., 1995; Ceccarelli et al., 2002). The present model does not firmly exclude such high temperatures. However, with critical densities of cm-3, the rotational temperatures of methyl formate and other heavy molecules ( K) are not expected to differ substantially from the kinetic temperature. It seems therefore unlikely that the low-energy transitions of methyl formate originate from a hot gas.
On the other hand, our results are in sharp contrast with interferometric observations showing that HCOOCH3 resides predominantly in the compact (”) LMH hot core near Sgr B2(N) (Miao et al., 1995). This source is indeed characterized by very high densities ( cm-3) and gas temperatures ( K). Assuming a source size of 4” and a rotational temperature of 80 K, a column density of 4.5 cm-2 was derived recently for HCOOCH3 in the LMH (Belloche et al., 2009, 2013), which is three orders of magnitude larger than the value inferred in the present work. The abundance of methyl formate with respect to H2 in the LMH was estimated by Belloche et al. (2009) as , assuming an H2 column density of 1.3cm-2. It is difficult to have a good determination of the H2 column density in the region of cold HCOOCH3 emission. However, this region was probed by several molecular tracers in the past and rough estimates were inferred. Thus, using continuum emission, CO isotope emission as well as several transitions of HC3N, Lis & Goldsmith (1991) determined a H2 column density of cm-2 for the envelope of Sgr B2(N) characterized by a mean density of cm-3 and a kinetic temperature of K. The methyl formate abundance in the cold region surrounding Sgr B2(N) can thus be estimated as , which is two orders of magnitude less than in the LMH hot core and very similar to the abundances derived by Bacmann et al. (2012) in the cold ( K) protostellar core L1689B. This result also supports low kinetic temperatures.
The detection of methyl formate and other complex molecules in the cold interstellar gas ( K) challenges our current understanding of interstellar chemistry. Indeed, reactive heavy radicals like HCO and CH3O cannot easily diffuse on cold grain surfaces. Non-thermal processing of the grain mantles, such as cosmic-ray bombardment or ultraviolet radiation, are therefore required to induce diffusion, reaction and evaporation. Post-evaporation gas-phase chemistry may also be crucial in producing larger species from precursors formed on grains like formaldehyde and methanol. An interesting constraint on the chemistry of methyl formate is possibly provided by the recent (tentative) detection of trans-methyl formate in absorption toward Sgr B2(N) using the PRIMOS survey (Neill et al., 2012). These authors have determined a column density of cm-2 and a rotational temperature of K, suggesting that the trans conformer also traces the cold envelope surrounding Sgr B2(N). Assuming the two conformers have the same spatial distribution, the cis/trans ratio is thus found to be 10 in the cold gas, indicating strongly non-equilibrium processes. Indeed, as the trans conformer is less stable than cis by about 2900 K, the thermal equilibrium ratio at 30 K is about ! A discussion on the gas-phase chemical processes that could lead to a large abundance of the trans conformer can be found in Neill et al. (2012) and Cole et al. (2012).
6 Conclusion
We have presented in this work the first set of collisional rate coefficients for the rotational excitation of cis-methyl formate by H2 in the temperature range 5–30 K. The scattering calculations were performed on the HCOOCH3–He PES of Faure et al. (2011). Collisional propensity rules were shown to differ from the radiative selection rules, with transitions being favored. These collisional coefficients were employed in a non-LTE radiative transfer treatment of methyl formate rotational lines and the results were compared with the PRIMOS survey GBT observations toward Sgr B2(N). A total of 49 rotational transitions of methyl formate, with upper levels below 25 K, were identified in the PRIMOS data. Our best fit model suggests that these transitions sample a cold ( K), moderately dense ( cm-3) and extended ( arcminutes) region surrounding Sgr B2(N). In addition, our calculations indicate that all detected emission lines with a frequency below 30 GHz are collisionally pumped weak masers amplifying the background of Sgr B2(N). This result confirms the pioneering interpretation of Brown et al. (1975) based on the 1.61 GHz line and demonstrates the generality of the inversion mechanism for the low-lying transitions of methyl formate. This collisional process combined with a relatively strong and extended continuum background could thus explain the emission spectra of many complex organics. On the other hand, if the inversion cannot be established (or is quenched) then absorption lines are expected. This is indeed observed for the cis-methyl formate lines at 22.83 GHz and for other species like e.g. trans-methyl formate for which all observed features are in absorption (Neill et al., 2012). As a result, emission spectra do not necessarily reflect higher kinetic temperatures or densities but rather the possibility of population inversions.
We have derived a column density for cis-methyl formate of cm-2, in good agreement with previous estimates based on millimetre-wave studies. This value is only a factor of 10 larger than the column density deduced by Neill et al. (2012) for the trans conformer in the same source. The origin of the different conformers and isomers of methyl formate in low temperature interstellar environments is still matter of debate (see Cole et al., 2012, and references therein) but such a low cis/trans ratio certainly provides a very strong constraint on chemical models (provided that the two conformers are located in the same spatial region). We note in this context the recent experimental evidence of quantum tunneling in the gas-phase reaction between CH3OH and OH (Shannon et al., 2013) suggesting that, in contrast to the usual assumption, neutral-neutral reactions with an activation barrier could play an important role in the cold post-evaporation gas-phase chemistry.
It should be noted finally that collisional rate coefficients for other heavy molecules are urgently needed in order to both accurately determine the abundance and excitation of complex organics via radiative transfer models and quantitatively investigate the occurence, or absence, of maser action.
7 Acknowledgements
This work has been supported by the French INSU/CNRS Program “Physique et Chimie du Milieu Interstellaire” (PCMI) and by the Agence Nationale de la Recherche (ANR-FORCOMS), contract ANR-08-BLAN-022. The National Radio Astronomy Observatory is a facility of the National Science Foundation operated under cooperative agreement by Associated Universities, Inc. KS acknowledges support by NSF grant CHE-1152899. Aurore Bacmann, Cecilia Ceccarelli, Pierre Hily-Blant, Sébastien Maret and Céline Toubin are acknowledged for useful discussions.
References
- Alexander & Manolopoulos (1987) Alexander, M. H., & Manolopoulos, D. E. 1987, J. Chem. Phys., 86, 2044
- Bacmann et al. (2012) Bacmann, A., Taquet, V., Faure, A., Kahane, C., & Ceccarelli, C. 2012, A&A, 541, L12
- Belloche et al. (2009) Belloche, A., Garrod, R. T., Müller, H. S. P., et al. 2009, A&A, 499, 215
- Belloche et al. (2008) Belloche, A., Menten, K. M., Comito, C., et al. 2008, A&A, 482, 179
- Belloche et al. (2013) Belloche, A., Müller, H. S. P., Menten, K. M., Schilke, P., & Comito, C. 2013, A&A, 559, A47
- Bockelée-Morvan et al. (2000) Bockelée-Morvan, D., Lis, D. C., Wink, J. E., et al. 2000, A&A, 353, 1101
- Bottinelli et al. (2007) Bottinelli, S., Ceccarelli, C., Williams, J. P., & Lefloch, B. 2007, A&A, 463, 601
- Brown et al. (1975) Brown, R. D., Crofts, J. G., Godfrey, P. D., et al. 1975, ApJ, 197, L29
- Ceccarelli et al. (2002) Ceccarelli, C., Baluteau, J.-P., Walmsley, M., et al. 2002, A&A, 383, 603
- Cernicharo et al. (2012) Cernicharo, J., Marcelino, N., Roueff, E., et al. 2012, ApJ, 759, L43
- Churchwell et al. (1980) Churchwell, E., Nash, A., Rahe, J., et al. 1980, ApJ, 241, L169
- Churchwell & Winnewisser (1975) Churchwell, E., & Winnewisser, G. 1975, A&A, 45, 229
- Cole et al. (2012) Cole, C. A., Wehres, N., Yang, Z., et al. 2012, ApJ, 754, L5
- Cummins et al. (1986) Cummins, S. E., Linke, R. A., & Thaddeus, P. 1986, ApJS, 60, 819
- Curl, Jr. (1959) Curl, Jr., R. F. 1959, J. Chem. Phys., 30, 1529
- Dickens et al. (2001) Dickens, J. E., Irvine, W. M., Nummelin, A., et al. 2001, Spectrochim. Acta A, 57, 643
- Dubernet et al. (2013) Dubernet, M.-L., Alexander, M. H., Ba, Y. A., et al. 2013, A&A, 553, A50
- Faure et al. (2013) Faure, A., Hily-Blant, P., Le Gal, R., Rist, C., & Pineau des Forêts, G. 2013, ApJ, 770, L2
- Faure et al. (2011) Faure, A., Szalewicz, K., & Wiesenfeld, L. 2011, J. Chem. Phys., 135, 024301
- Favre et al. (2011) Favre, C., Despois, D., Brouillet, N., et al. 2011, A&A, 532, A32
- Garrod & Herbst (2006) Garrod, R. T., & Herbst, E. 2006, A&A, 457, 927
- Gaume & Claussen (1990) Gaume, R. A., & Claussen, M. J. 1990, ApJ, 351, 538
- Gottlieb et al. (1973) Gottlieb, C. A., Palmer, P., Rickard, L. J., & Zuckerman, B. 1973, ApJ, 182, 699
- Hollis et al. (2004) Hollis, J. M., Jewell, P. R., Lovas, F. J., Remijan, A., & Møllendal, H. 2004, ApJ, 610, L21
- Hollis et al. (2007) Hollis, J. M., Jewell, P. R., Remijan, A. J., & Lovas, F. J. 2007, ApJ, 660, L125
- Hollis et al. (2000) Hollis, J. M., Lovas, F. J., & Jewell, P. R. 2000, ApJ, 540, L107
- Horn et al. (2004) Horn, A., Møllendal, H., Sekiguchi, O., et al. 2004, ApJ, 611, 605
- Huettemeister et al. (1995) Huettemeister, S., Wilson, T. L., Mauersberger, R., et al. 1995, A&A, 294, 667
- Jones et al. (2011) Jones, P. A., Burton, M. G., Tothill, N. F. H., & Cunningham, M. R. 2011, MNRAS, 411, 2293
- Lis & Goldsmith (1991) Lis, D. C., & Goldsmith, P. F. 1991, ApJ, 369, 157
- Liu & Snyder (1999) Liu, S.-Y., & Snyder, L. E. 1999, ApJ, 523, 683
- Loomis et al. (2013) Loomis, R. A., Zaleski, D. P., Steber, A. L., et al. 2013, ApJ, 765, L9
- McGrath et al. (2004) McGrath, E. J., Goss, W. M., & De Pree, C. G. 2004, ApJS, 155, 577
- Mehringer et al. (1994) Mehringer, D. M., Goss, W. M., & Palmer, P. 1994, ApJ, 434, 237
- Mehringer et al. (1997) Mehringer, D. M., Snyder, L. E., Miao, Y., & Lovas, F. J. 1997, ApJ, 480, L71
- Menten (2004) Menten, K. M. 2004, in The Dense Interstellar Medium in Galaxies, ed. S. Pfalzner, C. Kramer, C. Staubmeier, & A. Heithausen (Springer: Berlin), 69
- Miao et al. (1995) Miao, Y., Mehringer, D. M., Kuan, Y.-J., & Snyder, L. E. 1995, ApJ, 445, L59
- Miao & Snyder (1997) Miao, Y., & Snyder, L. E. 1997, ApJ, 480, L67
- Modica et al. (2012) Modica, P., Palumbo, M. E., & Strazzulla, G. 2012, Planet. Space Sci., 73, 425
- Neill et al. (2012) Neill, J. L., Muckle, M. T., Zaleski, D. P., et al. 2012, ApJ, 755, 153
- Nummelin et al. (2000) Nummelin, A., Bergman, P., Hjalmarson, Å., et al. 2000, ApJS, 128, 213
- Pickett et al. (1998) Pickett, H. M., Poynter, R. L., Cohen, E. A., et al. 1998, J. Quant. Spec. Radiat. Transf., 60, 883
- Rabli & Flower (2011) Rabli, D., & Flower, D. R. 2011, MNRAS, 411, 2093
- Remijan & Markwick-Kemper (2007) Remijan, A. J., & Markwick-Kemper, A. 2007, in Bulletin of the American Astronomical Society, Vol. 39, American Astronomical Society Meeting Abstracts, 132.11
- Schöier et al. (2005) Schöier, F. L., van der Tak, F. F. S., van Dishoeck, E. F., & Black, J. H. 2005, A&A, 432, 369
- Shannon et al. (2013) Shannon, R. J., Blitz, M. A., Goddard, A., & Heard, D. E. 2013, Nature Chem., 5, 745
- Townes & Cheung (1969) Townes, C. H., & Cheung, A. C. 1969, ApJ, 157, L103
- Troscompt et al. (2009) Troscompt, N., Faure, A., Maret, S., et al. 2009, A&A, 506, 1243
- van der Tak et al. (2007) van der Tak, F. F. S., Black, J. H., Schöier, F. L., Jansen, D. J., & van Dishoeck, E. F. 2007, A&A, 468, 627
- Vasyunin & Herbst (2013) Vasyunin, A. I., & Herbst, E. 2013, ApJ, 769, 34
- Wernli et al. (2007) Wernli, M., Wiesenfeld, L., Faure, A., & Valiron, P. 2007, A&A, 464, 1147
- Zaleski et al. (2013) Zaleski, D. P., Seifert, N. A., Steber, A. L., et al. 2013, ApJ, 765, L10